

Trading with the MQL5 Economic Calendar (Part 11): Modular Canvas News Dashboard
 1 678
1 678
 0
0

Introduction
In algorithmic trading, the tools we use to monitor and act on economic news events must be both reliable and maintainable. A single-file program that handles UI construction, event filtering, trade logic, and chart interaction in one place works well at first, but becomes increasingly difficult to extend as features grow. In Part 10 of this series, we built a draggable object-based dashboard in a single MetaQuotes Language 5 (MQL5) file. It included hover effects, a scrollbar, currency and impact filters, and a pre-news trade execution engine. That approach served its purpose, but it left no clean boundary between concerns: rendering logic sat next to trade logic, and adding one feature risked breaking another.
In this article, we address that gap. We rebuild the dashboard from the ground up. We replace chart objects with a canvas renderer and split the program into four dedicated modules, each responsible for one concern. The canvas drawing fundamentals, including rounded rectangle rendering, supersampling, anti-aliased primitives, and alpha compositing, are covered in depth in our MQL5 Trading Tools series. Readers who want a thorough understanding can refer to that series directly. Here, we focus entirely on what is new: the modular architecture, the dual theme system, the resizable layout, the collapsible day groups, the revised value tracking, and the live countdown with toast notifications. We will cover the following topics:
- From a Monolithic Panel to a Modular Canvas Dashboard
- Core Module and Data Structures
- Logic, Rendering, and Interaction Modules
- Visualization
- Conclusion
By the end of this article, we will have a fully modular MQL5 news dashboard that is easier to extend, visually richer, and more responsive than its predecessor.
From a Monolithic Panel to a Modular Canvas Dashboard
In Part 10, the entire program lived in a single file. Every concern — UI construction, event filtering, scroll management, hover detection, panel dragging, and trade logic — was handled in one place. The dashboard used MetaTrader 5 chart objects. Each event row required creating and positioning multiple label objects individually, dragging the panel meant repositioning every object on every mouse move, and the scrollbar consisted of three independently managed objects. Colors were hardcoded, and the layout was fixed in size.
Part 11 replaces all of that with a canvas-based rendering system and a four-module architecture. The chart objects are gone. In their place is a single canvas bitmap that the program draws directly onto, with a second canvas on top as a separator overlay. The entire dashboard — background, header, filter chips, event rows, scrollbar, toast, and countdown banner — is rendered in one pass. Because everything is drawn rather than constructed from objects, the layout responds to runtime changes: the dashboard dimensions are variables, column widths scale proportionally, and a full redraw takes one function call.
The program is split across four dedicated modules. The core module owns all shared data — the theme palette, event structs, scroll state, and layout constants. The logic module owns all data operations — loading events, applying filters, building the row plan, and managing trade candidate searches. The render module owns all drawing — it reads from the data layer and paints onto the canvas without modifying state. The interact module owns all user input — translating mouse moves, clicks, drags, and wheel events into state changes and triggering redraws. A sentinel defined in the main entry point prevents duplicate declarations when all four modules compile together. In a nutshell, here is what we intend to achieve.

Core Module and Data Structures
Layout Constants and Runtime Resize State
The dashboard now operates with runtime-driven width and height instead of fixed dimensions. Bounds prevent unusable layouts, and a small set of state variables tracks active resize drags from either the right or bottom edge.
//+------------------------------------------------------------------+
//|                                                    News Core.mqh |
//|                           Copyright 2026, Allan Munene Mutiiria. |
//|                                   https://t.me/Forex_Algo_Trader |
//+------------------------------------------------------------------+
#property copyright "Copyright 2026, Allan Munene Mutiiria."
#property link      "https://t.me/Forex_Algo_Trader"

//--- Include guard
#ifndef NEWS_CORE_MQH
#define NEWS_CORE_MQH

//--- Include canvas library
#include <Canvas/Canvas.mqh>

//+------------------------------------------------------------------+
//| Layout Constants                                                 |
//+------------------------------------------------------------------+
//--- Runtime dashboard width driven by g_news_dashW; bounds prevent unusable layouts
#define NEWS_DASHBOARD_W_DEFAULT  700  // Default starting width
#define NEWS_DASHBOARD_W_MIN      400  // Minimum allowed width
#define NEWS_DASHBOARD_W_MAX      1400 // Maximum allowed width

//--- Vertical bounds; flexible section is the events table
#define NEWS_DASHBOARD_H_DEFAULT  420  // Default starting height
#define NEWS_DASHBOARD_H_MIN      320  // Minimum height for at least 3 rows
#define NEWS_DASHBOARD_H_MAX      900  // Maximum allowed height

#define NEWS_HEADER_H        40 // Header strip height
#define NEWS_FILTER_H        36 // Filter toggle row height
#define NEWS_CURR_ROW_H      32 // Currency chip row height
#define NEWS_IMPACT_ROW_H    32 // Impact pill row height
#define NEWS_TABLE_HDR_H     28 // Table header row height
#define NEWS_ROW_H           26 // Event row height
#define NEWS_VISIBLE_ROWS     8 // Default visible row count (computed at runtime)
#define NEWS_SIDE_PAD        10 // Horizontal padding inside dashboard
#define NEWS_VERT_GAP         6 // Vertical gap between sections
#define NEWS_RESIZE_HOT_W     6 // Right-edge resize hot zone width
#define NEWS_RESIZE_HOT_H     6 // Bottom-edge resize hot zone height
#define NEWS_RESIZE_HANDLE_H 30 // Visible right-edge handle length (centered)
#define NEWS_RESIZE_HANDLE_W 30 // Visible bottom-edge handle length (centered)

//+------------------------------------------------------------------+
//| Runtime Dashboard Size and Resize State                          |
//+------------------------------------------------------------------+
int  g_news_dashW             = NEWS_DASHBOARD_W_DEFAULT; // Current dashboard width
int  g_news_dashH             = NEWS_DASHBOARD_H_DEFAULT; // Current dashboard height
bool g_news_resizing          = false;                    // Right-edge drag active flag
int  g_news_resizeStartMouseX = 0;                        // Mouse X at resize start
int  g_news_resizeStartW      = 0;                        // Dashboard width at resize start
bool g_news_resizingV         = false;                    // Bottom-edge drag active flag
int  g_news_resizeStartMouseY = 0;                        // Mouse Y at resize start
int  g_news_resizeStartH      = 0;                        // Dashboard height at resize start

//--- Backwards-compatibility aliases
#define NEWS_DASHBOARD_W g_news_dashW
#define NEWS_DASHBOARD_H g_news_dashH

//+------------------------------------------------------------------+
//| Table Column Reference Widths                                    |
//+------------------------------------------------------------------+
//--- Reference widths at default dashboard width 700; all columns scale proportionally
const int    NEWS_COL_W_REF[]  = {68, 48, 42, 28, 215, 52, 60, 60, 70};
const string NEWS_COL_LABELS[] = {"Date", "Time", "Cur.", "Imp.", "Event", "Actual", "Forecast", "Previous", "Remain"};
#define NEWS_COL_COUNT 9

//--- Actual current column widths after proportional scaling; filled by News_ComputeColumnWidths
int g_news_colW[NEWS_COL_COUNT];

//+------------------------------------------------------------------+
//| Font Size Constants                                              |
//+------------------------------------------------------------------+
#define NEWS_FONT_TITLE     12 // Title text size
#define NEWS_FONT_HEADING   10 // Heading text size
#define NEWS_FONT_BODY       9 // Body text size
#define NEWS_FONT_LABEL      9 // Label text size
#define NEWS_FONT_BUTTON     9 // Button text size
#define NEWS_FONT_TIMESTAMP  8 // Timestamp text size

//+------------------------------------------------------------------+
//| Glyph Codes                                                      |
//+------------------------------------------------------------------+
#define NEWS_GLYPH_CLOSE      "r"     // Webdings X close glyph
#define NEWS_GLYPH_CHECK      "\x6FC" // Wingdings checkmark glyph
#define NEWS_GLYPH_CROSS      "\x71B" // Wingdings X mark glyph
#define NEWS_GLYPH_DOT        "l"     // Wingdings filled dot glyph
#define NEWS_GLYPH_ARROW_UP   "5"     // Webdings up arrow glyph
#define NEWS_GLYPH_ARROW_DOWN "6"     // Webdings down arrow glyph

//+------------------------------------------------------------------+
//| Canvas Object Names                                              |
//+------------------------------------------------------------------+
#define NEWS_CANVAS_NAME "NewsCanvasMain" // Main canvas object name

//+------------------------------------------------------------------+
//| Theme Color Globals                                              |
//+------------------------------------------------------------------+
color g_news_bg;                 // Dashboard background
color g_news_panelAlt;           // Alternate panel color
color g_news_headerBg;           // Header strip background
color g_news_border;             // Subtle border color
color g_news_borderAccent;       // Strong outer border color
color g_news_titleText;          // Primary text color
color g_news_subText;            // Secondary text color
color g_news_accent;             // Accent blue color

//--- Filter chip colors
color g_news_chipOnBg;           // Active chip background
color g_news_chipOnText;         // Active chip text
color g_news_chipOffBg;          // Inactive chip background
color g_news_chipOffText;        // Inactive chip text
color g_news_chipHoverTint;      // Hover overlay tint

//--- Currency chip colors
color g_news_currOnBg;           // Selected currency background
color g_news_currOnText;         // Selected currency text
color g_news_currOffBg;          // Unselected currency background
color g_news_currOffText;        // Unselected currency text

//--- Impact pill colors (semantic; same in both themes)
color g_news_impNone;            // Impact none (gray)
color g_news_impLow;             // Impact low (yellow)
color g_news_impMed;             // Impact medium (orange)
color g_news_impHigh;            // Impact high (red)

//--- Table colors
color g_news_tableHdrBg;         // Table header strip background
color g_news_tableHdrText;       // Table header text
color g_news_rowAlt;             // Alternating row background
color g_news_rowText;            // Row text color
color g_news_rowHover;           // Row hover background

//--- Actual value direction colors
color g_news_actualUp;           // Actual beat forecast (green)
color g_news_actualDown;         // Actual missed forecast (red)
color g_news_revisedMark;        // Revised previous indicator (gold)
color g_news_remainSoon;         // Remain color when event is within 30 min

//--- Day separator row colors
color g_news_dayHeaderBg;        // Day separator background
color g_news_dayHeaderText;      // Day separator text

//--- Close button colors
color g_news_closeColor;         // Close glyph idle color
color g_news_closeColorHover;    // Close glyph hover color
color g_news_closeBgHover;       // Close button hover background

//--- Toast colors
color g_news_toastBg;            // Toast box background
color g_news_toastBorder;        // Toast box border
color g_news_toastSuccess;       // Toast success text
color g_news_toastError;         // Toast error text

//--- Countdown banner colors
color g_news_countdownBg;        // Active countdown background
color g_news_countdownReleaseBg; // Released countdown background
color g_news_countdownText;      // Countdown text color

//--- Scrollbar thumb colors
color g_news_scrollSlider;       // Idle thumb color
color g_news_scrollSliderHover;  // Hover thumb color
color g_news_scrollSliderDrag;   // Dragging thumb color

//--- Theme state
bool g_news_darkTheme = true; // Current theme flag

//+------------------------------------------------------------------+
//| Apply theme palette - dark or light                              |
//+------------------------------------------------------------------+
void News_ApplyTheme(bool dark)
  {
//--- Store current theme flag
   g_news_darkTheme = dark;
//--- Branch on theme mode
   if(dark)
     {
      //--- Apply dark theme: charcoal with blue accent
      g_news_bg              = (color)C'24,26,32';
      g_news_panelAlt        = (color)C'30,33,40';
      g_news_headerBg        = (color)C'18,20,24';
      g_news_border          = (color)C'48,52,60';
      g_news_borderAccent    = (color)C'72,78,90';
      g_news_titleText       = (color)C'232,234,240';
      g_news_subText         = (color)C'148,152,162';
      g_news_accent          = (color)C'68,138,255';
      g_news_chipOnBg        = (color)C'68,138,255';
      g_news_chipOnText      = (color)C'255,255,255';
      g_news_chipOffBg       = (color)C'40,44,52';
      g_news_chipOffText     = (color)C'180,184,194';
      g_news_chipHoverTint   = (color)C'255,255,255';
      g_news_currOnBg        = (color)C'48,80,128';
      g_news_currOnText      = (color)C'255,255,255';
      g_news_currOffBg       = (color)C'36,40,48';
      g_news_currOffText     = (color)C'160,164,174';
      g_news_impNone         = (color)C'120,124,132';
      g_news_impLow          = (color)C'230,200,80';
      g_news_impMed          = (color)C'240,150,60';
      g_news_impHigh         = (color)C'225,80,80';
      g_news_tableHdrBg      = (color)C'36,40,48';
      g_news_tableHdrText    = (color)C'200,204,214';
      g_news_rowAlt          = (color)C'28,30,36';
      g_news_rowText         = (color)C'220,222,232';
      g_news_rowHover        = (color)C'70,76,92';
      g_news_actualUp        = (color)C'120,210,130';
      g_news_actualDown      = (color)C'235,100,100';
      g_news_revisedMark     = (color)C'250,200,60';
      g_news_remainSoon      = (color)C'255,90,90';
      g_news_dayHeaderBg     = (color)C'48,80,128';
      g_news_dayHeaderText   = (color)C'235,238,245';
      g_news_closeColor      = (color)C'180,184,194';
      g_news_closeColorHover = (color)C'255,255,255';
      g_news_closeBgHover    = (color)C'180,60,60';
      g_news_toastBg         = (color)C'36,40,48';
      g_news_toastBorder     = (color)C'72,78,90';
      g_news_toastSuccess    = (color)C'120,200,120';
      g_news_toastError      = (color)C'225,100,100';
      g_news_countdownBg        = (color)C'48,80,128';
      g_news_countdownReleaseBg = (color)C'140,60,60';
      g_news_countdownText      = (color)C'255,255,255';
      g_news_scrollSlider       = (color)C'90,100,120';
      g_news_scrollSliderHover  = (color)C'140,150,170';
      g_news_scrollSliderDrag   = (color)C'88,160,255';
     }
   else
     {
      //--- Apply light theme: white with blue accent
      g_news_bg              = (color)C'248,249,251';
      g_news_panelAlt        = (color)C'255,255,255';
      g_news_headerBg        = (color)C'238,240,244';
      g_news_border          = (color)C'218,222,228';
      g_news_borderAccent    = (color)C'180,186,196';
      g_news_titleText       = (color)C'24,28,36';
      g_news_subText         = (color)C'108,114,124';
      g_news_accent          = (color)C'40,110,220';
      g_news_chipOnBg        = (color)C'40,110,220';
      g_news_chipOnText      = (color)C'255,255,255';
      g_news_chipOffBg       = (color)C'232,236,242';
      g_news_chipOffText     = (color)C'70,76,86';
      g_news_chipHoverTint   = (color)C'0,0,0';
      g_news_currOnBg        = (color)C'200,220,250';
      g_news_currOnText      = (color)C'30,60,140';
      g_news_currOffBg       = (color)C'238,240,244';
      g_news_currOffText     = (color)C'90,96,106';
      g_news_impNone         = (color)C'140,144,152';
      g_news_impLow          = (color)C'220,180,40';
      g_news_impMed          = (color)C'230,130,40';
      g_news_impHigh         = (color)C'210,60,60';
      g_news_tableHdrBg      = (color)C'232,236,242';
      g_news_tableHdrText    = (color)C'40,46,56';
      g_news_rowAlt          = (color)C'248,250,253';
      g_news_rowText         = (color)C'30,34,42';
      g_news_rowHover        = (color)C'232,238,248';
      g_news_actualUp        = (color)C'30,140,60';
      g_news_actualDown      = (color)C'200,40,40';
      g_news_revisedMark     = (color)C'200,110,15';
      g_news_remainSoon      = (color)C'205,40,40';
      g_news_dayHeaderBg     = (color)C'215,228,245';
      g_news_dayHeaderText   = (color)C'30,60,140';
      g_news_closeColor      = (color)C'120,126,136';
      g_news_closeColorHover = (color)C'255,255,255';
      g_news_closeBgHover    = (color)C'200,60,60';
      g_news_toastBg         = (color)C'255,255,255';
      g_news_toastBorder     = (color)C'180,186,196';
      g_news_toastSuccess    = (color)C'40,140,60';
      g_news_toastError      = (color)C'200,60,60';
      g_news_countdownBg        = (color)C'40,110,220';
      g_news_countdownReleaseBg = (color)C'200,80,80';
      g_news_countdownText      = (color)C'255,255,255';
      g_news_scrollSlider       = (color)C'170,178,190';
      g_news_scrollSliderHover  = (color)C'120,128,142';
      g_news_scrollSliderDrag   = (color)C'40,110,220';
     }
  }
We start the implementation by defining six bound constants for the dashboard footprint. The width range allows resizing from 400 to 1400 pixels, and the height range allows resizing from 320 to 900 pixels. These bounds prevent the user from collapsing the dashboard into something unreadable or expanding it beyond the chart canvas. Two more defaults seed the dashboard at 700×420 pixels on first launch, as before.
After defining the bounds, we declare the runtime state. Two integer variables store the current width and height, and the rest of the program reads them on every render. The remaining variables track an active resize drag. The horizontal flag and vertical flag tell the interaction layer whether a drag is in progress on the right edge or the bottom edge, respectively. The four integers paired with them record the mouse position and the dashboard size captured at the moment the drag began, so the delta between then and the current mouse position can be computed cleanly on each mouse move. Next, we handle pixel-based scrolling.
Pixel-Based Scrollbar State and Helpers
The scrollbar in the previous part operated on item indices, where each click of an arrow moved the visible window by one event row. Here we move to pixel-based scrolling, where the offset is measured in pixels rather than rows, which allows partial-row scrolling and smooth thumb drag.
//+------------------------------------------------------------------+
//| Scroll state structure                                           |
//+------------------------------------------------------------------+
struct NewsScrollState
  {
   int  scrollPx;        // Current scroll offset in pixels
   int  totalH;          // Total content height in pixels
   int  viewportH;       // Visible viewport height
   int  trackL;          // Track left X
   int  trackT;          // Track top Y
   int  trackR;          // Track right X
   int  trackB;          // Track bottom Y
   bool dragging;        // Drag in progress flag
   int  dragStartY;      // Mouse Y at drag start
   int  dragStartScroll; // scrollPx value at drag start
   bool hover;           // Cursor over track or thumb
   bool hoveredArea;     // Cursor over track area
   bool hoveredThumb;    // Cursor over thumb specifically
  };

//+------------------------------------------------------------------+
//| Initialize scroll state to defaults                              |
//+------------------------------------------------------------------+
void News_ScrollInit(NewsScrollState &s)
  {
//--- Zero all scroll fields
   s.scrollPx        = 0;
   s.totalH          = 0;
   s.viewportH       = 0;
   s.trackL          = 0;
   s.trackT          = 0;
   s.trackR          = 0;
   s.trackB          = 0;
   s.dragging        = false;
   s.dragStartY      = 0;
   s.dragStartScroll = 0;
   s.hover           = false;
   s.hoveredArea     = false;
   s.hoveredThumb    = false;
  }

//+------------------------------------------------------------------+
//| Compute maximum scroll position                                  |
//+------------------------------------------------------------------+
int News_ScrollMax(NewsScrollState &s)
  {
//--- Return positive overflow or zero
   const int m = s.totalH - s.viewportH;
   return (m > 0) ? m : 0;
  }

//+------------------------------------------------------------------+
//| Clamp current scroll position to valid range                     |
//+------------------------------------------------------------------+
void News_ScrollClamp(NewsScrollState &s)
  {
//--- Enforce lower and upper scroll bounds
   const int m = News_ScrollMax(s);
   if(s.scrollPx < 0) s.scrollPx = 0;
   if(s.scrollPx > m) s.scrollPx = m;
  }

//+------------------------------------------------------------------+
//| Test if scrollbar should be visible                              |
//+------------------------------------------------------------------+
bool News_ScrollVisible(NewsScrollState &s)
  {
//--- Scrollbar appears only when content exceeds viewport
   return s.totalH > s.viewportH;
  }

//+------------------------------------------------------------------+
//| Compute thumb rectangle within track                             |
//+------------------------------------------------------------------+
void News_ScrollThumbRect(NewsScrollState &s, int &outT, int &outB)
  {
//--- Handle degenerate track
   const int trackH = s.trackB - s.trackT;
   if(trackH <= 0 || s.totalH <= 0)
     {
      outT = s.trackT; outB = s.trackB;
      return;
     }
//--- Compute thumb height proportional to viewport/total ratio
   const double ratio = (double)s.viewportH / (double)s.totalH;
   int thumbH = (int)(trackH * ratio);
   if(thumbH < 20) thumbH = 20;
   if(thumbH > trackH) thumbH = trackH;
//--- Position thumb proportional to current scroll offset
   const int m = News_ScrollMax(s);
   const double scrollRatio = (m > 0) ? ((double)s.scrollPx / (double)m) : 0.0;
   const int avail = trackH - thumbH;
   outT = s.trackT + (int)(avail * scrollRatio);
   outB = outT + thumbH;
  }

//+------------------------------------------------------------------+
//| Hit-test scrollbar thumb                                         |
//+------------------------------------------------------------------+
bool News_ScrollHitThumb(NewsScrollState &s, int x, int y)
  {
//--- Reject points outside the track lane
   if(x < s.trackL - 2 || x > s.trackR + 2) return false;
//--- Test Y against current thumb bounds
   int tT, tB;
   News_ScrollThumbRect(s, tT, tB);
   return (y >= tT && y < tB);
  }

//+------------------------------------------------------------------+
//| Begin scroll drag from mouse y position                          |
//+------------------------------------------------------------------+
void News_ScrollBeginDrag(NewsScrollState &s, int y)
  {
//--- Record drag start state
   s.dragging        = true;
   s.dragStartY      = y;
   s.dragStartScroll = s.scrollPx;
  }

//+------------------------------------------------------------------+
//| Update drag with current mouse y                                 |
//+------------------------------------------------------------------+
void News_ScrollUpdateDrag(NewsScrollState &s, int y)
  {
//--- Abort if not in drag state
   if(!s.dragging) return;
   const int trackH = s.trackB - s.trackT;
   if(trackH <= 0) return;
//--- Convert pixel delta to scroll units and apply
   const int dy = y - s.dragStartY;
   const double scale = (double)s.totalH / (double)trackH;
   const int newScroll = s.dragStartScroll + (int)(dy * scale);
   s.scrollPx = newScroll;
   News_ScrollClamp(s);
  }

//+------------------------------------------------------------------+
//| End scroll drag                                                  |
//+------------------------------------------------------------------+
void News_ScrollEndDrag(NewsScrollState &s)
  {
//--- Clear drag flag
   s.dragging = false;
  }

//+------------------------------------------------------------------+
//| Apply mouse wheel delta to scroll position                       |
//+------------------------------------------------------------------+
void News_ScrollByWheel(NewsScrollState &s, int delta, int step)
  {
//--- Scroll up when delta is positive, down when negative
   if(delta > 0) s.scrollPx -= step;
   else          s.scrollPx += step;
   News_ScrollClamp(s);
  }

//+------------------------------------------------------------------+
//| Draw scrollbar with fully-rounded thumb onto canvas              |
//+------------------------------------------------------------------+
void News_ScrollDraw(CCanvas &canv, NewsScrollState &s)
  {
//--- Skip when scrollbar is not needed
   if(!News_ScrollVisible(s)) return;
   const int trackW = s.trackR - s.trackL;
   if(trackW <= 0) return;
//--- Compute thumb position
   int tT, tB;
   News_ScrollThumbRect(s, tT, tB);
   const int thumbH = tB - tT;
   if(thumbH <= 0) return;
//--- Pick thumb color based on current interaction state
   color thumbColor = g_news_scrollSlider;
   if(s.dragging)                       thumbColor = g_news_scrollSliderDrag;
   else if(s.hoveredThumb || s.hover)   thumbColor = g_news_scrollSliderHover;
//--- Draw fully-rounded thumb with radius equal to half track width
   const int radius = trackW / 2;
   News_FillRoundRect(canv, s.trackL, tT, trackW, thumbH, radius, ColorToARGB(thumbColor, 255));
  }

//+------------------------------------------------------------------+
//| Global Scroll State                                              |
//+------------------------------------------------------------------+
NewsScrollState g_news_tableScroll; // Scroll state for the event table
Here, we declare the "NewsScrollState" structure to hold every piece of state the scrollbar needs in one place. The scroll offset, total content height, and viewport height together describe what portion of the content is currently visible. We define the four track fields to capture the rectangle the thumb lives in, set during render, and reused for hit-testing. The drag fields record the mouse position and scroll offset at the moment a thumb drag begins, and the three hover flags distinguish between hovering the track area, hovering the thumb specifically, and a generic hover state used for color selection. To zero every field so no garbage memory carries into the first render, we call the "News_ScrollInit" function once at startup.
Next, we handle bounds with three helpers. We use the "News_ScrollMax" function to return the maximum legal scroll offset, which is simply the amount of content that does not fit in the viewport. When content is shorter than the viewport, it returns zero, so the scroll position cannot drift below the top. Following that, we call the "News_ScrollClamp" function to enforce both bounds on the current scroll position, snapping back to zero on underflow and to the maximum on overflow. Lastly, we use the "News_ScrollVisible" function to return true only when content exceeds the viewport, which the render layer reads to decide whether to draw a scrollbar at all.
To compute thumb geometry on demand, we define the "News_ScrollThumbRect" function. We size the thumb height proportional to the viewport-to-content ratio, so when the viewport shows half the content, the thumb occupies half the track. A minimum thumb height of 20 pixels prevents it from shrinking to an uninteractable sliver when the content list grows long. We compute the vertical position from the ratio of the current scroll offset to the maximum scroll offset, scaled across the available track space. Alongside it, we use the "News_ScrollHitThumb" function to test whether a given mouse position falls on the thumb itself, applying a 2-pixel horizontal slack on each side to make the thumb easier to grab without expanding its visual footprint.
Three helpers manage the drag lifecycle: begin, update, and end. We call the "News_ScrollBeginDrag" function on mouse down to capture the cursor Y and the current scroll offset. We use the "News_ScrollUpdateDrag" function on subsequent mouse moves to convert the pixel delta in track space into a new scroll offset in content space, then clamp it. On release, we call the "News_ScrollEndDrag" function to clear the drag flag. Separately, we handle mouse wheel input with the "News_ScrollByWheel" function, where a positive delta scrolls up, and a negative delta scrolls down, with the step parameter controlling how many pixels each wheel notch advances.
Finally, we paint the thumb onto the supplied canvas using the "News_ScrollDraw" function. We exit immediately when the scrollbar is not needed, then compute the thumb rectangle and pick a color based on whether the thumb is currently being dragged, hovered, or idle. We fill the thumb as a fully-rounded rectangle with a radius equal to half the track width, giving it a pill shape regardless of its height. At the bottom of the snippet, we declare the global "g_news_tableScroll" instance as the single scroll state used by the events table — every other module reads from and writes to this one variable. The next thing we will do is compute the column widths dynamically, erasing the static computation in the previous part since we now incorporate dashboard resizing.
Computing Column Widths That Scale With the Dashboard
Because the dashboard is now resizable, the table columns can no longer use hardcoded widths. We compute fresh widths on every render, scaling each column proportionally and shrinking the Event column when space runs short.
//+------------------------------------------------------------------+
//| Compute current column widths from runtime dashboard width       |
//+------------------------------------------------------------------+
void News_ComputeColumnWidths()
  {
//--- Compute proportional scale factor relative to default width
   const double scale = (double)g_news_dashW / (double)NEWS_DASHBOARD_W_DEFAULT;
//--- Scale each reference column width and enforce 20px floor
   for(int i = 0; i < NEWS_COL_COUNT; i++)
     {
      int w = (int)MathRound(NEWS_COL_W_REF[i] * scale);
      if(w < 20) w = 20;
      g_news_colW[i] = w;
     }
//--- Compute layout geometry to determine scrollbar reservation
   const int sidePad     = 10;
   const int xStart      = 6;
   const int totalRows   = ArraySize(g_news_rowPlan);
   const int rowsTop     = NEWS_HEADER_H + 36 + 32 + 32 + 6 + 28;
   const int footerTop   = g_news_dashH - 26 - 8;
   const int viewportH   = footerTop - rowsTop;
   const int contentH    = totalRows * 26;
   const bool scrollNeeded  = (contentH > viewportH);
   const int scrollReserve  = scrollNeeded ? 12 : 0;
   const int availW         = g_news_dashW - 2 * sidePad - xStart - scrollReserve;
//--- Sum all scaled column widths
   int sumW = 0;
   for(int i = 0; i < NEWS_COL_COUNT; i++) sumW += g_news_colW[i];
//--- Shrink the Event column (index 4) if total exceeds available width
   if(sumW > availW)
     {
      const int over = sumW - availW;
      int eventW = g_news_colW[4] - over;
      if(eventW < 80) eventW = 80;
      g_news_colW[4] = eventW;
     }
  }
We define the "News_ComputeColumnWidths" function to recompute every column width based on the current dashboard size. We start by deriving a scale factor as the ratio of the current width to the default width, so a dashboard stretched to twice its default size produces a scale of 2.0, and a dashboard at default size produces 1.0.
Next, we loop through all nine reference widths and multiply each by the scale factor, using the MathRound function to convert the result back to an integer. We enforce a 20-pixel floor on each column so no column collapses to an unreadable sliver when the dashboard is at minimum size.
We then compute the available horizontal space for the table. We sum the side padding, the small left offset for the row content, and a 12-pixel reservation for the scrollbar when content overflows the viewport. The viewport height comes from subtracting the footer band from the row's top position, and the content height is the row plan size multiplied by the row height. If the content exceeds the viewport, the scrollbar is needed, and we reserve space for it.
Finally, we sum all scaled column widths and compare against the available space. When the total exceeds what fits, we shrink the Event column at index 4 by the overflow amount, keeping a minimum width of 80 pixels so event names remain readable. The Event column absorbs the shrinkage because it carries the longest text, and the rest of the columns hold short fixed-format values that should not compress. Next, we extend the calendar values display with unit-aware formatting.
Formatting Calendar Values With Unit-Aware Display
In the previous part, values were rendered with a plain call to the DoubleToString function, which produced raw numbers stripped of any context. A non-farm payrolls figure of 250000 jobs looked identical to an interest rate of 250000 — the unit, the multiplier scale, and the meaningful decimal precision were all lost. We replace that with a formatter that reads the calendar metadata and produces output like "$2.5K", "3.2%", or "250 jobs".
//+------------------------------------------------------------------+
//| Format calendar value with unit, multiplier, and digits metadata |
//+------------------------------------------------------------------+
string News_FormatValue(bool hasValue, double v, int unit, int multiplier, int digits)
  {
//--- Return dash when value is not published
   if(!hasValue) return "-";
//--- Determine multiplier suffix
   string suffix = "";
   if(multiplier == CALENDAR_MULTIPLIER_THOUSANDS) suffix = "K";
   else if(multiplier == CALENDAR_MULTIPLIER_MILLIONS)  suffix = "M";
   else if(multiplier == CALENDAR_MULTIPLIER_BILLIONS)  suffix = "B";
   else if(multiplier == CALENDAR_MULTIPLIER_TRILLIONS) suffix = "T";
//--- Clamp decimal places to valid range
   int d = digits;
   if(d < 0) d = 0;
   if(d > 6) d = 6;
   string num = DoubleToString(v, d);
//--- Apply currency prefix for USD unit
   if(unit == CALENDAR_UNIT_USD) return "$" + num + suffix;
//--- Apply percent suffix for percent unit
   if(unit == CALENDAR_UNIT_PERCENT) return num + "%" + suffix;
//--- Map remaining units to their textual suffix
   string post = "";
   if(unit == CALENDAR_UNIT_HOUR)       post = " h";
   else if(unit == CALENDAR_UNIT_JOB)       post = " jobs";
   else if(unit == CALENDAR_UNIT_RIG)       post = " rigs";
   else if(unit == CALENDAR_UNIT_PEOPLE)    post = " ppl";
   else if(unit == CALENDAR_UNIT_MORTGAGE)  post = " mtg";
   else if(unit == CALENDAR_UNIT_VOTE)      post = " votes";
   else if(unit == CALENDAR_UNIT_BARREL)    post = " bbl";
   else if(unit == CALENDAR_UNIT_CUBICFEET) post = " cf";
   else if(unit == CALENDAR_UNIT_POSITION)  post = " pos";
   else if(unit == CALENDAR_UNIT_BUILDING)  post = " bldg";
   else if(unit == CALENDAR_UNIT_CURRENCY)  post = "";
//--- Return number with suffix and unit postfix
   return num + suffix + post;
  }
We define the "News_FormatValue" function to take five inputs: a flag for whether the value is published, the raw double, and the three metadata fields from the calendar event. If the value is not published, we return a dash. This allows an unfilled actual or forecast cell to show up in the table as a dash, rather than displaying a misleading zero.
Following that, we determine the multiplier suffix. The MetaTrader 5 calendar reports values in their natural scale alongside a multiplier enum that tells us whether to display the raw number or append "K", "M", "B", or "T" for thousands, millions, billions, or trillions. We map each multiplier enum to its corresponding suffix character, leaving the suffix empty when no multiplier applies.
Next, we clamp the decimal precision between zero and six places before formatting the number with the "DoubleToString" function. This protects against malformed metadata that might request negative or absurdly large digit counts.
With the base number formatted, we apply unit-specific prefixes and suffixes. For USD-denominated values like central bank balance sheets, we prepend a dollar sign and return immediately. For percentages like interest rates or unemployment, we append the percent sign before the multiplier suffix. For all remaining units — hours, jobs, rigs, people, mortgages, votes, barrels, cubic feet, positions, and buildings — we map each to a short textual suffix appended after the multiplier. The currency unit gets no postfix because the multiplier suffix carries enough scale information on its own.
Finally, we return the assembled string composed of the number, the multiplier suffix, and the unit postfix. This matches the MT5 Calendar format and produces similar output. This gives us the following outcome.

We can see that the new version is unit-aware and displays accurate values, improving clarity. To format the remaining time column, we used the following logic.
Formatting Time Remaining Until Each Event
The new Remain column needs a string that reads naturally regardless of how far away the event is. We also need a quick check to flag events that are about to fire so the render layer can paint them in a warning color.
//+------------------------------------------------------------------+
//| Format time-remaining string for an event row                    |
//+------------------------------------------------------------------+
string News_FormatRemain(datetime evTime, datetime now)
  {
//--- Compute signed difference in seconds
   const long diffSec = (long)evTime - (long)now;
//--- Show static label for past events
   if(diffSec < -60) return "Released";
//--- Show "now" within 60 seconds of release
   const long absSec = (diffSec < 0) ? -diffSec : diffSec;
   if(absSec <= 60) return "now";
//--- Decompose absolute seconds into days, hours, minutes, seconds
   const long mins  = absSec / 60;
   const long hours = mins / 60;
   const long days  = hours / 24;
   string body;
   if(days > 0)
     {
      const long remH = hours - days * 24;
      body = IntegerToString(days) + "d " + IntegerToString(remH) + "h";
     }
   else if(hours > 0)
     {
      const long remM = mins - hours * 60;
      body = IntegerToString(hours) + "h " + IntegerToString(remM) + "m";
     }
   else if(mins > 0)
     {
      const long remS = absSec - mins * 60;
      body = IntegerToString(mins) + "m " + IntegerToString(remS) + "s";
     }
   else
     {
      body = IntegerToString(absSec) + "s";
     }
//--- Prefix with "in " for future events
   return "in " + body;
  }

//+------------------------------------------------------------------+
//| Test if event is upcoming and within 30 minutes                  |
//+------------------------------------------------------------------+
bool News_RemainIsImminent(datetime evTime, datetime now)
  {
//--- Return true only when event is in the future and within 30 min
   const long diffSec = (long)evTime - (long)now;
   return (diffSec > 0 && diffSec <= 30 * 60);
  }
We define the "News_FormatRemain" function to convert the gap between an event time and the current time into a short display string. The first thing we do is compute the signed difference in seconds — positive for future events, negative for past ones. Events more than 60 seconds in the past show "Released", so historical rows stay quiet and do not clutter the table with seconds-since-release counters.
Following that, we take the absolute value of the difference and treat anything within a 60-second window as "now". This handles the live-fire moment where the event time and the current time are effectively equal, including events that have just been released and are still within their first minute. You can define your own window for this.
For all other cases, we decompose the seconds into days, hours, minutes, and remainder seconds. The display logic picks the two most significant units: days and hours when the event is more than a day away, hours and minutes when it is within a day, minutes and seconds when it is within an hour, and just seconds when it is closer than a minute. Using the IntegerToString function to assemble each part, we build a compact body string like "2d 5h" or "14m 22s".
Finally, we prefix the body with "in " so the cell reads as a natural English phrase like "in 14m 22s".
Below that, the "News_RemainIsImminent" function performs a single check used by the render layer for color decisions. It returns true only when the event is in the future and within 30 minutes — a window we treat as urgent enough to highlight the Remain cell in red rather than the regular accent color. Again, you can define your own warning window. This is just an arbitrary window we thought was standard. See an example below.

With that done, we will now move on to channeling the logic, rendering, and interaction modules.
Logic, Rendering, and Interaction Modules
Loading Events From the Live Calendar API
The previous part loaded each event with just the raw doubles for actual, forecast, and previous values. We extend the loader here to also capture the metadata we need for unit-aware formatting, revised-value tracking, and trade deduplication.
//+------------------------------------------------------------------+
//|                                                   News Logic.mqh |
//|                           Copyright 2026, Allan Munene Mutiiria. |
//|                                   https://t.me/Forex_Algo_Trader |
//+------------------------------------------------------------------+
#property copyright "Copyright 2026, Allan Munene Mutiiria."
#property link      "https://t.me/Forex_Algo_Trader"

//--- Include guard
#ifndef NEWS_LOGIC_MQH
#define NEWS_LOGIC_MQH

//--- Include MQL5 trading library
#include <Trade/Trade.mqh>
//--- Include core data definitions and state
#include "News Core.mqh"

//+------------------------------------------------------------------+
//| Forward Extern Declarations                                      |
//+------------------------------------------------------------------+
#ifndef NEWS_COMPILED_FROM_MAIN
extern ENUM_TIMEFRAMES start_time;         // Past time window for live mode
extern ENUM_TIMEFRAMES end_time;           // Future time window for live mode
extern ENUM_TIMEFRAMES range_time;         // Time filter range from now
extern bool            updateServerTime;   // Update server clock on header
extern bool            debugLogging;       // Print debug info to journal
extern datetime        StartDate;          // Tester window start date
extern datetime        EndDate;            // Tester window end date
extern double          tradeLotSize;       // Trade lot size
extern int             tradeOffsetHours;   // Trade offset hours
extern int             tradeOffsetMinutes; // Trade offset minutes
extern int             tradeOffsetSeconds; // Trade offset seconds
#endif

//+------------------------------------------------------------------+
//| Trade mode enumeration                                           |
//+------------------------------------------------------------------+
//--- Declared here for standalone compile; skipped when compiled from main
#ifndef NEWS_COMPILED_FROM_MAIN
enum ENewsTradeMode
  {
   NEWS_TRADE_BEFORE,  // Trade before news event
   NEWS_TRADE_AFTER,   // Trade after news event
   NEWS_NO_TRADE,      // Do not trade on news
   NEWS_PAUSE_TRADING  // Pause trading around news
  };
extern ENewsTradeMode tradeMode; // Active trade mode input
#endif

//+------------------------------------------------------------------+
//| Trade Helper and Resource Declarations                           |
//+------------------------------------------------------------------+
CTrade g_news_trade; // Trade execution helper instance

//--- Embedded CSV resource handle declared by main .mq5
#ifndef NEWS_COMPILED_FROM_MAIN
extern string EconomicCalendarData; // Embedded CSV resource string
#endif

//+------------------------------------------------------------------+
//| Load events from MetaTrader live calendar API                    |
//+------------------------------------------------------------------+
int News_LoadEventsFromLive(datetime startDt, datetime endDt)
  {
//--- Reset event array before loading
   ArrayResize(g_news_allEvents, 0);
//--- Query all calendar values in the requested time window
   MqlCalendarValue values[];
   const int total = CalendarValueHistory(values, startDt, endDt, NULL, NULL);
   if(total <= 0) return 0;
//--- Process each returned calendar value
   int eventIndex = 0;
   for(int i = 0; i < total; i++)
     {
      //--- Fetch the associated event and country metadata
      MqlCalendarEvent ev;
      if(!CalendarEventById(values[i].event_id, ev)) continue;
      MqlCalendarCountry ctry;
      CalendarCountryById(ev.country_id, ctry);
      MqlCalendarValue val;
      CalendarValueById(values[i].id, val);
      //--- Populate event record with time and identity fields
      ArrayResize(g_news_allEvents, eventIndex + 1);
      g_news_allEvents[eventIndex].eventDate  = TimeToString(values[i].time, TIME_DATE);
      g_news_allEvents[eventIndex].eventTime  = TimeToString(values[i].time, TIME_MINUTES);
      g_news_allEvents[eventIndex].currency   = ctry.currency;
      g_news_allEvents[eventIndex].event      = ev.name;
      g_news_allEvents[eventIndex].importance = News_GetImpactLabel(ev.importance);
      //--- Store has-value flags alongside doubles to distinguish missing from 0.0
      g_news_allEvents[eventIndex].hasActual   = val.HasActualValue();
      g_news_allEvents[eventIndex].hasForecast = val.HasForecastValue();
      g_news_allEvents[eventIndex].hasPrevious = val.HasPreviousValue();
      g_news_allEvents[eventIndex].hasRevised  = val.HasRevisedValue();
      //--- Store raw double values guarded by their has-value flags
      g_news_allEvents[eventIndex].actual          = val.HasActualValue()   ? val.GetActualValue()   : 0.0;
      g_news_allEvents[eventIndex].forecast        = val.HasForecastValue() ? val.GetForecastValue() : 0.0;
      g_news_allEvents[eventIndex].previous        = val.HasPreviousValue() ? val.GetPreviousValue() : 0.0;
      g_news_allEvents[eventIndex].revisedPrevious = val.HasRevisedValue()  ? val.GetRevisedValue()  : 0.0;
      //--- Store formatting metadata for unit-aware value display
      g_news_allEvents[eventIndex].unit          = (int)ev.unit;
      g_news_allEvents[eventIndex].multiplier    = (int)ev.multiplier;
      g_news_allEvents[eventIndex].digits        = (int)ev.digits;
      g_news_allEvents[eventIndex].eventDateTime = values[i].time;
      g_news_allEvents[eventIndex].eventId       = (long)values[i].event_id;
      eventIndex++;
     }
   return eventIndex;
  }
First, we define the "News_LoadEventsFromLive" function to pull events from the MetaTrader 5 calendar within a given date window. We start by resetting the global event array so a refresh does not append duplicates onto stale data. Following that, we query all calendar values in the window using the CalendarValueHistory function, passing in the array to fill, the start and end timestamps, and NULL for the country and currency filters since we apply our own filtering later. When the query returns zero or fewer entries, we exit early.
Next, we walk through every returned value. For each one, we fetch its parent event metadata with the CalendarEventById function, look up the country information with the CalendarCountryById function, and pull the value record itself with the CalendarValueById function. The event metadata gives us the name, unit, multiplier, and digits; the country gives us the currency code, and the value record gives us the actual, forecast, previous, and revised numbers.
With all three pieces in hand, we grow the array and populate the record. The date and time strings come from the TimeToString function applied with date and minutes formatting to the same timestamp. The currency, event name, and importance label fill the identity fields. We use the "News_GetImpactLabel" function to convert the importance enum into the display string used by our filter system.
Following the identity fields, we capture the four has-value flags using the "HasActualValue", "HasForecastValue", "HasPreviousValue", and "HasRevisedValue" methods on the value record. This is the key fix from the previous part — without these flags, a published value of 0.0 was indistinguishable from a missing value, so the dashboard could not tell whether to show a number or a dash. With the flags stored, we then read the actual doubles using the "GetActualValue", "GetForecastValue", "GetPreviousValue", and "GetRevisedValue" methods, guarded by the corresponding has-value flag, so missing values default to 0.0 without polluting the display.
Finally, we copy the formatting metadata for unit-aware display, store the event timestamp, and record the event ID. The ID is what powers stable trade deduplication across reloads — the previous part used array indices for this, which broke whenever the array was rebuilt, but the calendar event ID stays the same across every refresh. We increment the index and continue, returning the total count of events loaded once the loop completes. Next, we build the row plan with day separators, including the day label formatting with day-of-week, month name, and event count. This was inspired by how MQL5 categorizes its events, so we figured it would be better to visualize the events in that structured manner, and better yet, collapse what is not needed.
Building the Row Plan With Collapsible Day Groups
The events table in the previous part rendered events as a flat list with no grouping. We change that here by inserting day separator rows between event groups, with each separator carrying a date label and a click target for collapsing all events under it. A trader scanning a week of news can hide entire days of low-interest events while keeping the days they care about expanded.
//+------------------------------------------------------------------+
//| Test whether a date string is in the collapsed day set           |
//+------------------------------------------------------------------+
bool News_IsDayCollapsed(string date)
  {
//--- Linear scan of collapsed days array
   const int n = ArraySize(g_news_collapsedDays);
   for(int i = 0; i < n; i++)
      if(g_news_collapsedDays[i] == date) return true;
   return false;
  }

//+------------------------------------------------------------------+
//| Toggle collapsed state for a date string                         |
//+------------------------------------------------------------------+
bool News_ToggleDayCollapsed(string date)
  {
   const int n = ArraySize(g_news_collapsedDays);
//--- Remove date from set if already present
   for(int i = 0; i < n; i++)
     {
      if(g_news_collapsedDays[i] == date)
        {
         for(int j = i; j < n - 1; j++)
            g_news_collapsedDays[j] = g_news_collapsedDays[j + 1];
         ArrayResize(g_news_collapsedDays, n - 1);
         return false;
        }
     }
//--- Append date to set if not present
   ArrayResize(g_news_collapsedDays, n + 1);
   g_news_collapsedDays[n] = date;
   return true;
  }

//+------------------------------------------------------------------+
//| Build row plan with day separators from displayable events       |
//+------------------------------------------------------------------+
void News_BuildRowPlan()
  {
//--- Reset row plan array
   ArrayResize(g_news_rowPlan, 0);
   const int n = ArraySize(g_news_displayableEvents);
   int    planIdx  = 0;
   string lastDate = "";
//--- Walk all displayable events and emit day headers and event rows
   for(int i = 0; i < n; i++)
     {
      const string evDate = g_news_displayableEvents[i].eventDate;
      //--- Emit a day separator row when the date changes
      if(evDate != lastDate)
        {
         //--- Count events belonging to this date for the header label
         int dayCount = 0;
         for(int k = i; k < n; k++)
           {
            if(g_news_displayableEvents[k].eventDate != evDate) break;
            dayCount++;
           }
         //--- Build friendly day label: "Monday, August 12, 2025  -  N events"
         const datetime evDt = g_news_displayableEvents[i].eventDateTime;
         MqlDateTime mdt;
         TimeToStruct(evDt, mdt);
         const string daysOfWeek[] = {"Sunday","Monday","Tuesday","Wednesday","Thursday","Friday","Saturday"};
         const string monthNames[] = {"January","February","March","April","May","June",
                                       "July","August","September","October","November","December"};
         const int    dow         = mdt.day_of_week;
         const int    mo          = mdt.mon - 1;
         const string countSuffix = "  -  " + IntegerToString(dayCount) + (dayCount == 1 ? " event" : " events");
         const string label       = daysOfWeek[dow] + ", " + monthNames[mo] + " "
                                    + IntegerToString(mdt.day) + ", " + IntegerToString(mdt.year) + countSuffix;
         //--- Append day separator row to plan
         ArrayResize(g_news_rowPlan, planIdx + 1);
         g_news_rowPlan[planIdx].kind     = NEWS_ROW_KIND_DAY;
         g_news_rowPlan[planIdx].eventIdx = -1;
         g_news_rowPlan[planIdx].label    = label;
         g_news_rowPlan[planIdx].dateKey  = evDate;
         planIdx++;
         lastDate = evDate;
        }
      //--- Skip event rows for collapsed day groups (header row still appears)
      if(News_IsDayCollapsed(evDate)) continue;
      //--- Append event row to plan
      ArrayResize(g_news_rowPlan, planIdx + 1);
      g_news_rowPlan[planIdx].kind     = NEWS_ROW_KIND_EVENT;
      g_news_rowPlan[planIdx].eventIdx = i;
      g_news_rowPlan[planIdx].label    = "";
      g_news_rowPlan[planIdx].dateKey  = evDate;
      planIdx++;
     }
  }
We define the "News_IsDayCollapsed" function to test whether a given date string belongs to the set of currently collapsed days. The collapsed set is a flat array of date strings, and we do a linear scan against it. The array stays small in practice — typically two or three entries representing the days the user has hidden — so a linear scan is more than fast enough and avoids the overhead of a hash table or sorted lookup.
Next, we define the "News_ToggleDayCollapsed" function to flip the collapsed state for a date. We first scan the array looking for an existing entry. If we find one, we shift all subsequent entries down one slot to overwrite it, then shrink the array with the "ArrayResize" function. This is a standard "remove from array" pattern that preserves order without leaving gaps. When the entry is not present, we grow the array by one slot and append the date. The function returns true when the date becomes collapsed and false when it becomes expanded, so the interact layer can adjust its visuals if needed.
Following the collapse helpers, we define the "News_BuildRowPlan" function to construct the rendering plan. This is where the flat event list becomes a structured row sequence that the render layer walks linearly. We reset the row plan array and initialize a running plan index along with a last-seen date tracker that starts empty, so the first event always triggers a day header.
We walk through every event in the displayable array. When the event's date differs from the last seen date, we emit a day separator row before continuing. To build the header label, we first count how many events belong to this date by scanning ahead until the date changes again — this count is what produces the "N events" suffix on the day label. We then decompose the event's timestamp into a date structure using the TimeToStruct function so we can read the day-of-week index, month index, day, and year individually.
With the date components in hand, we assemble the label using lookup arrays for day names and month names, producing strings like "Monday, August 12, 2025 - 4 events". The conditional at the end picks "event" or "events" based on the count, so the grammar reads naturally for both single-event days and multi-event days. We grow the row plan array, set the entry kind to the day separator constant, store the label and date key, and increment the plan index. The event index field is set to -1 because day rows do not correspond to any specific event — the date key is what matters here.
Following the day separator, we check whether the current date is in the collapsed set. When it is, we use the continue statement to skip emitting the event row, so only the header for that day appears in the plan. The events themselves are excluded entirely from rendering and hit-testing until the user expands the day again. When the date is not collapsed, we grow the row plan array, set the kind to the event row constant, store the index into the displayable events array, and move on. Here is an illustration of how this appears when rendered.

We can see that the event rows are now grouped by date and can be collapsed to reveal only those that matter to the user. With that implemented, the date column loses value and becomes ambiguous. We left the column in, but you can remove it to match what the MQL5 calendar does, since the date is now shown in the row plan separator — your choice. What we do next is refactor the dashboard so that everything fits dynamically. Specifically, we move the news renderer from the top of the header to the footer, so everything is organized. We handle the entire logic as a rendering module in a separate file, just in case we need expansion in the future.
Rendering the Dashboard Header
The header strip carries the dashboard title, the live server time, the event counts, the theme toggle, and the close button. We anchor the buttons to the right edge and let the title sit on the left, with a centered status band filling whatever space remains between them.
//+------------------------------------------------------------------+
//|                                                  News Render.mqh |
//|                           Copyright 2026, Allan Munene Mutiiria. |
//|                                   https://t.me/Forex_Algo_Trader |
//+------------------------------------------------------------------+
#property copyright "Copyright 2026, Allan Munene Mutiiria."
#property link      "https://t.me/Forex_Algo_Trader"

//--- Include guard
#ifndef NEWS_RENDER_MQH
#define NEWS_RENDER_MQH

//--- Include core data definitions and state
#include "News Core.mqh"
//--- Include event loading and filter logic
#include "News Logic.mqh"

//+------------------------------------------------------------------+
//| Global Canvas Instances                                          |
//+------------------------------------------------------------------+
CCanvas g_news_canv;    // Main dashboard canvas
CCanvas g_news_canvSep; // Separator lines overlay canvas (separate chart object)
bool    g_news_canvSepExists = false; // Separator canvas created flag
#define NEWS_CANVAS_NAME_SEP "NewsCanvasSeparators" // Separator canvas object name

//+------------------------------------------------------------------+
//| Header Button Rectangle Caches                                   |
//+------------------------------------------------------------------+
int g_news_closeL = 0, g_news_closeT = 0, g_news_closeR = 0, g_news_closeB = 0; // Close button bounds
int g_news_themeL = 0, g_news_themeT = 0, g_news_themeR = 0, g_news_themeB = 0; // Theme button bounds

//+------------------------------------------------------------------+
//| Filter Toggle Rectangle Caches                                   |
//+------------------------------------------------------------------+
int g_news_currTglL = 0, g_news_currTglT = 0, g_news_currTglR = 0, g_news_currTglB = 0; // Currency toggle bounds
int g_news_impTglL  = 0, g_news_impTglT  = 0, g_news_impTglR  = 0, g_news_impTglB  = 0; // Impact toggle bounds
int g_news_timeTglL = 0, g_news_timeTglT = 0, g_news_timeTglR = 0, g_news_timeTglB = 0; // Time toggle bounds

//+------------------------------------------------------------------+
//| Currency Chip Rectangle Caches                                   |
//+------------------------------------------------------------------+
int g_news_currL[NEWS_CURR_COUNT]; // Currency chip left bounds
int g_news_currT[NEWS_CURR_COUNT]; // Currency chip top bounds
int g_news_currR[NEWS_CURR_COUNT]; // Currency chip right bounds
int g_news_currB[NEWS_CURR_COUNT]; // Currency chip bottom bounds

//+------------------------------------------------------------------+
//| Impact Chip Rectangle Caches                                     |
//+------------------------------------------------------------------+
int g_news_impL[NEWS_IMPACT_COUNT]; // Impact chip left bounds
int g_news_impT[NEWS_IMPACT_COUNT]; // Impact chip top bounds
int g_news_impR[NEWS_IMPACT_COUNT]; // Impact chip right bounds
int g_news_impB[NEWS_IMPACT_COUNT]; // Impact chip bottom bounds

//+------------------------------------------------------------------+
//| Event Row Rectangle Caches                                       |
//+------------------------------------------------------------------+
//--- Sized for max dashboard height (~900px yields about 25 rows); keep headroom
#define NEWS_MAX_VISIBLE_ROWS 32
int g_news_rowL[NEWS_MAX_VISIBLE_ROWS];        // Row left bounds
int g_news_rowT[NEWS_MAX_VISIBLE_ROWS];        // Row top bounds
int g_news_rowR[NEWS_MAX_VISIBLE_ROWS];        // Row right bounds
int g_news_rowB[NEWS_MAX_VISIBLE_ROWS];        // Row bottom bounds
int g_news_rowEventIdx[NEWS_MAX_VISIBLE_ROWS]; // Row index into displayableEvents
int g_news_visibleRowCount = 0;                // Count of currently visible rows

//+------------------------------------------------------------------+
//| Revised Triangle Hot Zone Caches                                 |
//+------------------------------------------------------------------+
//--- cx == -1 means the row has no revised marker; interact layer sets the MT5 tooltip
int g_news_revTriCx[NEWS_MAX_VISIBLE_ROWS]; // Triangle center X per row (-1 if none)
int g_news_revTriCy[NEWS_MAX_VISIBLE_ROWS]; // Triangle center Y per row
int g_news_revisedHoverRow = -1;            // Visible row index currently hovered (-1 if none)

//+------------------------------------------------------------------+
//| Cursor Position State                                            |
//+------------------------------------------------------------------+
//--- Updated by interact layer on every mouse move; used to float resize handles
int g_news_cursorX = -1; // Last cursor X in dashboard-local coordinates
int g_news_cursorY = -1; // Last cursor Y in dashboard-local coordinates

//+------------------------------------------------------------------+
//| Remain Cell Fast-Path Cache                                      |
//+------------------------------------------------------------------+
//--- Lets the timer repaint only cells whose displayed string changed
int      g_news_remainCellL[NEWS_MAX_VISIBLE_ROWS];   // Remain cell left edge
int      g_news_remainCellT[NEWS_MAX_VISIBLE_ROWS];   // Remain cell top edge
int      g_news_remainCellW[NEWS_MAX_VISIBLE_ROWS];   // Remain cell width
int      g_news_remainCellH[NEWS_MAX_VISIBLE_ROWS];   // Remain cell height
color    g_news_remainCellBg[NEWS_MAX_VISIBLE_ROWS];  // Remain cell row background for repaint
string   g_news_remainLastStr[NEWS_MAX_VISIBLE_ROWS]; // Last displayed remain string
datetime g_news_remainEvTime[NEWS_MAX_VISIBLE_ROWS];  // Event datetime driving recompute

//+------------------------------------------------------------------+
//| Render dashboard header with title, server time, buttons         |
//+------------------------------------------------------------------+
void News_RenderHeader()
  {
//--- Fill header strip with flat background rectangle
   g_news_canv.FillRectangle(0, 0, NEWS_DASHBOARD_W - 1, NEWS_HEADER_H - 1,
                              ColorToARGB(g_news_headerBg, 255));
//--- Compute button dimensions anchored to the right edge
   const int btnH   = NEWS_HEADER_H - 7;
   const int themeW = btnH;
   const int closeW = (int)(btnH * 1.5);
//--- Set close button rect (rightmost, flush to dashboard right edge)
   g_news_closeR = NEWS_DASHBOARD_W;
   g_news_closeL = g_news_closeR - closeW;
   g_news_closeT = 0;
   g_news_closeB = g_news_closeT + btnH;
//--- Set theme toggle rect (immediately left of close button)
   g_news_themeR = g_news_closeL;
   g_news_themeL = g_news_themeR - themeW;
   g_news_themeT = 0;
   g_news_themeB = btnH;
//--- Compute title bounds and available width for truncation
   const string titleFull  = "MQL5 Economic Calendar";
   const int    titleStartX = NEWS_SIDE_PAD;
   const int    midGap      = 12;
   const int    rightAreaL  = g_news_themeL - 4;
   const int    titleMaxW   = (rightAreaL - titleStartX) / 2 - midGap;
   const int    titleH      = News_TextHeight("Arial Bold", NEWS_FONT_TITLE);
   const int    titleY      = (NEWS_HEADER_H - titleH) / 2;
//--- Stamp title with ellipsis fallback if space is tight
   const string titleFit = News_FitTextToWidth(titleFull, "Arial Bold", NEWS_FONT_TITLE, MathMax(0, titleMaxW));
   News_StampTextAA_Wrapper(titleFit, titleStartX, titleY, "Arial Bold", NEWS_FONT_TITLE, g_news_titleText);
   const int titleEndX = titleStartX + News_TextWidth(titleFit, "Arial Bold", NEWS_FONT_TITLE);
//--- Render middle status text (server time + event counts) when there is room
   const int midAvailL = titleEndX + midGap;
   const int midAvailR = rightAreaL - 4;
   const int midAvailW = midAvailR - midAvailL;
   if(midAvailW > 40)
     {
      //--- Build status string and center it in the available band
      string countsStr = "Total: " + IntegerToString(g_news_totalFiltered) + "/" + IntegerToString(g_news_totalConsidered);
      string serverStr = "Server: " + TimeToString(TimeCurrent(), TIME_DATE | TIME_SECONDS);
      string mid       = serverStr + "    |    " + countsStr;
      string midFit    = News_FitTextToWidth(mid, "Arial", NEWS_FONT_HEADING, midAvailW);
      const int midW   = News_TextWidth(midFit, "Arial", NEWS_FONT_HEADING);
      const int midX   = midAvailL + (midAvailW - midW) / 2;
      const int midY   = (NEWS_HEADER_H - News_TextHeight("Arial", NEWS_FONT_HEADING)) / 2;
      News_StampTextAA_Wrapper(midFit, midX, midY, "Arial", NEWS_FONT_HEADING, g_news_subText);
     }
//--- Draw theme button hover fill
   if(g_news_hover == NEWS_HOV_THEME)
     {
      const color hovBg = News_HoverForBg(g_news_headerBg);
      g_news_canv.FillRectangle(g_news_themeL, g_news_themeT, g_news_themeR - 1, g_news_themeB - 1,
                                 ColorToARGB(hovBg, 255));
     }
//--- Stamp theme toggle glyph centered in its button area
   const string themeGlyph = "\x5B";
   const int    thW         = News_TextWidth(themeGlyph, "Wingdings", 14);
   const int    thH         = News_TextHeight("Wingdings", 14);
   News_StampTextAA_Wrapper(themeGlyph, g_news_themeL + (themeW - thW) / 2,
                          g_news_themeT + (btnH - thH) / 2, "Wingdings", 14, g_news_titleText);
//--- Draw close button hover fill and set foreground color
   color cFg = (g_news_hover == NEWS_HOV_CLOSE) ? g_news_closeColorHover : g_news_closeColor;
   if(g_news_hover == NEWS_HOV_CLOSE)
      g_news_canv.FillRectangle(g_news_closeL, g_news_closeT, g_news_closeR - 1, g_news_closeB - 1,
                                 ColorToARGB(g_news_closeBgHover, 255));
//--- Stamp close glyph centered in its button area
   const int xW = News_TextWidth(NEWS_GLYPH_CLOSE, "Webdings", 14);
   const int xH = News_TextHeight("Webdings", 14);
   News_StampTextAA_Wrapper(NEWS_GLYPH_CLOSE, g_news_closeL + (closeW - xW) / 2,
                          g_news_closeT + (btnH - xH) / 2, "Webdings", 14, cFg);
//--- Draw header bottom border line
   g_news_canv.LineHorizontal(0, NEWS_DASHBOARD_W - 1, NEWS_HEADER_H - 1,
                               ColorToARGB(g_news_border, 255));
  }
We define the "News_RenderHeader" function to paint the entire header strip. We start by filling the strip background with a flat rectangle using the FillRectangle method on the canvas, passing in the bounds and the header background color converted to ARGB via the ColorToARGB function. The conversion adds the alpha channel needed for the canvas pixel format.
Next, we compute button dimensions anchored to the right edge. We make the theme button square at button height, and we give the close button 1.5 times the button width so the close glyph has room to breathe. We then set the close button rectangle flush to the dashboard's right edge and place the theme toggle rectangle immediately to its left. These rectangles are cached in module-level variables so the hit-tester in the interact layer can use them later without recomputing.
We then compute the title bounds. The full title is the program name as a string, and we measure its height with the "News_TextHeight" function so we can vertically center it. The title is allowed at most half of the space between its starting position and the button cluster on the right, minus the gap that separates it from the centered status text. When even that space is tight, we use the "News_FitTextToWidth" function to truncate the title with an ellipsis so it fits cleanly. We stamp the resulting string with the "News_StampTextAA_Wrapper" helper, which is the bold anti-aliased text routine we use throughout the dashboard.
Following the title, we render the centered status band when there is enough room for it. We build two strings — one with the event counts in "filtered/considered" format, and one with the live server time from the "TimeToString" function applied with date and seconds formatting — then join them with a vertical bar separator. We fit the combined string to the available middle band, measure the resulting width, and stamp it centered horizontally and vertically.
The theme toggle comes next. When the hover state code matches the theme button slot, we paint a hover-tinted background underneath using the "News_HoverForBg" function to derive a slightly lighter or darker fill. We then stamp a Wingdings glyph centered in the button area as the theme indicator icon.
The close button mirrors that pattern. We pick the close glyph foreground color based on hover state — the bright hover color when the cursor is over it, the muted idle color otherwise — and we paint a red hover background only when active. The close glyph is a Webdings character defined as a constant, stamped centered in the button area in the chosen foreground color.
Finally, we draw a one-pixel horizontal line across the bottom of the header using the LineHorizontal method on the canvas. This separator gives the header strip a clean visual boundary against the filter row below it. To render the filter toggles, we use the following approach.
Rendering the Filter Master Toggles
The filter row sits directly below the header and carries the three master switches — Currency, Impact, and Time. Each toggle flips its filter group on or off, and the buttons adapt their labels based on the available width so they stay readable at any dashboard size.
//+------------------------------------------------------------------+
//| Render three filter master toggle buttons                        |
//+------------------------------------------------------------------+
void News_RenderFilterToggles()
  {
   const int rowY    = NEWS_HEADER_H + 4;
   const int btnH    = NEWS_FILTER_H - 8;
   const int gap     = 6;
   const int btnMaxW = 110;
   const int btnMinW = 50;
//--- Stamp "Filters:" label on the left
   const int lblW = News_TextWidth("Filters:", "Arial Bold", NEWS_FONT_HEADING);
   News_StampTextAA_Wrapper("Filters:", NEWS_SIDE_PAD,
                          rowY + (btnH - News_TextHeight("Arial Bold", NEWS_FONT_HEADING)) / 2,
                          "Arial Bold", NEWS_FONT_HEADING, g_news_subText);
//--- Compute per-button width within available area, clamped to min/max
   const int areaL = NEWS_SIDE_PAD + lblW + 8;
   const int areaR = NEWS_DASHBOARD_W - NEWS_SIDE_PAD;
   const int areaW = areaR - areaL;
   int btnW = (areaW - 2 * gap) / 3;
   if(btnW > btnMaxW) btnW = btnMaxW;
   if(btnW < btnMinW) btnW = btnMinW;
//--- Right-align the three-button cluster within the available area
   const int totalW = btnW * 3 + gap * 2;
   int startX = areaR - totalW;
//--- Define per-button label sets and state flags
   const string nounsOn[]  = {"ON Currency", "ON Impact", "ON Time"};
   const string nounsOff[] = {"OFF Currency", "OFF Impact", "OFF Time"};
   const string shortOn[]  = {"Currency", "Impact", "Time"};
   const string shortOff[] = {"Currency", "Impact", "Time"};
   const bool   onFlags[]  = {g_news_filterCurrencyOn, g_news_filterImpactOn, g_news_filterTimeOn};
   const int    hovCodes[] = {NEWS_HOV_FILTER_CURR, NEWS_HOV_FILTER_IMP, NEWS_HOV_FILTER_TIME};
//--- Render each of the three toggle buttons
   for(int i = 0; i < 3; i++)
     {
      const int bL = startX;
      const int bT = rowY;
      const int bR = startX + btnW;
      const int bB = rowY + btnH;
      //--- Cache button rect for hit-tester
      if(i == 0) { g_news_currTglL = bL; g_news_currTglT = bT; g_news_currTglR = bR; g_news_currTglB = bB; }
      if(i == 1) { g_news_impTglL  = bL; g_news_impTglT  = bT; g_news_impTglR  = bR; g_news_impTglB  = bB; }
      if(i == 2) { g_news_timeTglL = bL; g_news_timeTglT = bT; g_news_timeTglR = bR; g_news_timeTglB = bB; }
      //--- Compute background and foreground colors based on on/hover state
      color bg = onFlags[i] ? g_news_chipOnBg : g_news_chipOffBg;
      color fg = onFlags[i] ? g_news_chipOnText : g_news_chipOffText;
      if(g_news_hover == hovCodes[i]) bg = News_HoverForBg(bg);
      //--- Draw button background and border
      News_FillRoundRect(g_news_canv, bL, bT, btnW, btnH, 6, ColorToARGB(bg, 255));
      News_DrawRoundRectBorder(g_news_canv, bL, bT, btnW, btnH, 6, 1,
                               ColorToARGB(News_BorderForBg(bg), 255));
      //--- Select the best label that fits: full, short, then ellipsized
      const string lblFull  = onFlags[i] ? nounsOn[i]  : nounsOff[i];
      const string lblShort = onFlags[i] ? shortOn[i]  : shortOff[i];
      const int    innerPad = 8;
      const int    avail    = btnW - 2 * innerPad;
      string lbl;
      if(News_TextWidth(lblFull, "Arial Bold", NEWS_FONT_BUTTON) <= avail)
         lbl = lblFull;
      else if(News_TextWidth(lblShort, "Arial Bold", NEWS_FONT_BUTTON) <= avail)
         lbl = lblShort;
      else
         lbl = News_FitTextToWidth(lblShort, "Arial Bold", NEWS_FONT_BUTTON, avail);
      //--- Center label inside button
      const int lW = News_TextWidth(lbl, "Arial Bold", NEWS_FONT_BUTTON);
      const int lH = News_TextHeight("Arial Bold", NEWS_FONT_BUTTON);
      News_StampTextAA_Wrapper(lbl, bL + (btnW - lW) / 2, bT + (btnH - lH) / 2,
                             "Arial Bold", NEWS_FONT_BUTTON, fg);
      startX += btnW + gap;
     }
  }
We define the "News_RenderFilterToggles" function to draw the three master filter buttons. We start by computing the row's vertical placement just below the header, the button height that leaves vertical padding on both sides, the horizontal gap between buttons, and the minimum and maximum widths each button can take. The min and max bounds protect the buttons from collapsing to unreadable widths on a narrow dashboard or stretching to comically wide pills on a wide one.
Next, we stamp the "Filters:" label on the left edge of the row. We measure its width with the "News_TextWidth" function so we can plan the rest of the row's geometry around it, then use the "News_StampTextAA_Wrapper" helper to draw it vertically centered against the secondary text color.
Following the label, we compute the available area for the three buttons. The left edge sits past the label with a small breathing gap, and the right edge stops at the side padding. We divide the remaining width by three, accounting for the two gaps between buttons, and clamp the result to the min/max bounds. We then right-align the three-button cluster by computing its total width and pushing the start position toward the right edge.
We define the labels each button can show. Each toggle carries a long form like "ON Currency" or "OFF Time" with the state indicator built in, and a short form like just "Currency" for when space is tight. The on-state flags array holds pointers to the three master filter switches, and the hover codes array holds the hit-test constants the interact layer assigns to each button.
The render loop walks all three buttons. For each one, we compute its rectangle, cache that rectangle into the appropriate slot for hit-testing, and pick its background and foreground colors based on whether the toggle is on or off. When the cursor is hovering this specific button, we shift the background through the "News_HoverForBg" function to derive a slightly tinted hover variant. We then paint the button as a rounded rectangle using the "News_FillRoundRect" helper, followed by a thin border drawn with the "News_DrawRoundRectBorder" helper. The border color comes from the "News_BorderForBg" function, which produces a complementary outline that reads cleanly against the fill.
Finally, we pick the best label that fits. We first try the long form with the state prefix, fall back to the short form when the long one overflows, and only resort to ellipsis truncation when even the short form does not fit. We center the chosen label horizontally and vertically inside the button, then advance the start position by one button width plus one gap to set up the next iteration. We use the same logic to render all the other buttons and event rows. Here is the final outcome.

With that done, we need to handle the dashboard interactions such as clicks, resizing, and dragging, and that is easy since we just need to rewire the existing logic. We defined the logic as a separate interaction module for future expansion.
Coordinate Conversion and Pixel-Level Hit-Testing
In the previous part, every clickable element was a chart object with its own click event. Here, every interactive region lives inside a single canvas, so we need a way to translate raw chart mouse coordinates into canvas-local coordinates and then identify which element sits under the cursor.
//+------------------------------------------------------------------+
//|                                                 News Interact.mqh |
//|                           Copyright 2026, Allan Munene Mutiiria. |
//|                                   https://t.me/Forex_Algo_Trader |
//+------------------------------------------------------------------+
#property copyright "Copyright 2026, Allan Munene Mutiiria."
#property link      "https://t.me/Forex_Algo_Trader"

//--- Include guard
#ifndef NEWS_INTERACT_MQH
#define NEWS_INTERACT_MQH

//--- Include core data definitions
#include "News Core.mqh"
//--- Include trade logic handlers
#include "News Logic.mqh"
//--- Include canvas rendering routines
#include "News Render.mqh"

//+------------------------------------------------------------------+
//| Interaction State                                                |
//+------------------------------------------------------------------+
bool g_news_scrollDragging = false; // Scrollbar thumb drag in progress flag

//+------------------------------------------------------------------+
//| Convert chart coordinates to canvas-local coordinates            |
//+------------------------------------------------------------------+
void News_ChartToCanvas(int chartX, int chartY, int &localX, int &localY)
  {
//--- Subtract dashboard origin to get canvas-local coordinates
   localX = chartX - g_news_dashboardX;
   localY = chartY - g_news_dashboardY;
  }

//+------------------------------------------------------------------+
//| Hit-test canvas-local coordinates and return hover code          |
//+------------------------------------------------------------------+
int News_HitTest(int lx, int ly)
  {
//--- Test right-edge resize hot zone along the full edge minus corner radii
   {
      const int cornerR    = 8;
      const int edgeMargin = 4;
      const int hotTop     = cornerR + edgeMargin;
      const int hotBot     = NEWS_DASHBOARD_H - cornerR - edgeMargin;
      if(lx >= g_news_dashW - NEWS_RESIZE_HOT_W && lx <= g_news_dashW
         && ly >= hotTop && ly <= hotBot)
         return NEWS_HOV_RESIZE_R;
   }
//--- Test bottom-edge resize hot zone along the full edge minus corner radii
   {
      const int cornerR    = 8;
      const int edgeMargin = 4;
      const int hotLeft    = cornerR + edgeMargin;
      const int hotRight   = NEWS_DASHBOARD_W - cornerR - edgeMargin;
      if(ly >= g_news_dashH - NEWS_RESIZE_HOT_H && ly <= g_news_dashH
         && lx >= hotLeft && lx <= hotRight)
         return NEWS_HOV_RESIZE_B;
   }
//--- Test theme toggle button
   if(News_PointInRect(lx, ly, g_news_themeL, g_news_themeT,
                       g_news_themeR - g_news_themeL, g_news_themeB - g_news_themeT))
      return NEWS_HOV_THEME;
//--- Test close button
   if(News_PointInRect(lx, ly, g_news_closeL, g_news_closeT,
                       g_news_closeR - g_news_closeL, g_news_closeB - g_news_closeT))
      return NEWS_HOV_CLOSE;
//--- Test currency filter master toggle
   if(News_PointInRect(lx, ly, g_news_currTglL, g_news_currTglT,
                       g_news_currTglR - g_news_currTglL, g_news_currTglB - g_news_currTglT))
      return NEWS_HOV_FILTER_CURR;
//--- Test impact filter master toggle
   if(News_PointInRect(lx, ly, g_news_impTglL, g_news_impTglT,
                       g_news_impTglR - g_news_impTglL, g_news_impTglB - g_news_impTglT))
      return NEWS_HOV_FILTER_IMP;
//--- Test time filter master toggle
   if(News_PointInRect(lx, ly, g_news_timeTglL, g_news_timeTglT,
                       g_news_timeTglR - g_news_timeTglL, g_news_timeTglB - g_news_timeTglT))
      return NEWS_HOV_FILTER_TIME;
//--- Test each currency chip
   for(int i = 0; i < NEWS_CURR_COUNT; i++)
     {
      if(News_PointInRect(lx, ly, g_news_currL[i], g_news_currT[i],
                          g_news_currR[i] - g_news_currL[i], g_news_currB[i] - g_news_currT[i]))
         return NEWS_HOV_CURR_BASE + i;
     }
//--- Test each impact pill
   for(int i = 0; i < NEWS_IMPACT_COUNT; i++)
     {
      if(News_PointInRect(lx, ly, g_news_impL[i], g_news_impT[i],
                          g_news_impR[i] - g_news_impL[i], g_news_impB[i] - g_news_impT[i]))
         return NEWS_HOV_IMP_BASE + i;
     }
//--- Test each visible event row
   for(int r = 0; r < g_news_visibleRowCount; r++)
     {
      if(News_PointInRect(lx, ly, g_news_rowL[r], g_news_rowT[r],
                          g_news_rowR[r] - g_news_rowL[r], g_news_rowB[r] - g_news_rowT[r]))
         return NEWS_HOV_ROW_BASE + r;
     }
//--- Treat the header strip as the drag region when no button matched
   if(ly >= 0 && ly < NEWS_HEADER_H) return NEWS_HOV_DRAG;
   return NEWS_HOV_NONE;
  }
We define the "News_ChartToCanvas" function to convert chart-space mouse coordinates into canvas-local coordinates by subtracting the dashboard's top-left origin. The result is a coordinate pair where (0, 0) sits at the dashboard's upper-left corner, regardless of where the dashboard has been dragged on the chart, which is the coordinate system every cached rectangle in the render layer uses.
Following the coordinate helper, we define the "News_HitTest" function to identify which interactive element the cursor is currently over. The function walks every known interactive region in priority order and returns a hover code constant the first time a match is found. Priority matters here because some regions overlap — for example, the resize hot zones sit at the very edges of the dashboard, partially overlapping the header drag region, so we test them first to make sure edge resizing takes precedence over panel dragging when the cursor is right on the corner.
We start with the right-edge resize hot zone. We define a narrow vertical strip along the right edge of the dashboard, but we inset the strip top and bottom by the corner radius plus a small margin. This inset is important — without it, the user trying to drag the dashboard by its rounded top-right or bottom-right corner would accidentally trigger a resize. By carving out the corners from the resize zone, we keep dragging-by-corner natural while still giving the resize edge a long, easy-to-hit target along its straight middle section.
Next, we test the bottom-edge resize hot zone with the same corner-carving logic applied horizontally. The bottom strip runs along the dashboard's bottom edge, inset on both sides by the corner radius and a small margin, so the bottom-left and bottom-right rounded corners belong to the panel rather than the resize handle.
Following the resize zones, we test the header buttons. We use the "News_PointInRect" helper to check whether the cursor falls inside each cached rectangle, passing in the local coordinates and the rectangle's left, top, width, and height. The theme toggle and close button are checked in turn, each returning its dedicated hover code constant when matched.
We then test the three master filter toggles one by one, returning the appropriate hover code for the currency, impact, or time filter when matched. After the toggles, we loop through all eight currency chips, returning a base hover code plus the chip's array index so the action dispatcher in the click handler knows exactly which currency was hit. The same pattern applies to the four impact pills.
Following the chips, we walk every currently visible event row and test each against the cursor position. The "g_news_visibleRowCount" variable carries how many rows the render pass actually drew on the last frame, and each row's bounds are cached in the row rectangle arrays. When a match is found, we return a row-based hover code plus the visible row index so the action handler can look up which event or day separator the user clicked on.
Finally, when no specific element matched, we check whether the cursor falls inside the header strip. If so, we return the drag hover code, treating the entire header as a draggable handle. Otherwise, we return the none code to indicate the cursor is over an inert region of the dashboard. Next, we will work on the click action dispatcher logic.
Dispatching Click Actions From Hover Codes
Once the hit-test resolves a hover code, this dispatcher translates it into the actual state change and a redraw.
//+------------------------------------------------------------------+
//| Handle action triggered by hover code                            |
//+------------------------------------------------------------------+
void News_HandleAction(int hov, bool doubleClick = false)
  {
//--- Close dashboard on close button click
   if(hov == NEWS_HOV_CLOSE)
     {
      g_news_dashboardVisible = false;
      News_DestroyCanvas();
      return;
     }
//--- Toggle dark/light theme on theme button click
   if(hov == NEWS_HOV_THEME)
     {
      News_ApplyTheme(!g_news_darkTheme);
      News_RenderAll();
      ChartRedraw();
      return;
     }
//--- Toggle currency filter master switch
   if(hov == NEWS_HOV_FILTER_CURR)
     {
      g_news_filterCurrencyOn = !g_news_filterCurrencyOn;
      g_news_filtersChanged   = true;
      News_RefreshEvents();
      News_RenderAll();
      ChartRedraw();
      return;
     }
//--- Toggle impact filter master switch
   if(hov == NEWS_HOV_FILTER_IMP)
     {
      g_news_filterImpactOn = !g_news_filterImpactOn;
      g_news_filtersChanged = true;
      News_RefreshEvents();
      News_RenderAll();
      ChartRedraw();
      return;
     }
//--- Toggle time range filter master switch
   if(hov == NEWS_HOV_FILTER_TIME)
     {
      g_news_filterTimeOn   = !g_news_filterTimeOn;
      g_news_filtersChanged = true;
      News_RefreshEvents();
      News_RenderAll();
      ChartRedraw();
      return;
     }
//--- Toggle individual currency chip selection
   if(hov >= NEWS_HOV_CURR_BASE && hov < NEWS_HOV_CURR_BASE + NEWS_CURR_COUNT)
     {
      const int idx = hov - NEWS_HOV_CURR_BASE;
      g_news_currSelected[idx] = !g_news_currSelected[idx];
      g_news_filtersChanged    = true;
      News_RefreshEvents();
      News_RenderAll();
      ChartRedraw();
      return;
     }
//--- Toggle individual impact pill selection
   if(hov >= NEWS_HOV_IMP_BASE && hov < NEWS_HOV_IMP_BASE + NEWS_IMPACT_COUNT)
     {
      const int idx = hov - NEWS_HOV_IMP_BASE;
      g_news_impactSelected[idx] = !g_news_impactSelected[idx];
      g_news_filtersChanged      = true;
      News_RefreshEvents();
      News_RenderAll();
      ChartRedraw();
      return;
     }
//--- Dispatch row click by row kind
   if(hov >= NEWS_HOV_ROW_BASE && hov < NEWS_HOV_ROW_BASE + NEWS_MAX_VISIBLE_ROWS)
     {
      const int rIdx = hov - NEWS_HOV_ROW_BASE;
      if(rIdx < g_news_visibleRowCount)
        {
         const int planIdx = g_news_rowEventIdx[rIdx];
         if(planIdx >= 0 && planIdx < ArraySize(g_news_rowPlan))
           {
            const int kind = g_news_rowPlan[planIdx].kind;
            //--- Toggle day collapse on double-click of a day separator row
            if(kind == NEWS_ROW_KIND_DAY)
              {
               if(doubleClick)
                 {
                  const string dateKey = g_news_rowPlan[planIdx].dateKey;
                  News_ToggleDayCollapsed(dateKey);
                  News_BuildRowPlan();
                  News_ScrollClamp(g_news_tableScroll);
                 }
              }
            //--- Show event details in toast on single event row click
            else if(kind == NEWS_ROW_KIND_EVENT)
              {
               const int evIdx = g_news_rowPlan[planIdx].eventIdx;
               if(evIdx >= 0 && evIdx < ArraySize(g_news_displayableEvents))
                 {
                  const NewsEvent ev  = g_news_displayableEvents[evIdx];
                  string msg          = ev.eventDate + " " + ev.eventTime + "  "
                                        + ev.currency + "  " + ev.event;
                  News_ShowToast(msg, false);
                 }
              }
           }
        }
      News_RenderAll();
      ChartRedraw();
      return;
     }
  }
We define the "News_HandleAction" function as a single dispatcher for every clickable element. The close branch hides the dashboard and tears down the canvas through "News_DestroyCanvas". The theme branch flips the theme flag, reapplies the palette via "News_ApplyTheme", and triggers a redraw. The three master filter branches each flip their boolean, mark filters as dirty, and rebuild the displayable set through "News_RefreshEvents" before redrawing.
The individual currency chip and impact pill branches use the hover code's offset from the base constant to compute the array index, then toggle that slot's selection flag and refresh the same way.
The row branch is where double-click matters. We translate the hover code to a visible row index, look up its plan entry, and read its kind. On a day separator with a double-click, we call "News_ToggleDayCollapsed" with the date key, rebuild the row plan, and clamp the scroll position. On an event row, we pull the event record and pass a summary string into "News_ShowToast" so the user gets an on-screen confirmation of the click. To handle canvas creation and resizing, we use the following approach.
Canvas Lifecycle With Crop-Based Resizing
The two-canvas system needs creation, destruction, and a resize helper. The key trick is allocating both canvases at maximum size once and changing only the visible crop on resize, so we never reallocate bitmaps during a drag.
//+------------------------------------------------------------------+
//| Create main and separator canvas bitmap labels                   |
//+------------------------------------------------------------------+
bool News_CreateCanvas()
  {
//--- Return early if canvas already exists
   if(g_news_canvasExists) return true;
//--- Create main canvas at maximum dimensions for crop-based resizing
   if(!g_news_canv.CreateBitmapLabel(NEWS_CANVAS_NAME,
                                      g_news_dashboardX, g_news_dashboardY,
                                      NEWS_DASHBOARD_W_MAX, NEWS_DASHBOARD_H_MAX,
                                      COLOR_FORMAT_ARGB_NORMALIZE))
     {
      Print("News_CreateCanvas: failed - ", GetLastError());
      return false;
     }
//--- Configure main canvas object properties
   ObjectSetInteger(0, NEWS_CANVAS_NAME, OBJPROP_BACK,      false);
   ObjectSetInteger(0, NEWS_CANVAS_NAME, OBJPROP_SELECTABLE, false);
   ObjectSetInteger(0, NEWS_CANVAS_NAME, OBJPROP_HIDDEN,     true);
   ObjectSetInteger(0, NEWS_CANVAS_NAME, OBJPROP_ZORDER,     1000);
//--- Suppress default tooltip; interact layer sets it dynamically for revised-value hover
   ObjectSetString(0,  NEWS_CANVAS_NAME, OBJPROP_TOOLTIP, "\n");
//--- Crop visible area to current dashboard size
   ObjectSetInteger(0, NEWS_CANVAS_NAME, OBJPROP_XSIZE, g_news_dashW);
   ObjectSetInteger(0, NEWS_CANVAS_NAME, OBJPROP_YSIZE, g_news_dashH);
   g_news_canvasExists = true;
//--- Create separators overlay canvas at same maximum dimensions
   if(g_news_canvSep.CreateBitmapLabel(NEWS_CANVAS_NAME_SEP,
                                        g_news_dashboardX, g_news_dashboardY,
                                        NEWS_DASHBOARD_W_MAX, NEWS_DASHBOARD_H_MAX,
                                        COLOR_FORMAT_ARGB_NORMALIZE))
     {
      //--- Configure separator canvas object properties
      ObjectSetInteger(0, NEWS_CANVAS_NAME_SEP, OBJPROP_BACK,       false);
      ObjectSetInteger(0, NEWS_CANVAS_NAME_SEP, OBJPROP_SELECTABLE, false);
      ObjectSetInteger(0, NEWS_CANVAS_NAME_SEP, OBJPROP_HIDDEN,     true);
      ObjectSetString(0,  NEWS_CANVAS_NAME_SEP, OBJPROP_TOOLTIP,    "\n");
      ObjectSetInteger(0, NEWS_CANVAS_NAME_SEP, OBJPROP_ZORDER,     500);
      //--- Crop separator canvas to current dashboard size
      ObjectSetInteger(0, NEWS_CANVAS_NAME_SEP, OBJPROP_XSIZE, g_news_dashW);
      ObjectSetInteger(0, NEWS_CANVAS_NAME_SEP, OBJPROP_YSIZE, g_news_dashH);
      g_news_canvSepExists = true;
     }
   return true;
  }

//+------------------------------------------------------------------+
//| Destroy main canvas and separators overlay                       |
//+------------------------------------------------------------------+
void News_DestroyCanvas()
  {
//--- Destroy separator canvas first if it exists
   if(g_news_canvSepExists)
     {
      g_news_canvSep.Destroy();
      ObjectDelete(0, NEWS_CANVAS_NAME_SEP);
      g_news_canvSepExists = false;
     }
//--- Abort if main canvas was never created
   if(!g_news_canvasExists) return;
//--- Destroy main canvas and remove chart object
   g_news_canv.Destroy();
   ObjectDelete(0, NEWS_CANVAS_NAME);
   g_news_canvasExists = false;
   ChartRedraw();
  }

//+------------------------------------------------------------------+
//| Apply visible crop to both canvases without reallocating bitmaps |
//+------------------------------------------------------------------+
void News_ResizeCanvases(int newW, int newH)
  {
//--- Update visible crop on main canvas
   if(g_news_canvasExists)
     {
      ObjectSetInteger(0, NEWS_CANVAS_NAME, OBJPROP_XSIZE, newW);
      ObjectSetInteger(0, NEWS_CANVAS_NAME, OBJPROP_YSIZE, newH);
     }
//--- Update visible crop on separator canvas
   if(g_news_canvSepExists)
     {
      ObjectSetInteger(0, NEWS_CANVAS_NAME_SEP, OBJPROP_XSIZE, newW);
      ObjectSetInteger(0, NEWS_CANVAS_NAME_SEP, OBJPROP_YSIZE, newH);
     }
  }
Here, we define the "News_CreateCanvas" function to allocate both canvas bitmap labels. After the early-out guard, we call the CreateBitmapLabel method on the main canvas with the maximum width and height — not the current dashboard size. Allocating at maximum means every later resize is a cheap visible-crop change instead of a destroy-and-recreate cycle. We then configure the chart object properties: not in the background, not selectable, hidden from the object list, and a high z-order so it sits above other chart objects. We also suppress the default tooltip with a newline string because the interact layer dynamically sets it for revised-value hover. The OBJPROP_XSIZE and "OBJPROP_YSIZE" properties set the initial visible crop to the current dashboard dimensions.
We then create the separator overlay canvas the same way, but with a lower z-order than the main canvas. The separator overlay sits on its own chart object so that column separator lines drawn on it stay above the table rows on the main canvas without being erased by row repaints.
The "News_DestroyCanvas" function tears both canvases down in reverse order — separator first, main second — through the Destroy method and the ObjectDelete function. We clear the existence flags and call ChartRedraw so the chart visibly drops the objects.
Finally, the "News_ResizeCanvases" function applies a new visible crop without touching the underlying bitmaps. We update "OBJPROP_XSIZE" and "OBJPROP_YSIZE" on both canvases. This is what makes the resize drag in the previous snippet's interact layer feel instant — no allocation, no copy, just a property change on the chart object. To wire these functions to the event handlers, we define the handlers here. Here is an example of the timer event handler since we had handled the others in the previous version.
//+------------------------------------------------------------------+
//| Expert timer function                                            |
//+------------------------------------------------------------------+
void News_OnTimer()
  {
//--- Skip processing when dashboard is hidden
   if(!g_news_dashboardVisible) return;
//--- Manage toast lifecycle; force render while toast is alive
   bool needFullRender = false;
   bool toastAlive     = false;
   if(StringLen(g_news_toastText) > 0)
     {
      //--- Clear expired toast and flag a final render
      if(GetTickCount64() > g_news_toastExpiryMs)
        {
         g_news_toastText     = "";
         g_news_toastExpiryMs = 0;
         needFullRender       = true;
        }
      else
        {
         //--- Toast is still live; animate progress bar this tick
         toastAlive = true;
        }
     }
//--- Determine if a full render is due this tick
   static ulong s_lastFullMs = 0;
   const ulong nowMs = GetTickCount64();
//--- Render when toast is alive, just expired, or 5-second interval elapsed
   if(toastAlive || needFullRender || (nowMs - s_lastFullMs) >= 5000)
     {
      News_RenderAll();
      ChartRedraw();
      s_lastFullMs = nowMs;
      return;
     }
//--- Fast path: update only changed Remain cells to reduce CPU cost
   if(News_TickRemainCells()) ChartRedraw();
  }
We add the timer logic inside the "OnTimer" event handler through this "News_OnTimer" module function. After the visibility guard, we manage the toast lifecycle. When a toast message is currently active, we compare the current tick count from the GetTickCount64 function against the expiry timestamp. An expired toast gets cleared and flagged for one final render, so it leaves the screen, while a live toast sets the alive flag because its progress bar needs to animate down this tick.
Next, we decide whether a full render is due. A static last-full-render timestamp tracks when the last full pass ran. We trigger "News_RenderAll" when the toast is alive, when it just expired, or when 5 seconds have passed since the last full render. The 5-second interval handles slow-changing surfaces like the server time in the header and the countdown banner footer.
When none of those conditions apply, we take the fast path and call the "News_TickRemainCells" function. It walks only the cached Remain cells, recomputes each one's string, and repaints just the cells whose text changed. When at least one cell is repainted, it returns true, and we trigger ChartRedraw to push the partial update. This keeps the Remain column updating every half-second without the cost of redrawing the entire dashboard each time. We use the same logic for the other module entry points. To connect all these modules, we define a base file.
The Main Entry Point
The main file is the thin shell that holds the inputs, includes the four modules, and routes every event handler to its module function. No business logic lives here.
//+------------------------------------------------------------------+
//|                                MQL5 News Calendar EA PART 11.mq5 |
//|                           Copyright 2026, Allan Munene Mutiiria. |
//|                                   https://t.me/Forex_Algo_Trader |
//+------------------------------------------------------------------+
#property copyright "Copyright 2026, Allan Munene Mutiiria."
#property link      "https://t.me/Forex_Algo_Trader"
#property version   "1.00"
#property strict
#property description "MQL5 Economic News Calendar - Canvas-based Dashboard"

//+------------------------------------------------------------------+
//| Embedded Resources                                               |
//+------------------------------------------------------------------+
//--- Embed CSV resource for strategy tester mode
#resource "\\Files\\Database\\EconomicCalendar.csv" as string EconomicCalendarData

//+------------------------------------------------------------------+
//| Inputs - General Calendar Settings                               |
//+------------------------------------------------------------------+
input group "=== GENERAL CALENDAR SETTINGS ==="
input ENUM_TIMEFRAMES start_time       = PERIOD_H12; // Past time window for live mode
input ENUM_TIMEFRAMES end_time         = PERIOD_H12; // Future time window for live mode
input ENUM_TIMEFRAMES range_time       = PERIOD_H8;  // Time filter range from now
input bool            updateServerTime = true;       // Update server clock on header
input bool            debugLogging     = false;      // Print debug info to journal

//+------------------------------------------------------------------+
//| Inputs - Strategy Tester CSV Settings                            |
//+------------------------------------------------------------------+
input group "=== STRATEGY TESTER CSV SETTINGS ==="
input datetime StartDate = D'2026.01.01'; // Tester window start date
input datetime EndDate   = D'2026.05.12'; // Tester window end date

//+------------------------------------------------------------------+
//| Inputs - Auto-Trading Settings                                   |
//+------------------------------------------------------------------+
input group "=== AUTO-TRADING SETTINGS ==="

//+------------------------------------------------------------------+
//| Trade mode enumeration                                           |
//+------------------------------------------------------------------+
enum ENewsTradeMode
  {
   NEWS_TRADE_BEFORE,  // Trade before news event
   NEWS_TRADE_AFTER,   // Trade after news event
   NEWS_NO_TRADE,      // Do not trade on news
   NEWS_PAUSE_TRADING  // Pause trading around news
  };

input ENewsTradeMode tradeMode          = NEWS_TRADE_BEFORE; // Trade mode
input int            tradeOffsetHours   = 0;                 // Trade offset hours
input int            tradeOffsetMinutes = 5;                 // Trade offset minutes
input int            tradeOffsetSeconds = 0;                 // Trade offset seconds
input double         tradeLotSize       = 0.01;              // Trade lot size

//+------------------------------------------------------------------+
//| Module Includes                                                  |
//+------------------------------------------------------------------+
//--- Define sentinel to prevent modules from emitting their own externs
#define NEWS_COMPILED_FROM_MAIN
//--- Include core data and calendar loading logic
#include "News Core.mqh"
//--- Include trade signal and logic handlers
#include "News Logic.mqh"
//--- Include canvas rendering and dashboard drawing
#include "News Render.mqh"
//--- Include mouse, click, and chart interaction handlers
#include "News Interact.mqh"

//+------------------------------------------------------------------+
//| Expert initialization function                                   |
//+------------------------------------------------------------------+
int OnInit()
  {
//--- Initialize all news modules and abort if setup fails
   if(!News_Init()) return INIT_FAILED;
//--- Start half-second timer for countdown and toast refresh
   EventSetMillisecondTimer(500);
//---
   return INIT_SUCCEEDED;
  }

//+------------------------------------------------------------------+
//| Expert deinitialization function                                 |
//+------------------------------------------------------------------+
void OnDeinit(const int reason)
  {
//--- Kill the periodic timer
   EventKillTimer();
//--- Clean up all news module resources
   News_Deinit();
  }

//+------------------------------------------------------------------+
//| Expert tick function                                             |
//+------------------------------------------------------------------+
void OnTick()
  {
//--- Delegate tick handling to the news logic module
   News_OnTick();
  }

//+------------------------------------------------------------------+
//| Expert chart event function                                      |
//+------------------------------------------------------------------+
void OnChartEvent(const int id, const long &lparam, const double &dparam, const string &sparam)
  {
//--- Delegate mouse, wheel, click, and drag events to interact module
   News_OnChartEvent(id, lparam, dparam, sparam);
  }

//+------------------------------------------------------------------+
//| Expert timer function                                            |
//+------------------------------------------------------------------+
void OnTimer()
  {
//--- Trigger countdown updates and expire stale toast notifications
   News_OnTimer();
  }
//+------------------------------------------------------------------+
First, we embed the strategy tester CSV with the #resource directive, binding the file contents to a string symbol that the logic module reads when tester mode is active. The input groups then declare every user-tunable parameter — the time windows, the tester date bounds, the trade mode and offsets, and the lot size — with the "ENewsTradeMode" enum declared directly in the main file so it sits in the global scope all modules share.
Following the inputs, we define the "NEWS_COMPILED_FROM_MAIN" sentinel and include the four modules in dependency order: core, logic, render, and then interact. The sentinel signals to each module that the main file has already declared the inputs, so the modules skip their own extern declarations through their #ifndef guards.
The five event handlers are short pass-throughs. The OnInit event handler calls "News_Init", returns "INIT_FAILED" when setup fails, and starts the half-second timer through the EventSetMillisecondTimer function before returning INIT_SUCCEEDED. The "OnDeinit" event handler kills the timer with EventKillTimer and delegates cleanup to "News_Deinit". The "OnTick", "OnChartEvent", and OnTimer event handlers each forward their parameters to the matching module function. This structure keeps the entry file under a hundred lines and means future feature work touches only the module that owns the concern. What remains is testing the program, and that is handled in the next section.
Visualization
After attaching the program to a MetaTrader 5 chart, the dashboard appears at its default size. Columns scale with the panel, and the live feed populates the event table.
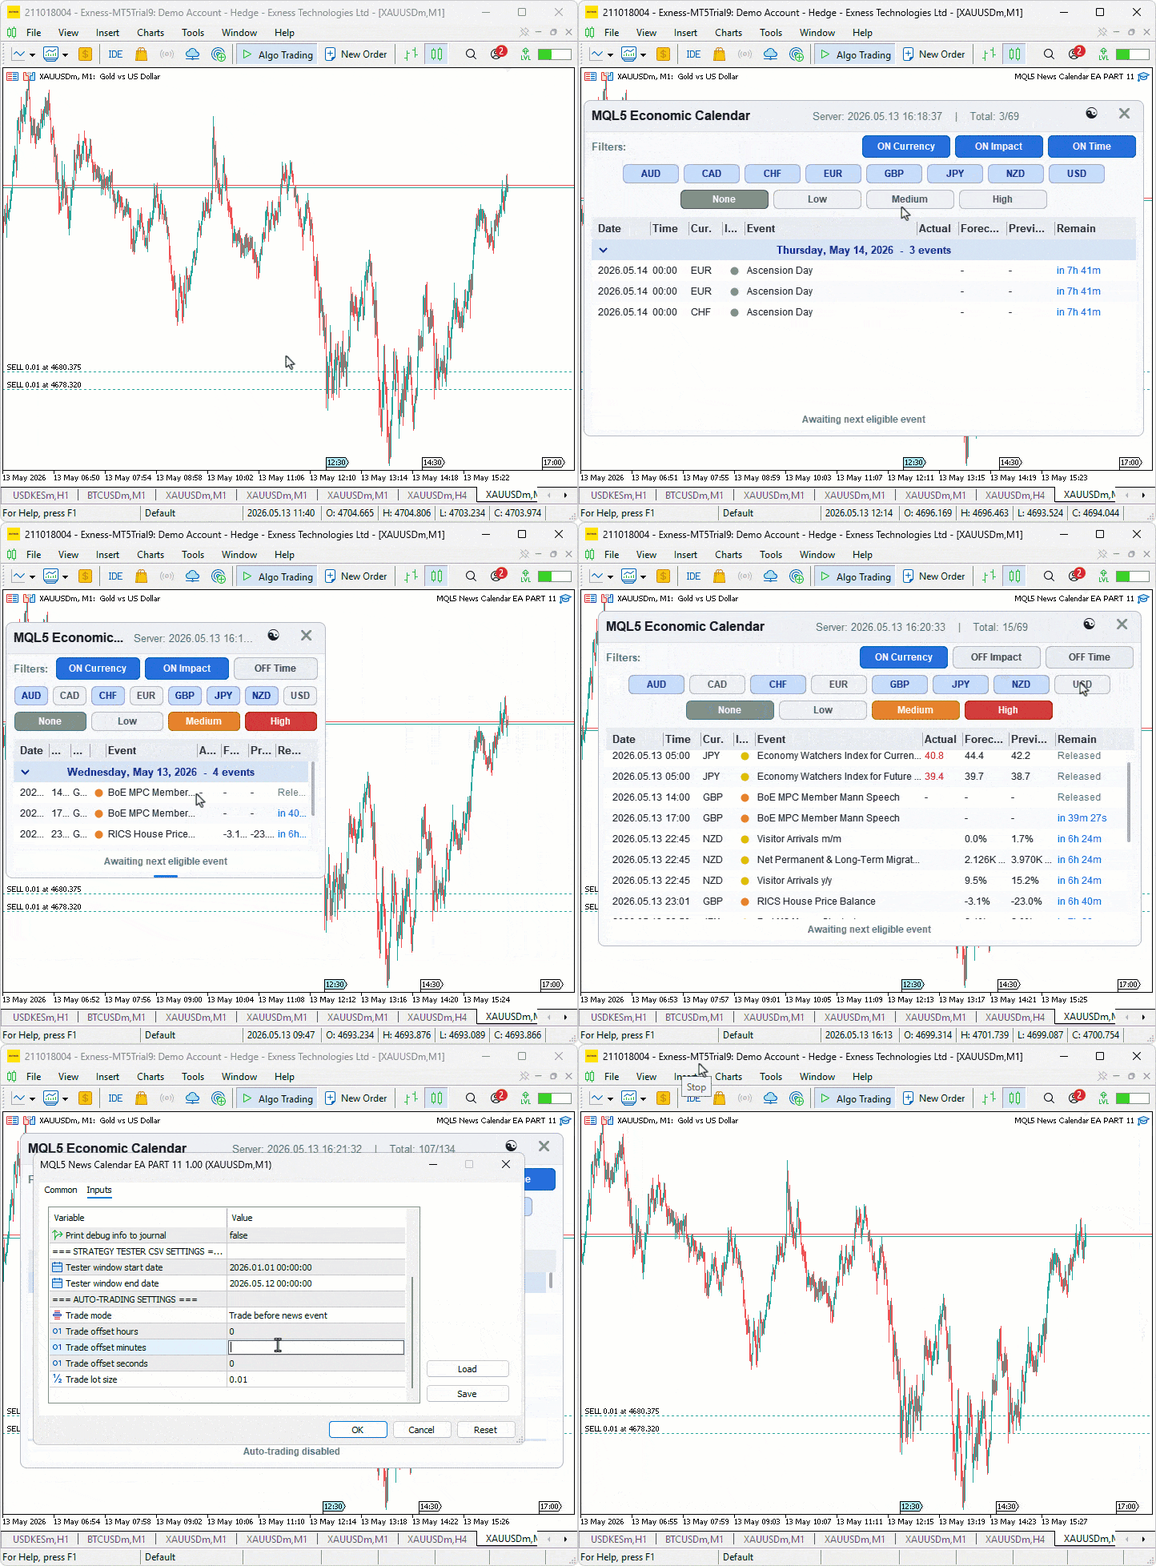
During testing, the theme toggle swapped the palette instantly with no flicker, and dragging the right and bottom edges resized the panel smoothly with the Event column absorbing overflow. Double-clicking a day separator collapsed that group, the Remain column updated every half-second through the fast-path timer, and the toast confirmed each pre-news trade with a shrinking progress bar.
Conclusion
In conclusion, we have rebuilt the MQL5 Economic Calendar dashboard from a monolithic object-based panel into a modular canvas-based system split across four dedicated files. The new program supports a dual-theme palette, drag-to-resize on both the right and bottom edges, collapsible day groups, revised previous value markers with hover tooltips, a live "Remain" countdown column, and toast notifications for trade confirmations. Trade deduplication now runs against stable calendar event IDs, the candidate event search is cached so it does not rescan on every tick, and the timer fast-path repaints only "Remain" cells whose displayed strings actually changed. After reading this article, you will be able to:
- Split a monolithic MQL5 program into core, logic, render, and interact modules using a sentinel define to coordinate input declarations across files.
- Build a canvas-based dashboard that resizes through visible-crop changes rather than bitmap reallocation, with column widths scaling proportionally to the runtime dashboard width.
- Implement collapsible day groups, a candidate event cache, and a half-second timer fast-path that repaints only the cells whose content actually changed.
In the next part, we will replace the embedded CSV resource with a SQLite database layer so calendar events persist across restarts and become available to the strategy tester for offline backtesting. Stay tuned.
Attachments
| S/N | Name | Type | Description |
|---|---|---|---|
| 1 | MQL5 News Calendar EA PART 11.mq5 | Expert Advisor | The main program entry point that embeds the CSV resource, declares the user inputs and trade mode enumeration, includes the four module headers, and forwards each event to the matching module function |
| 2 | News Core.mqh | Include file | Defines the layout constants, font sizes, glyph codes, the dual theme palette, the event and row plan structures, the scroll state structure, the primitives helper class, and the value and time formatting utilities |
| 3 | News Interact.mqh | Include file | Routes mouse, wheel, and chart events through coordinate conversion, pixel-level hit-testing, action dispatching, panel drag and edge-resize handling, and the canvas lifecycle helpers |
| 4 | News Logic.mqh | Include file | Loads events from the embedded CSV in tester mode or the live calendar API, applies the currency, impact, and time filters, builds the row plan with collapsible day groups, and runs the trade candidate search and order execution |
| 5 | News Render.mqh | Include file | Renders the entire dashboard — header, filter toggles, currency and impact chips, table header with separator overlay, event rows with revised markers and Remain cells, scrollbar, countdown banner, and toast notification |
| 6 | EconomicCalendar.csv | Resource file | Historical economic calendar events embedded into the compiled program at compile time via the "#resource" directive. Must be placed manually inside the "MQL5\Files\Database\" subfolder before compilation — create the Database subfolder if it does not exist. The file is required at compile time and the compilation will fail without it. Columns: Date, Time, Currency, Event Name, Importance, Actual, Forecast, Previous |
The project is supported in Algo Forge: https://forge.mql5.io/29210372/Article-22597-MQL5-Economic-Calendar-Modular-Canvas-Dashboard
Warning: All rights to these materials are reserved by MetaQuotes Ltd. Copying or reprinting of these materials in whole or in part is prohibited.
This article was written by a user of the site and reflects their personal views. MetaQuotes Ltd is not responsible for the accuracy of the information presented, nor for any consequences resulting from the use of the solutions, strategies or recommendations described.

 Overcoming Accessibility Problems in MQL5 Trading Tools (Part IV): Remote voice trading
 Feature Engineering for ML (Part 4): Implementing Time Features in MQL5
 MQL5 Wizard Techniques you should know (Part 91): Using Skip Lists and a Hopfield Network in a Custom Trailing Class
 3D Visualization Without External Libraries: How MetaTrader 5 Reveals Optimization Results via MQL5 + DX11

- Free trading apps
- Over 8,000 signals for copying
- Economic news for exploring financial markets
You agree to website policy and terms of use