

Building a Divergence System (Part II): Adaptive SuperTrend Custom Indicator
 2 837
2 837
 0
0

Table of Contents
- Introduction
- Introducing the Adaptive SuperTrend
- State Management and Solving Repainting
- Implementing the Visual Indicator in MQL5
- SuperTrend Indicator Calculation
- Tactical Application and Interpretation
- Parameter Tuning and Practical Considerations
- Conclusion
Introduction
In the previous article, we introduced MPO4, a pressure-based oscillator that measures the directional effort behind price movements by weighting candlestick bodies against recent volatility. Combined with a non-repainting pivot-detection engine, it enabled us to identify bullish and bearish divergences, revealing moments when underlying buying or selling pressure begins to weaken before a potential market reversal.
This presents a mechanical challenge for systematic traders: once a divergence warns us that a trend is dying, how should we mechanically adjust our trade management to capitalize on it?
Many traders rely on trend-following tools like the SuperTrend to manage their entries and trailing stops. The SuperTrend is undeniably effective at keeping traders in prolonged moves, but it suffers from being mathematically rigid. A standard SuperTrend multiplies the Average True Range (ATR) by a fixed constant (for example, 3.0) to trail the price. It does not care if momentum is accelerating effortlessly or if a reversal is imminent; it blindly maintains its fixed distance until the price violently snaps back and crosses it.
This rigidity leads to two frustrating scenarios for traders:
- Giveback profits: During a reversal, the price has to travel a massive distance to hit the fixed SuperTrend line, forcing the trader to surrender a large portion of their trailing profits before the trailing stop triggers.
- Late entries: When a new trend begins, the entry signal only triggers after the price has already crossed the distant SuperTrend line, causing the trader to miss the earliest phase of the new directional move.
Introducing the Adaptive SuperTrend
To solve this, we must bridge the gap between leading momentum and lagging trend-following. In this article, we will upgrade the standard SuperTrend into an Adaptive SuperTrend by integrating the divergence engine directly into its mathematical core.
The logic: when the market has a healthy trend, the SuperTrend maintains its standard, safe distance from price to avoid premature stop-outs or a signal change. When the engine detects a valid divergence, the indicator activates the "Shrinking Mechanism". It reduces the SuperTrend ATR multiplier by a sensitivity factor and pulls the line closer to price.
This single adaptation completely transforms how the indicator functions. By shrinking the band during a divergence, it automatically tightens the trailing stop to protect open profits just before a reversal hits. Simultaneously, because the line is now physically closer to the price action, the subsequent trend-change signal will fire significantly earlier, providing a highly responsive entry into the new trend.
In the following sections, we will break down the exact mathematics of this shrinking mechanism, address the memory-state challenges of coding it visually in MQL5 without repainting, and build the Adaptive SuperTrend indicator.
The Core Concept: Why Shrink the SuperTrend?
To understand why the Adaptive SuperTrend is necessary, we must first look at where the standard SuperTrend can be lacking mathematically. The traditional indicator calculates its bands by taking the median price and adding or subtracting the Average True Range (ATR) multiplied by a fixed constant.
Mathematically, the upper and lower bands are defined as:
UpperBand = Median + (Multiplier x ATR)
LowerBand = Median - (Multiplier x ATR)
If you set your multiplier to 3.0, the SuperTrend will maintain a distance of exactly three times the ATR from the median price. As long as the trend is strong, this wide buffer is an excellent feature, as it prevents premature stop-outs during normal market noise and minor pullbacks.
However, markets do not move in perpetual, clean lines. When a trend begins to exhaust itself, the price action often stalls, forming a rounded top or bottom while the momentum quietly bleeds out. This is precisely what the MPO4 divergence engine is built to detect. If the SuperTrend uses a fixed 3.0 multiplier, it ignores this internal weakening. It leaves your trailing stop floating far away, forcing you to wait for a massive, violent price reversal to finally cross the band and close the trade.
The Mathematics of the Shrinking Mechanism
The Adaptive SuperTrend uses a dynamic multiplier. Instead of treating the multiplier as a static number, it treats it as a dynamic variable that responds directly to momentum pressure.
When the market is healthy, the indicator uses your standard base multiplier. But the instant the MPO4 engine detects a valid divergence, it triggers the Shrinking Mechanism, applying a specific "Sensitivity Factor" to reduce the multiplier.
The adjusted calculation becomes:
DynamicMultiplier = BaseMultiplier x (1 - Sensitivity) For example, assume you are trading with a standard multiplier of 3.0, and you set your divergence sensitivity to 0.3 (a 30% reduction). As soon as a bullish or bearish divergence prints on the chart, the indicator recalculates:
DynamicMultiplier = 3.0 x (1 - 0.3) = 2.1
Instantly, the SuperTrend abandons its 3.0 distance and pulls into a tighter 2.1 distance.
The Double Utility of Adaptive SuperTrend
Defensive Exits and Aggressive Entries
This inward shift provides two tactical advantages for the trader:
- Protective Trailing (Defensive Exits): If you are riding a long position and a bearish divergence appears at the top of the trend, the SuperTrend line rises to meet the current price. Your trailing stop is automatically tightened. If the reversal happens as predicted, you are stopped out with a significantly larger portion of your open profits secured, rather than giving them back to the market while waiting for the standard 3.0 line to be hit.
- Early Trend Capture (Aggressive Entries): Because the SuperTrend line has been pulled closer to the current price action, it requires much less counter-directional movement to pierce the band. This means that when the new trend actually breaks out, the indicator will flip and generate its entry signal much earlier than a standard SuperTrend, allowing you to establish your position closer to the absolute pivot point.
By linking the ATR multiplier directly to momentum divergence, we transform a historically lagging indicator into an adaptive, forward-looking trade management system.
State Management and Solving Repainting
The previous article on MPO4 introduced the concept of state buffers and non-repainting design in the context of a momentum oscillator. We must revisit these principles because the Adaptive SuperTrend adds a new requirement. The indicator must store pivot values, track whether a divergence occurred, and count bars since the event.
This is no longer just about drawing arrows that stay fixed. The Shrinking Mechanism requires the SuperTrend line to remain compressed for a period after a divergence is detected and then return to normal when the conditions are fulfilled. If the indicator were to "forget" the divergence on the next tick, the line would snap back to its original width, creating visual chaos and destroying any practical use for trade management.
Standard Global Variable Failure
A common mistake to encounter in MQL5 coding is using simple global variables like "datetime LastDivTime" or "bool DivActive" to manage state. In a script or Expert Advisor, this will work because the program executes sequentially from start to finish. However, an indicator's OnCalculate() function is called repeatedly—on every tick and on every new bar—and it must produce correct values for every bar in the chart history simultaneously.
Consider this example: when a new tick arrives while the chart displays 500 bars. The indicator must recalculate the most recent bar, but it must also ensure that the values on bars 0 through 498 remain unchanged. If your code uses a single global variable (e.g., bool DivActive), then the moment a divergence appears on bar 499, that variable becomes true. But if the indicator now recalculates bar 498 (perhaps due to a chart refresh), it would incorrectly see "DivActive = true" and apply the Shrinking Mechanism to a bar where no divergence had yet occurred. This is repainting.
The solution, as we established in the MPO4 article, is to store state information in per-bar buffers that are propagated forward in time.
The State Buffers Needed
The Adaptive SuperTrend Indicator uses six state buffers, but four of them will be familiar from the previous article, while the remaining two are new to support the shrinking logic:
| Buffer Name | Purpose |
|---|---|
| LastPivLowPriceBuffer[] | Stores the most recent pivot low price |
| LastPivLowOscBuffer[] | Stores the most recent pivot low oscillator value |
| LastPivHighPriceBuffer[] | Stores the most recent pivot high price |
| LastPivHighOscBuffer[] | Stores the most recent pivot high oscillator value |
| LastTypeBuffer[] | Stores the type of the most recent divergence: 1 for bullish, -1 for bearish, 0 for none |
| BarsSinceBuffer[] | Counts the number of bars since the last divergence was detected |
The last two buffers are essential for the Shrinking Mechanism. When a divergence is detected, LastTypeBuffer[i] is set to 1 or -1, and BarsSinceBuffer[i] is set to 0. On each subsequent bar, BarsSinceBuffer[] increments.
The indicator then uses these values to decide whether to apply the shrink factor:
//--- Shrink Logic Application
int prevTrend = (int)st_trend_calc[i+1];
if(prevTrend == -1 && LastTypeBuffer[i] == 1 && BarsSinceBuffer[i] < 200)
   finalMultiplier = SuperTrendMultiplier * (1.0 - DivSensitivity);
else
   if(prevTrend == 1 && LastTypeBuffer[i] == -1 && BarsSinceBuffer[i] < 200)
      finalMultiplier = SuperTrendMultiplier * (1.0 - DivSensitivity);
In this example, the shrink remains active for up to 200 bars after the divergence or until the trend flips. This persistence is only possible because LastTypeBuffer and BarsSinceBuffer are stored for every bar index.
Propagation Mechanism: Copying State Forward
At the beginning of each bar's calculation in the main loop, the indicator copies the state from the previous bar (i + 1) into the current bar (i). This inheritance ensures that every bar knows the most recent divergence status, even if no new divergence is detected on that bar.
for(int i = limit; i >= 0; i--)
  {
   //--- Inherit State from previous older bar (i+1)
   BullArrowBuffer[i]        = EMPTY_VALUE;
   BearArrowBuffer[i]        = EMPTY_VALUE;
   LastTypeBuffer[i]         = LastTypeBuffer[i+1];
   BarsSinceBuffer[i]        = BarsSinceBuffer[i+1] + 1;
   LastPivLowPriceBuffer[i]  = LastPivLowPriceBuffer[i+1];
   LastPivLowOscBuffer[i]    = LastPivLowOscBuffer[i+1];
   LastPivHighPriceBuffer[i] = LastPivHighPriceBuffer[i+1];
   LastPivHighOscBuffer[i]   = LastPivHighOscBuffer[i+1];
Notice the direction of the loop: we iterate from the past (limit) towards the present (0). This is because OnCalculate() receives a price array where index 0 is the most recent bar. By iterating backward, the indicator can refer to i + 1 as the "previous older bar" without needing to check array bounds.
Resetting State on Trend Flips
One subtle but important behavior is that the Adaptive SuperTrend resets its divergence memory when the trend itself flips. If the market changes direction, keeping an old divergence active would be misleading because the shrink is designed to protect a position in the previous trend. We handle this reset with code:
//--- Reset divergence state if the trend flips
if(EnableAdaptiveShrink && currTrend != (int)st_trend_calc[i+1])
  {
   LastTypeBuffer[i] = 0;
   BarsSinceBuffer[i] = 9999;
  }
When the trend changes from bullish to bearish (or vice versa), the divergence state is cleared, and the bars-since counter is set to a large number to deactivate the shrink. This ensures that the indicator only reacts to divergences that are contextually relevant to the current trend.
Concluding the Non-Repainting Design
The divergence arrows are drawn at pIdx = i + DivPivotLen, which is the same delayed-confirmation logic we used in the MPO4 article (the previous article). By the time the arrow appears, enough bars have passed to confirm the pivot, so the signal will not disappear.
More importantly, the shrink is applied based on LastTypeBuffer[i] and BarsSinceBuffer[i], both of which are fixed historical values. When a new tick happens and OnCalculate() recalculates the most recent bar, it does not alter the state stored on older bars. The indicator can be refreshed, the chart can be scrolled, or the terminal can be restarted—the divergence signals and the associated shrink persist exactly where they occurred.
This completes the state management foundation. In the next section, we will walk through the MQL5 implementation, merging the MPO4 calculation, pivot detection, and shrink logic into a single visual indicator.
Implementing the Visual Indicator in MQL5
With the theory of the Adaptive SuperTrend and its shrinking mechanism established, we will now build the complete MQL5 indicator. Unlike the MPO4 oscillator, which runs in a separate window, this indicator plots directly on the price chart. It displays a colored SuperTrend line that adapts its distance from price based on divergence signals, and it marks those signals with arrows directly on the chart.
The implementation will be structured into three main layers:
- Skeleton and Buffer Setup—defining plots, inputs, and memory allocation.
- Initialization—preparing handles, constants, and level styles.
- Main Calculation Loop—merging MPO4/RSI calculation, pivot detection, shrink logic, and SuperTrend math into a single backward-iteration loop.
We will walk through each layer in detail.
Layer 1: Indicator Skeleton and Buffers
The first step is to declare the indicator properties. Since we are plotting on the chart window, we will use:
#property indicator_chart_window
The indicator will display three visual elements:
- The Adaptive SuperTrend line (a DRAW_COLOR_LINE that changes color based on trend direction).
- Bullish divergence arrows (upward).
- Bearish divergence arrows (downward).
We need a total of 17 buffers: 3 for the visible plots and 14 for hidden calculations. The preprocessor directives are:
//--- We need 17 buffers total
#property indicator_buffers 17
#property indicator_plots
                                   3

//--- Define the line style
#property indicator_label1  "Adaptive SuperTrend"
#property indicator_type1   DRAW_COLOR_LINE
#property indicator_color1  clrLimeGreen, clrRed
#property indicator_style1  STYLE_SOLID
#property indicator_width1  2

//--- Plot 2: Bullish Divergence Arrow
#property indicator_label2  "Bull Div"
#property indicator_type2   DRAW_ARROW
#property indicator_color2  clrDodgerBlue
#property indicator_width2  2

//--- Plot 3: Bearish Divergence Arrow
#property indicator_label3  "Bear Div"
#property indicator_type3   DRAW_ARROW
#property indicator_color3  clrMagenta
#property indicator_width3  2
The DRAW_COLOR_LINE uses two colors: clrLimeGreen for an uptrend (color index 0) and clrRed for a downtrend (color index 1). The arrows are drawn using Wingdings characters 233 (up) and 234 (down), which will be set later in OnInit().
Configure Input Parameters
First, we will configure an oscillator enumeration selection for the MPO4 and RSI oscillators. This way, users can easily switch between both indicators.
//--- Enums
enum ENUM_DIV_SOURCE
  {
   DIV_SRC_MPO = 0,    // MPO4 Oscillator
   DIV_SRC_RSI = 1     // Standard RSI
  };
The input parameters and groups are organized to separate oscillator settings, SuperTrend configuration, and divergence shrinking controls:
//--- INPUTS
input group "=== Oscillator Settings ==="
input ENUM_DIV_SOURCE InpSource = DIV_SRC_MPO;    // Oscillator Source
input int    MPO_len = 6;                         // MPO4 Oscillator Length
input int    MPO_smooth = 7;                      // MPO4 Smoothing
input int    RsiPeriod = 14;                      // RSI Period
input int    DivPivotLen = 2;                     // Pivot length of divergence

input group "=== SuperTrend Configuration ==="
input int    SuperTrendPeriod = 10;               // SuperTrend period
input double SuperTrendMultiplier = 3.0;          // SuperTrend [atr] Multiplier

input group "=== Divergence Shrinking ==="
input bool   EnableAdaptiveShrink = true;         // Enable Adaptive Shrinking
input double DivSensitivity = 0.3;                // Shrink factor [0.0 = off, 1.0 extreme]
The ENUM_DIV_SOURCE lets the user choose between the custom MPO4 oscillator and the standard RSI, giving flexibility for those who prefer a familiar momentum gauge.
Global Buffers and Handles
We will split the buffers into three categories:
- Visual plot buffers—directly linked to the three plots.
- Hidden calculation buffers—store MPO4 values, SuperTrend bands, trend states, ATR values, and RSI data.
- State management buffers—store the six buffers that preserve the pivot information and divergence history across bars (as detailed in the state management section).
//--- Indicator Buffers
double ValBuffer[];          // Plot 0: Line Value
double ColorBuffer[];        // Plot 0: Line Color Index
double BullArrowBuffer[];    // Plot 1: Bullish Arrows
double BearArrowBuffer[];    // Plot 2: Bearish Arrows

//--- Hidden Calculation Buffers
double st_up[], st_dn[], st_trend_calc[];
double buf_MPO_Raw[], buf_MPO_Smooth[];
double buf_RSI[];
double buf_ATR_ST[];

//--- Hidden State Memory Buffers
double LastPivLowPriceBuffer[];
double LastPivLowOscBuffer[];
double LastPivHighPriceBuffer[];
double LastPivHighOscBuffer[];
double LastTypeBuffer[];     // 1=Bull, -1=Bear, 0=None
double BarsSinceBuffer[];    // Tracks bars since last divergence
We will also declare handles for the ATR and RSI indicators and the smoothing coefficient.
int atrHandle;
int rsiHandle;
double SmoothAlpha;
Layer 2: The OnInit() Function: Mapping and Initial Setup
Inside OnInit(), we map each buffer using SetIndexBuffer(). Visual buffers are mapped as INDICATOR_DATA, while all other buffers that are used for internal calculations are mapped as INDICATOR_CALCULATIONS. This separation allows the rendering engine to process only the three plot buffers, improving performance.
After mapping, we enforce a timeseries orientation for all buffers with ArraySetAsSeries(..., true). This makes index 0 the most recent bar, simplifying the logic in OnCalculate() when iterating backward.
//+------------------------------------------------------------------+
//| Custom indicator initialization function                         |
//+------------------------------------------------------------------+
int OnInit()
  {
//--- Map Plot Buffers
   SetIndexBuffer(0, ValBuffer, INDICATOR_DATA);
   SetIndexBuffer(1, ColorBuffer, INDICATOR_COLOR_INDEX);
   SetIndexBuffer(2, BullArrowBuffer, INDICATOR_DATA);
   SetIndexBuffer(3, BearArrowBuffer, INDICATOR_DATA);

//--- Map Hidden Calculation Buffers
   SetIndexBuffer(4, st_up, INDICATOR_CALCULATIONS);
   SetIndexBuffer(5, st_dn, INDICATOR_CALCULATIONS);
   SetIndexBuffer(6, st_trend_calc, INDICATOR_CALCULATIONS);
   SetIndexBuffer(7, buf_MPO_Raw, INDICATOR_CALCULATIONS);
   SetIndexBuffer(8, buf_MPO_Smooth, INDICATOR_CALCULATIONS);
   SetIndexBuffer(9, buf_RSI, INDICATOR_CALCULATIONS);
   SetIndexBuffer(10, buf_ATR_ST, INDICATOR_CALCULATIONS);

//--- Map Hidden State Buffers
   SetIndexBuffer(11, LastPivLowPriceBuffer, INDICATOR_CALCULATIONS);
   SetIndexBuffer(12, LastPivLowOscBuffer, INDICATOR_CALCULATIONS);
   SetIndexBuffer(13, LastPivHighPriceBuffer, INDICATOR_CALCULATIONS);
   SetIndexBuffer(14, LastPivHighOscBuffer, INDICATOR_CALCULATIONS);
   SetIndexBuffer(15, LastTypeBuffer, INDICATOR_CALCULATIONS);
   SetIndexBuffer(16, BarsSinceBuffer, INDICATOR_CALCULATIONS);

//--- Force all buffers to behave as TimeSeries (Index 0 = Live Bar)
   ArraySetAsSeries(ValBuffer, true);
   ArraySetAsSeries(ColorBuffer, true);
   ArraySetAsSeries(BullArrowBuffer, true);
   ArraySetAsSeries(BearArrowBuffer, true);
   ArraySetAsSeries(st_up, true);
   ArraySetAsSeries(st_dn, true);
   ArraySetAsSeries(st_trend_calc, true);
   ArraySetAsSeries(buf_MPO_Raw, true);
   ArraySetAsSeries(buf_MPO_Smooth, true);
   ArraySetAsSeries(buf_ATR_ST, true);
   ArraySetAsSeries(LastPivLowPriceBuffer, true);
   ArraySetAsSeries(LastPivLowOscBuffer, true);
   ArraySetAsSeries(LastPivHighPriceBuffer, true);
   ArraySetAsSeries(LastPivHighOscBuffer, true);
   ArraySetAsSeries(LastTypeBuffer, true);
   ArraySetAsSeries(BarsSinceBuffer, true);
We then set the arrow code using PlotIndexSetInteger():
//--- Set Arrow Wingdings Codes
PlotIndexSetInteger(1, PLOT_ARROW, 233); // Up arrow (Plot index 1 is the second plot)
PlotIndexSetInteger(2, PLOT_ARROW, 234); // Down arrow (Plot index 2 is the third plot)
For the final step in this layer, we will create the RSI and ATR handles and precompute the smoothing alpha:
//--- Get RSI if selected
   if(InpSource == DIV_SRC_RSI)
     {
      rsiHandle = iRSI(_Symbol, PERIOD_CURRENT, RsiPeriod, PRICE_CLOSE);
      if(rsiHandle == INVALID_HANDLE)
        {
         Print("Failed to create RSI handle");
         return(INIT_FAILED);
        }
     }

//--- Get ATR Handle
   atrHandle = iATR(_Symbol, PERIOD_CURRENT, SuperTrendPeriod);
   if(atrHandle == INVALID_HANDLE)
     {
      Print("Failed to create ATR handle");
      return(INIT_FAILED);
     }

   SmoothAlpha = 2.0 / (MPO_smooth + 1.0);
   IndicatorSetString(INDICATOR_SHORTNAME, "Adaptive SuperTrend Visual");
   return(INIT_SUCCEEDED);
  }
Layer 3: The Main Calculation Loop
With the indicator skeleton fully prepared and all buffers correctly mapped, we will now continue to the OnCalculate() function. This is where the Adaptive SuperTrend is fully calculated. The function is called on every tick and on each new bar, and its most important responsibility is to determine which bars need to be recalculated.
Understanding the prev_calculated parameter is essential for writing indicators. When the function runs for the first time, prev_calculated equals zero, indicating that every bar must be processed. On subsequent calls, prev_calculated contains the number of bars that were already calculated during the previous call, allowing us to skip historical bars and process only the new data.
We begin by establishing the minimum bar requirement and the calculation limit:
//+------------------------------------------------------------------+
//| Custom indicator iteration function                              |
//+------------------------------------------------------------------+
int OnCalculate(const int rates_total,
                const int prev_calculated,
                const datetime &time[],
                const double &open[],
                const double &high[],
                const double &low[],
                const double &close[],
                const long &tick_volume[],
                const long &volume[],
                const int &spread[])
  {
   if(rates_total < 300)
      return 0;

//--- Setup price series arrays
   ArraySetAsSeries(open, true);
   ArraySetAsSeries(high, true);
   ArraySetAsSeries(low, true);
   ArraySetAsSeries(close, true);

//--- Determine calculation limit (i goes from limit down to 0)
   int limit = rates_total - prev_calculated;
   if(prev_calculated > 0)
      limit++; // Overlap 1 bar to catch crossovers

   int max_idx = rates_total - MPO_len - DivPivotLen - 3;
The limit variable determines the starting index for the calculation loop. By overlapping one bar when prev_calculated > 0, we safely catch any crossovers or state changes. The max_idx variable also prevents the loop from running beyond safe historical bounds.
Initializing the Oldest Bar
If we are recalculating from scratch or the limit exceeds our safe maximum, the limit is set to max_idx and seeds the initial values for the oldest processed bar. This includes fetching the initial ATR, setting a dummy trend, and initializing all state buffers with neutral values:
//--- Initialization Block for the oldest processed bar
   if(limit > max_idx || prev_calculated == 0)
     {
      limit = max_idx;

      // Safely fetch initial ATR
      double tempATR[];
      ArraySetAsSeries(tempATR, true);
      if(CopyBuffer(atrHandle, 0, 0, limit + 2, tempATR) > 0)
        {
         for(int k = 0; k <= limit + 1; k++)
            buf_ATR_ST[k] = tempATR[k];
        }

      //--- Seed Initial Variables at the boundary
      st_trend_calc[limit+1] = (close[limit+1] > open[limit+1]) ? 1 : -1;
      double initMedian = (high[limit+1] + low[limit+1]) / 2.0;
      st_up[limit+1] = initMedian + SuperTrendMultiplier * buf_ATR_ST[limit+1];
      st_dn[limit+1] = initMedian - SuperTrendMultiplier * buf_ATR_ST[limit+1];
      buf_MPO_Smooth[limit+1] = 0;

      LastTypeBuffer[limit+1] = 0;
      BarsSinceBuffer[limit+1] = 9999;
      LastPivLowPriceBuffer[limit+1] = DBL_MAX;
      LastPivLowOscBuffer[limit+1] = -99999;
      LastPivHighPriceBuffer[limit+1] = 0;
      LastPivHighOscBuffer[limit+1] = 99999;
     }
Updating ATR and RSI Data
Before entering the main loop, we must fetch fresh ATR and RSI data using CopyBuffer(). These values are stored in our hidden buffers for the current calculation range. This step ensures that the indicator always works with the most up-to-date volatility and momentum readings:
//--- Update ATR data for current calculation scope
   double liveATR[];
   ArraySetAsSeries(liveATR, true);
   if(CopyBuffer(atrHandle, 0, 0, limit + 2, liveATR) > 0)
     {
      for(int k = 0; k <= limit + 1; k++)
         buf_ATR_ST[k] = liveATR[k];
     }

//--- Fetch RSI data
   if(InpSource == DIV_SRC_RSI)
     {
      double tempRSI[];
      ArraySetAsSeries(tempRSI, true);
      if(CopyBuffer(rsiHandle, 0, 0, limit + 2, tempRSI) > 0)
        {
         for(int k = 0; k <= limit + 1; k++)
            buf_RSI[k] = tempRSI[k];
        }
     }
The Main Loop: State Inheritance, Divergence, and Shrinking Mechanism
This loop iterates from limit down to 0. At each bar i, the first action is to inherit state from the previous bar (i+1). This propagation is what makes the indicator non‑repainting. We copy the divergence type, the bars‑since counter, and the most recent pivot values forward:
for(int i = limit; i >= 0; i--)
  {
   //--- Inherit State from previous older bar (i+1)
   BullArrowBuffer[i]        = EMPTY_VALUE;
   BearArrowBuffer[i]        = EMPTY_VALUE;
   LastTypeBuffer[i]         = LastTypeBuffer[i+1];
   BarsSinceBuffer[i]        = BarsSinceBuffer[i+1] + 1;
   LastPivLowPriceBuffer[i]  = LastPivLowPriceBuffer[i+1];
   LastPivLowOscBuffer[i]    = LastPivLowOscBuffer[i+1];
   LastPivHighPriceBuffer[i] = LastPivHighPriceBuffer[i+1];
   LastPivHighOscBuffer[i]   = LastPivHighOscBuffer[i+1];

   double finalMultiplier = SuperTrendMultiplier;
Now we handle the MPO4 oscillator calculation and divergence detection—but only if adaptive shrinking is enabled. If the source is MPO4, we compute the raw pressure score using the weighted‑body logic from the first article. If RSI is selected, we simply copy the RSI value from buf_RSI. The EMA smoothing then produces buf_MPO_SMOOTH[i]:
//--- MPO4 & Divergence Logic
      if(EnableAdaptiveShrink)
        {
         if(InpSource == DIV_SRC_MPO)
           {
            // MPO4 Math
            double rollingSum = 0;
            double sumBodies = 0;
            for(int k = 0; k < MPO_len; k++)
               sumBodies += MathAbs(close[i+k] - open[i+k]);
            double avgBody = (sumBodies > 0) ? sumBodies / MPO_len : Point();

            for(int k = 0; k < MPO_len; k++)
              {
               int idx = i + k;
               double body = MathAbs(close[idx] - open[idx]);
               double dir = (close[idx] > open[idx]) ? 1.0 : (close[idx] < open[idx]) ? -1.0 : 0.0;
               double weight = (avgBody > 0) ? body / avgBody : 1.0;
               rollingSum += (dir * weight);
              }
            buf_MPO_Raw[i] = (rollingSum / (MPO_len * 2.0)) * 100.0;
           }
         else
           {
            // RSI Bypass
            buf_MPO_Raw[i] = buf_RSI[i];
           }
         buf_MPO_Smooth[i] = (buf_MPO_Raw[i] * SmoothAlpha) + (buf_MPO_Smooth[i+1] * (1.0 - SmoothAlpha));
The pivot detection follows the same delayed confirmation approach we used in the MPO4 article. We evaluate the bar at pIdx = i + DivPivotLen, ensuring that enough bars on both sides exist to confirm a true local extreme. If a pivot low is confirmed, we compare its price and oscillator value against the previous pivot low. When price makes a lower low but the oscillator forms a higher low, a bullish divergence is recorded. The code will set LastTypeBuffer[i] = 1 (bullish), reset the bar-since counter to zero, and draw an upward arrow below the signal index at low[pIdx] - 10 * Point():
//--- Pivot & Div Detection ---
         int pIdx = i + DivPivotLen;
         if(pIdx <= limit)
           {
            bool isPivLow = true;
            bool isPivHigh = true;
            for(int k = 1; k <= DivPivotLen; k++)
              {
               if(buf_MPO_Smooth[pIdx] > buf_MPO_Smooth[pIdx+k] || buf_MPO_Smooth[pIdx] > buf_MPO_Smooth[pIdx-k])
                  isPivLow = false;
               if(buf_MPO_Smooth[pIdx] < buf_MPO_Smooth[pIdx+k] || buf_MPO_Smooth[pIdx] < buf_MPO_Smooth[pIdx-k])
                  isPivHigh = false;
              }

            if(isPivLow)
              {
               if(low[pIdx] < LastPivLowPriceBuffer[pIdx] && buf_MPO_Smooth[pIdx] > LastPivLowOscBuffer[pIdx])
                 {
                  LastTypeBuffer[i] = 1; // Bull Div Detected
                  BarsSinceBuffer[i] = 0; // Reset active counter
                  BullArrowBuffer[pIdx] = low[pIdx] - (10 * Point());
                 }
               LastPivLowPriceBuffer[i] = low[pIdx];
               LastPivLowOscBuffer[i] = buf_MPO_Smooth[pIdx];
              }
            if(isPivHigh)
              {
               if(high[pIdx] > LastPivHighPriceBuffer[pIdx] && buf_MPO_Smooth[pIdx] < LastPivHighOscBuffer[pIdx])
                 {
                  LastTypeBuffer[i] = -1; // Bear Div Detected
                  BarsSinceBuffer[i] = 0; // Reset active counter
                  BearArrowBuffer[pIdx] = high[pIdx] - (10 * Point());
                 }
               LastPivHighPriceBuffer[i] = high[pIdx];
               LastPivHighOscBuffer[i] = buf_MPO_Smooth[pIdx];
              }
           }
The shrink logic is then applied. First, we check whether the current bar is within the active divergence window and whether the trend direction aligns with the divergence type. For a bullish divergence to shrink a downtrend or a bearish divergence to shrink an uptrend, the base SuperTrend multiplier is multiplied by (1.0 - DivSensitivity):
//--- Shrink Logic Application
         int prevTrend = (int)st_trend_calc[i+1];
         if(prevTrend == -1 && LastTypeBuffer[i] == 1 && BarsSinceBuffer[i] < 200)
            finalMultiplier = SuperTrendMultiplier * (1.0 - DivSensitivity);
         else
            if(prevTrend == 1 && LastTypeBuffer[i] == -1 && BarsSinceBuffer[i] < 200)
               finalMultiplier = SuperTrendMultiplier * (1.0 - DivSensitivity);
        }
SuperTrend Indicator Calculation
With the dynamic multiplier determined, we compute the SuperTrend bands. The classic SuperTrend logic uses the median price and the multiplied ATR to produce the upper and lower bands. The previous band is carried forward when the standard SuperTrend rules require it (to avoid band regression):
//--- SuperTrend Calculation
      double median = (high[i] + low[i]) / 2.0;
      double basicUp = median + finalMultiplier * buf_ATR_ST[i];
      double basicDn = median - finalMultiplier * buf_ATR_ST[i];

      double prevUp = st_up[i+1];
      double prevDn = st_dn[i+1];
      double prevClose = close[i+1];

      if(prevClose < prevUp && basicUp > prevUp)
         st_up[i] = prevUp;
      else
         st_up[i] = basicUp;

      if(prevClose > prevDn && basicDn < prevDn)
         st_dn[i] = prevDn;
      else
         st_dn[i] = basicDn;

      int currTrend = (int)st_trend_calc[i+1];
      if(currTrend == -1 && close[i] > st_up[i])
         currTrend = 1;
      else
         if(currTrend == 1 && close[i] < st_dn[i])
            currTrend = -1;

      st_trend_calc[i] = currTrend;
Trend Flip Reset
A subtle but important behavior is that the Adaptive SuperTrend must reset its divergence memory when the trend itself flips. If the market changes direction, keeping an old divergence active would be misleading because the shrink is designed to protect a position in the previous trend. We handle this reset with:
//--- Reset divergence state if the trend flips
      if(EnableAdaptiveShrink && currTrend != (int)st_trend_calc[i+1])
        {
         LastTypeBuffer[i] = 0;
         BarsSinceBuffer[i] = 9999;
        }
Assigning the Visual Plot
Finally, we assign the line value and color index. If the trend is bullish (currTrend == 1), we plot the lower band (st_dn[i]) with color index 0 (clrLimeGreen). If bearish, we plot the upper band (st_up[i]) with color index 1 (clrRed):
//--- Assign Final Values to Visual Plot
      if(currTrend == 1)
        {
         ValBuffer[i] = st_dn[i];
         ColorBuffer[i] = 0; // LimeGreen
        }
      else
        {
         ValBuffer[i] = st_up[i];
         ColorBuffer[i] = 1; // Red
        }
     }

   return rates_total;
The indicator now fully computes the dynamic SuperTrend line, detects divergences, applies the shrink when appropriate, and resets the state on trend flips. The visual output is a non‑repainting chart overlay that adapts to momentum conditions in real time.
Tactical Application and Interpretation
After compiling the indicator, you must define how to use it in live trading. Unlike the MPO4 oscillator from our previous article, which primarily served as a momentum gauge, this indicator combines trend-following and divergence detection into a single visual system. Understanding how to read its signals and integrate them into a trading plan is essential for extracting real value from the tool.
The indicator presents two complementary layers of information:
- The Adaptive SuperTrend Line is a colored line that trails price and changes color based on trend direction (e.g., green for uptrend, red for downtrend). Its distance from price dynamically adjusts based on detected divergences from the MPO4 or RSI indicators.
- Divergence arrows are upward arrows indicating bullish divergence and downward arrows indicating bearish divergence; their colors are fixed (blue for bullish, magenta for bearish). These appear directly on the price chart, positioned near the relevant pivot points.
Reading the Adaptive SuperTrend Line
The SuperTrend line functions as both a dynamic support/resistance level and a trailing stop mechanism. In a healthy uptrend, the green line sits below price, providing a level that price should ideally not breach. In a downtrend, the red line sits above price, acting as resistance. When the price crosses the line, the trend flips, and the line switches color.
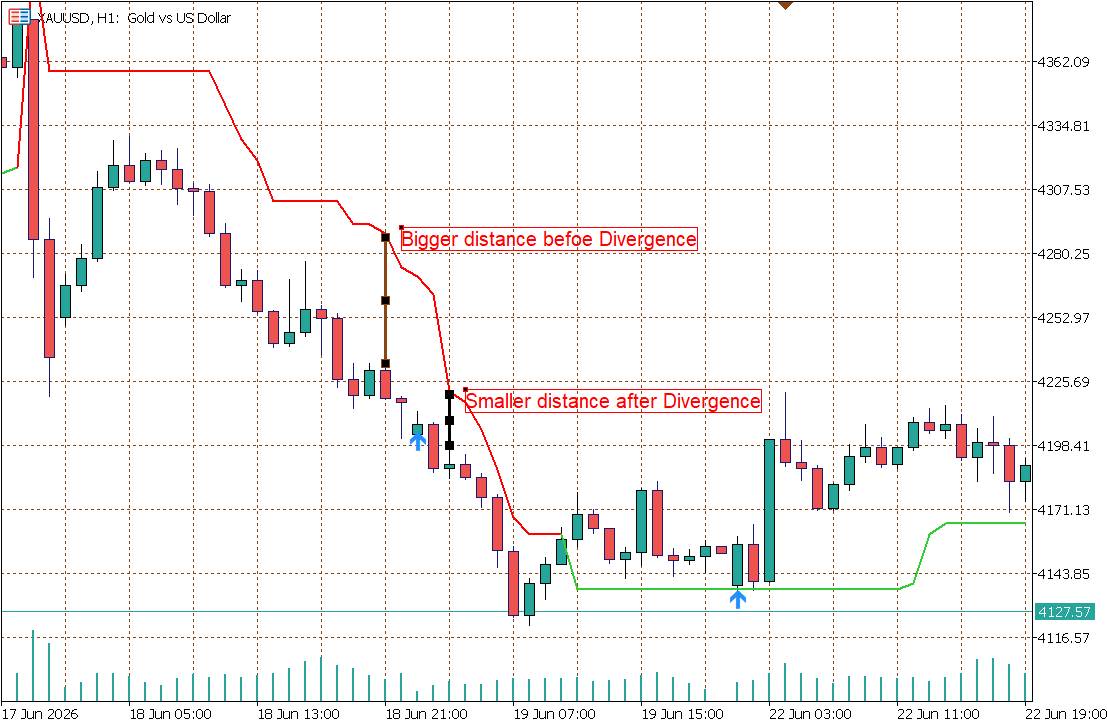
What makes this implementation "adaptive" and different from a normal SuperTrend indicator is the shrink mechanism. When a divergence is detected, the line pulls closer to price. This tightening is visually apparent on the chart, and it signals that the indicator is actively managing risk, anticipating a potential reversal.
Below is a screenshot showing the Adaptive SuperTrend line in both normal and shrunk states using a shrinking factor of 0.5.
And for the bearish side:

Interpreting Divergence Signals in Context
The divergence arrows are generated using a delayed-confirmation logic. By the time an arrow appears, the pivot has been confirmed, and the signal is fixed—it will not repaint. This reliability makes the arrows suitable for backtesting and systematic rule‑based trading.
However, not every divergence is created equal. The following guidelines help separate high‑probability signals from noise:
Bullish Divergence (Upward Arrow):
- Price makes a lower low, but the oscillator makes a higher low.
- Most effective when it occurs near a significant support level or after a sustained downtrend.
- It can be used as a potential entry signal for a long position or as a warning to tighten stops on existing short positions.
Bearish Divergence (Downward Arrow):
- Price makes a higher high, but the oscillator makes a lower high.
- Most effective near resistance levels or after a prolonged uptrend.
- It can be used as a potential entry signal for a short position or to tighten stops on existing long positions.
Using the Shrink for Trade Management
The shrink mechanism is the defining feature of this indicator, and it offers two distinct tactical applications:
Protecting Profits (Defensive Use):
When you are in a trade and a divergence appears that opposes your position, the shrink pulls the SuperTrend line closer to price. This tightens your trailing stop without requiring any manual adjustment. For example, if you are long and a bearish divergence appears, the green line rises, reducing the distance price must travel to trigger a stop‑out. This helps lock in profits before a potential reversal materializes.
Capturing New Trends (Offensive Use):
Because the shrink pulls the line closer to price, a trend reversal requires less price movement to cross the line. This means the indicator will flip to the new trend earlier than a standard SuperTrend. If you use the SuperTrend line crossover as an entry signal, the adaptive version gets you into the new trend closer to the pivot point, improving your risk‑reward ratio.
Combining With Other Filters
While the Adaptive SuperTrend is an effective standalone tool, it works best when combined with other forms of analysis. Here are some complementary filters that can improve signal quality:
Trend Confirmation: Use a higher‑timeframe moving average or trendline to ensure you are trading in the direction of the larger trend. Divergence signals that align with the higher‑timeframe trend are more reliable.
Support and Resistance: A divergence arrow near a key support or resistance level carries more weight than one in the middle of a range. Price reactions at these levels often trigger significant reversals.
Multiple Timeframe Analysis: Check for divergence on a higher timeframe to confirm the signal. For example, a bullish divergence on the 1‑hour chart that aligns with a bullish divergence on the 4‑hour chart is a strong indication of an impending reversal.
Parameter Tuning and Practical Considerations
The default parameters (MPO4 Length = 6, Smoothing = 7, Pivot Length = 2, SuperTrend Period = 10, Multiplier = 3.0, Div Sensitivity = 0.3) can be adjusted based on backtesting and optimization of these parameters. Different markets and timeframes may benefit from adjustments:
- Shorter timeframes (e.g., 5 minutes or 15 minutes) can be optimized or backtested for this strategy for scalpers.
- Longer timeframes (e.g., hourly or 4-hour) can also be optimized for this strategy for day traders or swing traders.
- This strategy is effective on a wide range of markets, including Forex, Indices, Crypto, Commodities, and Energy markets.
- For a more conservative shrinking, users can lower the DivSensitivity input parameter—the shrinking factor—to any suitable number (e.g., from 0.3 to 0.15) to reduce the shrink effect, producing a gentler line movement.
- For a more aggressive shrinking, users can also raise the DivSensitivity input parameter (e.g., from 0.3 to 0.5) to pull the line significantly closer to price during divergence for tighter stops and earlier entries.
The BarsSinceBuffer limit of 200 bars was chosen as a reasonable upper bound for the shrink to remain active. In practice, most trend reversals or opposite signals occur within 20–50 bars after a divergence, so this limit is rarely reached. If you find the shrink persisting too long, you can change this threshold in the code during shrink logic application. Change 200 to any value of your choice:
//--- Shrink Logic Application
         int prevTrend = (int)st_trend_calc[i+1];
         if(prevTrend == -1 && LastTypeBuffer[i] == 1 && BarsSinceBuffer[i] < 200)
            finalMultiplier = SuperTrendMultiplier * (1.0 - DivSensitivity);
         else
            if(prevTrend == 1 && LastTypeBuffer[i] == -1 && BarsSinceBuffer[i] < 200)
               finalMultiplier = SuperTrendMultiplier * (1.0 - DivSensitivity);
        }
Final Thoughts on Practical Use
The Adaptive SuperTrend does not predict reversal. Instead, it provides a disciplined, mechanical framework for managing trends and protecting profits. The shrink mechanism adds a layer of responsiveness that standard SuperTrend lacks, making it particularly useful in volatile or transitioning markets.
For systematic traders, the indicator offers clear, non‑repainting signals that can be backtested and automated. For discretionary traders, it serves as a visual aid that highlights momentum shifts and provides objective levels for stop placement.
The most effective approach is to treat the indicator as one component of a broader trading system. Use the arrows as alerts, the line as a trailing stop, and always consider the broader market context. With practice, the Adaptive SuperTrend becomes an intuitive part of your trading workflow, helping you stay on the right side of the market while protecting your capital.
Conclusion
We have built a complete, custom indicator that fuses momentum divergence with adaptive trend‑following. Starting from the MPO4 pressure oscillator introduced in the first article, we extended its divergence detection engine into a dynamic SuperTrend that actively responds to weakening momentum. The result is a tool that identifies potential reversals and adjusts its trailing stop logic to protect profits and capture new trends earlier.
The key innovation lies in the shrink mechanism. By tying the SuperTrend's ATR multiplier directly to divergence signals, we transformed a historically rigid indicator into an adaptive system. When the market is healthy, the SuperTrend maintains its standard distance, allowing trends to breathe. When momentum wanes, the line tightens, providing a natural brake on open positions and a faster trigger for trend changes. We have addressed the technical challenges of implementing this in MQL5—state management, non‑repainting arrows, and backward‑iteration loops—ensuring that the indicator behaves reliably on live charts.
As with any technical tool, the Adaptive SuperTrend is most effective when combined with sound trading principles. The arrows can be used as alert triggers, the line as a trailing stop, and always consider the broader market context. Experiment with the parameters to suit your timeframe and risk tolerance, and backtest thoroughly before deploying on live accounts.
This indicator bridges the gap between leading momentum and lagging trend‑following, offering traders a more responsive way to manage trends. Whether you are protecting profits during a reversal or entering a new move earlier, the Adaptive SuperTrend provides a mechanical framework for staying on the right side of the market.
Warning: All rights to these materials are reserved by MetaQuotes Ltd. Copying or reprinting of these materials in whole or in part is prohibited.
This article was written by a user of the site and reflects their personal views. MetaQuotes Ltd is not responsible for the accuracy of the information presented, nor for any consequences resulting from the use of the solutions, strategies or recommendations described.

 From Basic to Intermediate: Object Events (IV)
 Implementing a Circular Buffer Class in MQL5: Fixed-Memory Rolling Windows for Real-Time Indicator Calculations
 Market Simulation (Part 24): Position View (II)
 Automating Trading Strategies in MQL5 (Part 50): Turtle Soup Liquidity Sweeps

- Free trading apps
- Over 8,000 signals for copying
- Economic news for exploring financial markets
You agree to website policy and terms of use