
市场轮廓指标

内容
什么是市场轮廓?
彼得·施泰德迈尔(Peter Steidlmayer)在20世纪80年代与芝加哥商品交易所共同开发了市场轮廓概念。使用这种方法的交易者指出,它对于深入理解市场和提高交易效率非常有用。
市场轮廓并不是一个传统的技术指标,它也不会提供直接的交易信号。但它可以补充一个交易系统,帮助交易者整理数据,确定谁控制了市场,什么是公允价值,以及哪些因素影响价格走势。
市场轮廓反映了基于时间、价格和成交量的交易构成。每天都会形成一个价格区间,该区间代表买卖双方之间的平衡。价格在这个区域内波动,市场轮廓帮助交易者在交易期间和交易结束后解释这些变化。它绘制在正态分布曲线上,其中大约70%的值位于均值的一个标准差范围内。换句话说,它是一个分析工具,显示成交量在某些水平上的分布,或者价格在某些水平上花费的时间。它帮助交易者了解最大的交易量发生在何处,并识别关键的供给和需求水平。
使用市场轮廓需要理解一些由市场行为驱动的概念,这些概念直接或间接地显示在图表上。推荐的分析时间框架是M30。
第一个交易小时形成了整个交易日的主要模式,是研究整个交易时段市场参与者活动的基础。这一时期对于确定交易者在市场上做什么以找到买卖双方同意成交的价格至关重要。
市场参与者分为两类:
- 日内交易者 — 在日内几个tick上进行大成交量交易的交易者;
- 其他时段交易者 — 在其他时间段进行交易的交易者,确保价格移动到新的水平。
让我们来看一些基本概念,这些概念将帮助你更好地理解市场轮廓。
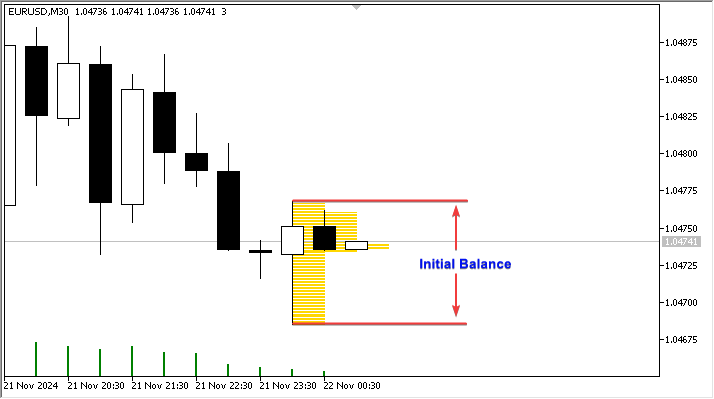
- 初始平衡区域 — 交易时段开始后的第一个小时内的市场价格范围(开盘后两个30分钟的柱状图)。
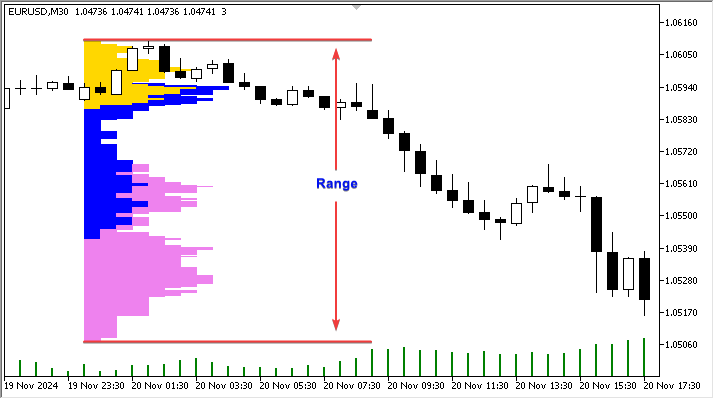
- 范围 — 波动范围,整个市场轮廓的绝对高度。
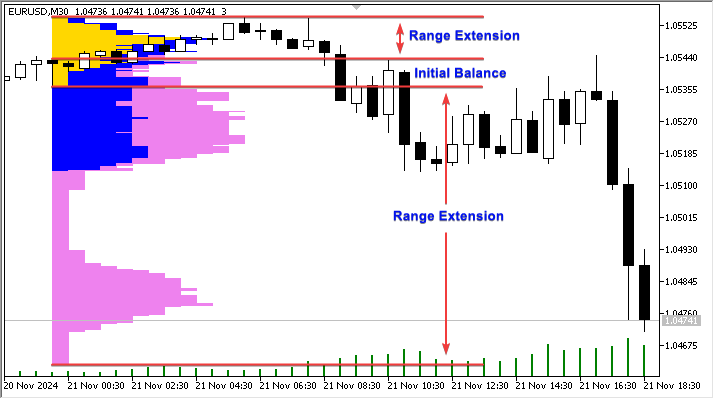
- 扩展范围 — 当价格相对于初始平衡区域移动时,范围的扩展。
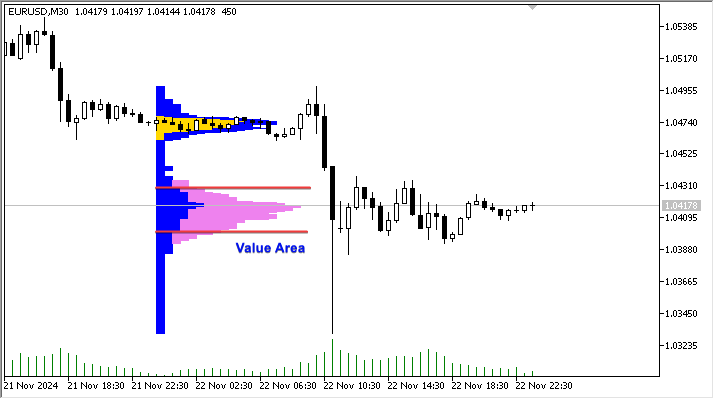
- 价值区域 — 价值区间,包含70%交易活动的价格范围。
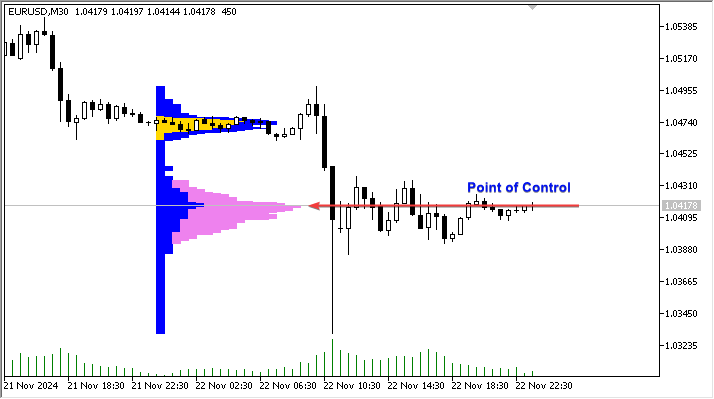
- 控制点(POC) — 最长的轮廓线,也是最接近范围中心的线。
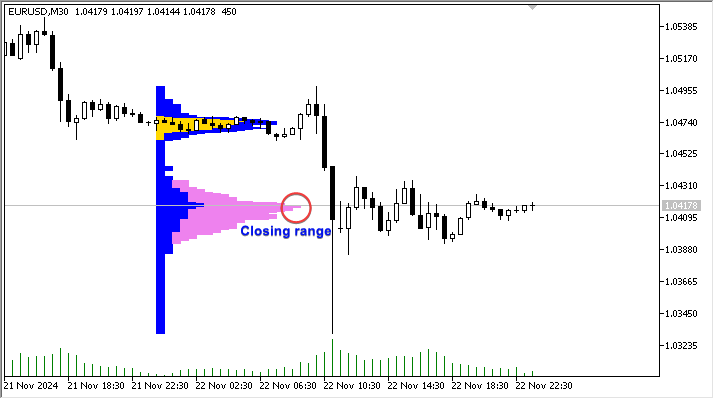
- 结束范围 — 位于交易时段结束附近。
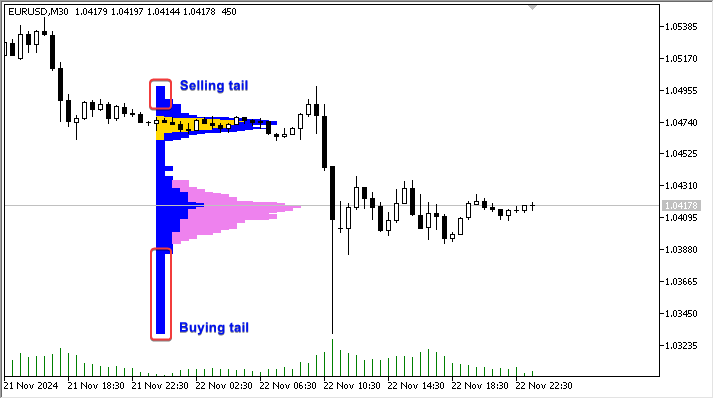
- 买/卖尾 — 存在这样的尾部表明“其他时间框架”交易者的活动急剧增加。
尾部的短长度表明“其他时间框架”交易者的攻击性足够强,无论是从买方还是卖方来看。
要解读市场轮廓,你可以遵循以下基本原则:
- 定义价格-成交量
市场轮廓显示了成交量最高的价格位置。图表上的线或块(通常是水平的)显示价格在某个位置上花费的时间,或者在那里交易的成交量。较长的线表示更多的时间或更多的成交量 — 这些是关键的支撑和阻力位。 - 控制点(POC)
这是在该期间发生最大交易量的价格位置。它通常作为强支撑或阻力水平,因为这里的价位对市场参与者来说是最“可接受”的。 - 公平和不公平的价格区域(价值区域和非价值区域)
- 价值区域 — 通常占该期间交易量的约70%。这是价格大部分时间找到供需“平衡”的范围。
- 非价值区域 — 价值区域上方或下方的水平被视为低交易兴趣区域。如果价格进入这些区域,它可能会迅速返回到价值区域,或者由于供需失衡而继续移动。
- 检测趋势和盘整
- 趋势日 — 当市场稳步向上或向下移动时,市场轮廓在某个方向上“延伸”。在这些情况下,价格不会在水平位置上停留,而是移动,创建新的兴趣区域。趋势日的初始平衡区间较小,占全天范围的不到25%。实际上,这是买家或卖家占据显著主导,从而在一个方向上存在强烈的范围扩展。
- 盘整日 — 轮廓集中在某个水平周围,价值区域保持狭窄。这表明价格处于平衡状态,没有强的趋势。
- 非趋势日 — 特点是初始平衡区间较窄,随后包含了当天的全部价格波动范围。
- 普通日 — 这类交易日的初始平衡区间较宽,大约占全天波动范围的80%。这是最常见的交易日类型。
- 普通日的正常波动 — 这种结构的初始平衡区间约占全天波动范围的50%。在这种情况下,价格波动范围会向某一方向扩展。
- 中性日 — 这种形态的特点不在于初始平衡区间,价格波动范围在两个方向上都有扩展,且收盘价接近波动区间的中心。
- 趋势日 — 当市场稳步向上或向下移动时,市场轮廓在某个方向上“延伸”。在这些情况下,价格不会在水平位置上停留,而是移动,创建新的兴趣区域。趋势日的初始平衡区间较小,占全天范围的不到25%。实际上,这是买家或卖家占据显著主导,从而在一个方向上存在强烈的范围扩展。
- 理解极端值和价格反应
- 如果价格以低成交量达到新水平,并迅速返回到POC或价值区域,这可能表明反弹。
- 如果价格继续在价值区域外交易并创建新的POC,这表明可能开始了一个新趋势。
- 市场轮廓的实际应用
- 寻找入场点:使用POC和价值区域边界识别支撑与阻力位,预期价格从这些位置回调或顺势突破。
- 设置止损和目标:使用POC和价值区域高/低点作为设置保护性止损和止盈的参考位。
经典的市场轮廓基于TPO(时间-价格机会),即拉丁字母的大写字母,每个字母代表交易时段中的30分钟。
MetaTrader 5终端中的市场轮廓
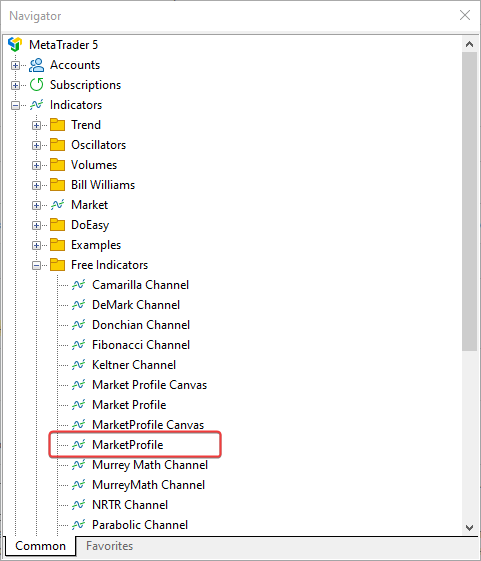
在MetaTrader 5客户端终端中,即 \MQL5\IndicatorsFree Indicators 目录下,提供了一个简化版的市场轮廓指标。你可以在MarketProfile.mq5中找到其代码。与经典表示法不同,该指标按交易时段(亚洲、欧洲、美洲)构建垂直成交量分布图,直观展示价格停留时间较长的区域。它分析日内K线,并将其分解为反映不同市场交易时段的三个时间段。该指标计算在这些交易时段中每个价格水平上的停留时间,并以矩形形式在图表上可视化展示。
解读该指标的关键要点:
- 交易时段划分:
- 全天分为三个交易时段:亚洲、欧洲和美洲。
- 图表上的颜色区域表示在每个交易时段中价格在特定水平停留的时间。
- 价格水平:
- 每个价格水平根据交易时段和价格停留时间的长短进行着色。价格停留时间较长的水平被视为重要水平,因为该处交易活跃。
- POC(控制点):
- 该指标不直接计算POC,但我们可以通过视觉识别颜色区域最长的水平——这些是控制点,标志着关键的供需水平。
- 价值区域:
- 与标准市场轮廓类似,高成交量集中区域(价格长时间停留)可视为价格可能寻求回归的水平。
因此,该代码中的市场轮廓指标有助于理解一天中主要活动集中在哪些水平,并突出每个交易时段的支撑与阻力位。
让我们来看看这个指标是如何工作的。
结构和原则
该指标的输入包括:
- 轮廓显示的天数,
- 距离当前的日线索引:
- 0 — 当天,
- 1 — 前一天,
- 2 — 前两天,以此类推,
- 用于渲染交易时段(亚洲、欧洲和美洲)的颜色,
- 欧洲和美洲交易时段的开盘时间(亚洲交易时段随每日开盘开始)
- 直方图长度倍数:
//--- input parameters
input uint  InpStartDate       =0;           /* day number to start calculation */  // 0 - current, 1 - previous, etc.
input uint  InpShowDays        =3;           /* number of days to display */        // starting with and including the day in InpStartDate
input int   InpMultiplier      =1;           /* histogram length multiplier */
input color InpAsiaSession     =clrGold;     /* Asian session */
input color InpEuropeSession   =clrBlue;     /* European session */
input color InpAmericaSession  =clrViolet;   /* American session */
input uint  InpEuropeStartHour =8;           /* European session opening hour */
input uint  InpAmericaStartHour=14;          /* American session opening hour */
在初始化指标时,我们根据系统启动以来经过的毫秒数的最后四位数字,为对象名称创建一个唯一ID。
//+------------------------------------------------------------------+
//| Custom indicator initialization function                         |
//+------------------------------------------------------------------+
int OnInit()
  {
//--- create a prefix for object names
   string number=StringFormat("%I64d", GetTickCount64());
   ExtPrefixUniq=StringSubstr(number, StringLen(number)-4);
   Print("Indicator \"Market Profile\" started, prefix=", ExtPrefixUniq);

   return(INIT_SUCCEEDED);
  }
该数字将在创建指标的图形对象名称时使用,并在反初始化过程中通过相同的前缀删除这些对象。
//+------------------------------------------------------------------+
//| Custom indicator deinitialization function                       |
//+------------------------------------------------------------------+
void OnDeinit(const int reason)
  {
//--- after use, delete all graphical objects created by the indicator
   Print("Indicator \"Market Profile\" stopped, delete all objects with prefix=", ExtPrefixUniq);
   ObjectsDeleteAll(0, ExtPrefixUniq, 0, OBJ_RECTANGLE);
   ChartRedraw(0);
  }
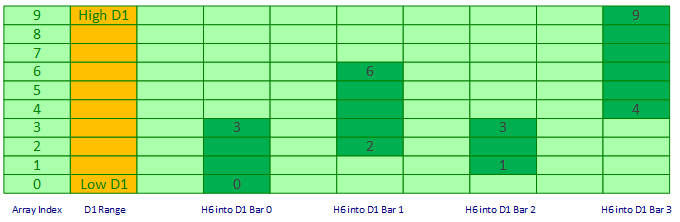
那么这个指标时如何运作的呢?它的渲染逻辑是什么?我们可以想象,一根日K线从最低价到最高价的完整范围就是这张表格的大小。那么表格的每一行就代表一个价格水平:每个价格点就是表格的一行。在最简版本中,表格的列是日内一根K线到另一根K线之间的距离。索引为0的行是最低价格,等于K线的最低价。索引为1的价格是K线的最低价加上一个点。相应地,定义K线最高价的行,就是K线最低价索引行加上从最低价到最高价的点数。
如果我们现在创建一个与这张表格行对应的简单数组,那么它的索引0将存储当天价格变动中,价格触及K线最低价的次数。同样地,该数组中所有其他单元格将存储价格在这些水平上出现的次数。
我们如何确定这一点呢?非常简单。由于开盘时日K线的最低价是数组的索引0,所有其他日内K线的索引都可以计算得出:开盘后下一根K线所对应行的索引,就是该K线的最低价减去开盘日最低价的点数。该K线的最后一个索引则是该K线的最高价减去开盘日最低价。
下图展示了四个六小时日内K线(Bar0、Bar1、Bar2 和 Bar3)在数组中的起始和结束索引:
如果我们在数组中标记出价格水平上出现的K线数量,并绘制市场轮廓的矩形,我们将在数组和图表上得到如下所示的图像:
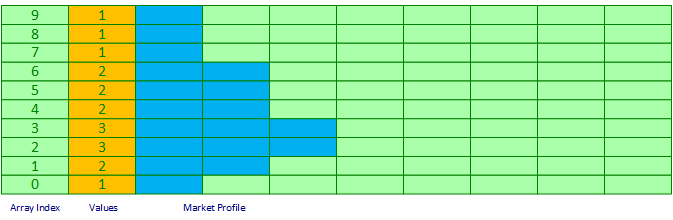
每当新的报价到来时,数组都会被清空,为它设置新的日K线范围大小,并用每个价格水平上出现的K线数量重新填充其索引。这样,市场轮廓就会动态填充并在图表上显示当前市场状态信息,价格在某一水平停留的时间越长(即包含该水平的K线越多),表示该水平的线就越长。
接下来我们来看这是如何在指标代码中实现的:
//+------------------------------------------------------------------+
//| Custom indicator iteration function                              |
//+------------------------------------------------------------------+
int OnCalculate(const int rates_total,
                const int prev_calculated,
                const datetime &time[],
                const double &open[],
                const double &high[],
                const double &low[],
                const double &close[],
                const long &tick_volume[],
                const long &volume[],
                const int &spread[])
  {
//--- opening time of the current daily bar
   datetime static open_time=0;

//--- number of the last day for calculations
//--- (if InpStartDate = 0 and InpShowDays = 3, lastday = 3)
//--- (if InpStartDate = 1 and InpShowDays = 3, lastday = 4) etc ...
   uint lastday=InpStartDate+InpShowDays;

//--- if the first calculation has already been made
   if(prev_calculated!=0)
     {
      //--- get the opening time of the current daily bar
      datetime current_open=iTime(Symbol(), PERIOD_D1, 0);

      //--- if we do not calculate the current day
      if(InpStartDate!=0)
        {
         //--- if the opening time was not received, leave
         if(current_open==open_time)
            return(rates_total);
        }
      //--- update opening time
      open_time=current_open;
      //--- we will only calculate one day from now on, since all other days have already been calculated during the first run
      lastday=InpStartDate+1;
     }

//--- in a loop for the specified number of days (either InpStartDate+InpShowDays on first run, or InpStartDate+1 on each tick)
   for(uint day=InpStartDate; day<lastday; day++)
     {
      //--- get the data of the day with index day into the structure
      MqlRates day_rate[];
      //--- if the indicator is launched on weekends or holidays when there are no ticks, you should first open the daily chart of the symbol
      //--- if we have not received bar data for the day index of the daily period, we leave until the next call to OnCalculate()
      if(CopyRates(Symbol(), PERIOD_D1, day, 1, day_rate)==-1)
         return(prev_calculated);

      //--- get daily range (Range) in points
      double high_day=day_rate[0].high;
      double low_day=day_rate[0].low;
      double point=SymbolInfoDouble(Symbol(), SYMBOL_POINT);
      int    day_size=(int)((high_day-low_day)/point);

      //--- prepare arrays for storing price level rectangles
      int boxes_asia[], boxes_europe[], boxes_america[];
      //--- array sizes equal to the number of points in the day range
      ArrayResize(boxes_asia, day_size);
      ArrayResize(boxes_europe, day_size);
      ArrayResize(boxes_america, day_size);
      //--- zero out the arrays
      ZeroMemory(boxes_asia);
      ZeroMemory(boxes_europe);
      ZeroMemory(boxes_america);

      //--- get all intraday bars of the current day
      MqlRates bars_in_day[];
      datetime start_time=day_rate[0].time+PeriodSeconds(PERIOD_D1)-1;
      datetime stop_time=day_rate[0].time;
      //--- if the indicator is launched on weekends or holidays when there are no ticks, you should first open the daily chart of the symbol
      //--- if it was not possible to get the bars of the current timeframe for the specified day, leave until the next call of OnCalculate()
      if(CopyRates(Symbol(), PERIOD_CURRENT, start_time, stop_time, bars_in_day)==-1)
         return(prev_calculated);

      //--- we go through all the bars of the current day in a loop and mark the price cells that the bars fall into
      int size=ArraySize(bars_in_day);
      for(int i=0; i<size; i++)
        {
         //--- calculate the range of price level indices in the daily range
         int         start_box=(int)((bars_in_day[i].low-low_day)/point);  // index of the first cell of the price array corresponding to the Low price of the current i bar
         int         stop_box =(int)((bars_in_day[i].high-low_day)/point); // index of the last cell of the price array corresponding to the High price of the current i bar

         //--- get the bar hour by the loop index
         MqlDateTime bar_time;
         TimeToStruct(bars_in_day[i].time, bar_time);
         uint        hour=bar_time.hour;

         //--- determine which session the bar belongs to by the bar hour
         //--- American session
         if(hour>=InpAmericaStartHour)
           {
            //--- in the American session array, in cells from start_box to stop_box, increase the bar counters
            for(int ind=start_box; ind<stop_box; ind++)
               boxes_america[ind]++;
           }
         //--- Europe or Asia
         else
           {
            //--- European session
            if(hour>=InpEuropeStartHour && hour<InpAmericaStartHour)
               //--- in the European session array, in cells from start_box to stop_box, increase the bar counters
               for(int ind=start_box; ind<stop_box; ind++)
                  boxes_europe[ind]++;
            //--- Asian session
            else
               //--- in the Asian session array, in cells from start_box to stop_box, increase the bar counters
               for(int ind=start_box; ind<stop_box; ind++)
                  boxes_asia[ind]++;
           }
        }

      //--- draw a market profile based on the created arrays of price levels
      //---  market profile on the chart is drawn with segments of colored lines using the color specified in the settings for each trading session
      //--- segments are drawn as rectangle objects with the height of the rectangle equal to one price point and the width equal to the distance to the next bar to the right

      //--- define the day for the name of the graphical object and the width of the rectangle
      string day_prefix=TimeToString(day_rate[0].time, TIME_DATE);
      int    box_length=PeriodSeconds(PERIOD_CURRENT);

      //--- Asian session
      //--- in a loop by the number of points of the daily bar
      for(int ind=0; ind<day_size; ind++)
        {
         //--- if the Asian session array is full
         if(boxes_asia[ind]>0)
           {
            //--- get the next price by adding the number of 'ind' points to the Low price of the daily bar
            //--- get the start time of the segment (opening time of the daily bar)
            //--- and the end time of the segment (opening time of the daily bar + the number of bars stored in the 'ind' cell of the boxes_asia[] array)
            double   price=low_day+ind*point;
            datetime time1=day_rate[0].time;
            datetime time2=time1+boxes_asia[ind]*box_length*InpMultiplier;
            //--- create a prefix for the name of the Asian session graphical object
            string   prefix=ExtPrefixUniq+"_"+day_prefix+"_Asia_"+StringFormat("%.5f", price);

            //--- draw a rectangle (line segment) at the calculated coordinates with the color for the Asian session
            DrawBox(prefix, price, time1, time2, InpAsiaSession);
           }
        }

      //--- European session
      for(int ind=0; ind<day_size; ind++)
        {
         //--- if the European session array is full
         if(boxes_europe[ind]>0)
           {
            //--- get the next price by adding the number of 'ind' points to the Low price of the daily bar
            //--- get the start time of the segment (opening time of the daily bar + time of the right edge of the Asian session profile)
            //--- and the end time of the segment (start time of the European session segment + the number of bars stored in the 'ind' cell of the boxes_europe[] array)
            double   price=low_day+ind*point;
            datetime time1=day_rate[0].time+boxes_asia[ind]*box_length*InpMultiplier;
            datetime time2=time1+boxes_europe[ind]*box_length*InpMultiplier;
            //--- create a prefix for the name of the graphical object of the European session
            string   prefix=ExtPrefixUniq+"_"+day_prefix+"_Europe_"+StringFormat("%.5f", price);

            //--- draw a rectangle (line segment) at the calculated coordinates with the color for the European session
            DrawBox(prefix, price, time1, time2, InpEuropeSession);
           }
        }

      //--- American session
      for(int ind=0; ind<day_size; ind++)
        {
         //--- if the American session array is full
         if(boxes_america[ind]>0)
           {
            //--- get the next price by adding the number of 'ind' points to the Low price of the daily bar
            //--- get the start time of the segment (opening time of the daily bar + time of the right edge of the Asian session profile + time of the right edge of the European session profile)
            //--- and the end time of the segment (start time of the American session segment + the number of bars stored in the 'ind' cell of the boxes_america[] array)
            double   price=low_day+ind*point;
            datetime time1=day_rate[0].time+(boxes_asia[ind]+boxes_europe[ind])*box_length*InpMultiplier;
            datetime time2=time1+boxes_america[ind]*box_length*InpMultiplier;
            //--- create a prefix for the name of the American session graphical object
            string   prefix=ExtPrefixUniq+"_"+day_prefix+"_America_"+StringFormat("%.5f", price);

            //--- draw a rectangle (line segment) at the calculated coordinates with the color for the American session
            DrawBox(prefix, price, time1, time2, InpAmericaSession);
           }
        }
     }

//--- when the loop is complete, redraw the chart
   ChartRedraw(0);

//--- return the number of bars for the next OnCalculate call
   return(rates_total);
  }
代码注释得足够详细。该指标可以一次性绘制多日的市场轮廓。所有轮廓根据显示的天数,通过循环逐一渲染。
主算法
我们来更详细地看一下上述代码的算法。每一天的绘制方式如下:
- 根据指标运行的图表周期,我们获取属于所显示日期的K线:
MqlRates day_rate[];
if(CopyRates(Symbol(), PERIOD_D1, day, 1, day_rate)==-1)
   return(prev_calculated);

MqlRates bars_in_day[];
datetime start_time=day_rate[0].time+PeriodSeconds(PERIOD_D1)-1;
datetime stop_time=day_rate[0].time;

if(CopyRates(Symbol(), PERIOD_CURRENT, start_time, stop_time, bars_in_day)==-1)
   return(prev_calculated);
- 根据日内K线的数量进行循环
int size=ArraySize(bars_in_day);
for(int i=0; i<size; i++)
- 对于循环中选中的当前K线,我们计算该K线在日K线中所处价格区间的起始和结束索引。
int         start_box=(int)((bars_in_day[i].low-low_day)/point);  // index of the first cell of the price array corresponding to the Low price of the current i bar
int         stop_box =(int)((bars_in_day[i].high-low_day)/point); // index of the last cell of the price array corresponding to the High price of the current i bar
- 然后,我们确定该K线所属的交易时段,并在对应的数组中,将该日内K线价格区间内所有单元格的K线计数器加一。
MqlDateTime bar_time;
TimeToStruct(bars_in_day[i].time, bar_time);
uint        hour=bar_time.hour;

if(hour>=InpAmericaStartHour)
  {
   for(int ind=start_box; ind<stop_box; ind++)
      boxes_america[ind]++;
  }
else
  {
   if(hour>=InpEuropeStartHour && hour<InpAmericaStartHour)
      for(int ind=start_box; ind<stop_box; ind++)
         boxes_europe[ind]++;
   else
      for(int ind=start_box; ind<stop_box; ind++)
         boxes_asia[ind]++;
   }
- 在遍历完所有日内K线后,每个交易时段数组的单元格都会记录在该价格上出现过的K线数量。所有交易时段数组的大小都相同,等于日K线从最低价到最高价之间的价格点数量,但每个数组将根据该交易时段实际达到的价格水平进行填充。
- 接下来,在遍历所有已填充的交易时段数组时,将根据计算出的坐标在图表上显示图形对象:
for(int ind=0; ind<day_size; ind++)
  {
   if(boxes_asia[ind]>0)
     {
      double   price=low_day+ind*point;
      datetime time1=day_rate[0].time;
      datetime time2=time1+boxes_asia[ind]*box_length*InpMultiplier;
      string   prefix=ExtPrefixUniq+"_"+day_prefix+"_Asia_"+StringFormat("%.5f", price);
      DrawBox(prefix, price, time1, time2, InpAsiaSession);
     }
  }

for(int ind=0; ind<day_size; ind++)
  {
   if(boxes_europe[ind]>0)
     {
      double   price=low_day+ind*point;
      datetime time1=day_rate[0].time+boxes_asia[ind]*box_length*InpMultiplier;
      datetime time2=time1+boxes_europe[ind]*box_length*InpMultiplier;
      string   prefix=ExtPrefixUniq+"_"+day_prefix+"_Europe_"+StringFormat("%.5f", price);
      DrawBox(prefix, price, time1, time2, InpEuropeSession);
     }
  }

for(int ind=0; ind<day_size; ind++)
  {
   if(boxes_america[ind]>0)
     {
      double   price=low_day+ind*point;
      datetime time1=day_rate[0].time+(boxes_asia[ind]+boxes_europe[ind])*box_length*InpMultiplier;
      datetime time2=time1+boxes_america[ind]*box_length*InpMultiplier;
      string   prefix=ExtPrefixUniq+"_"+day_prefix+"_America_"+StringFormat("%.5f", price);
      DrawBox(prefix, price, time1, time2, InpAmericaSession);
     }
  }
- 最终,图表上将显示单日的市场轮廓。
绘制线段的函数如下:
//+------------------------------------------------------------------+
//| Draw color box                                                   |
//+------------------------------------------------------------------+
void DrawBox(string bar_prefix, double price, datetime time1, datetime time2, color clr)
  {
   ObjectCreate(0, bar_prefix, OBJ_RECTANGLE, 0, time1, price, time2, price);
   ObjectSetInteger(0, bar_prefix, OBJPROP_COLOR, clr);
   ObjectSetInteger(0, bar_prefix, OBJPROP_STYLE, STYLE_SOLID);
   ObjectSetInteger(0, bar_prefix, OBJPROP_WIDTH, 1);
   ObjectSetString(0, bar_prefix, OBJPROP_TOOLTIP, "\n");
   ObjectSetInteger(0, bar_prefix, OBJPROP_BACK, true);
  }
这些线段是使用图形对象——矩形来绘制的(你也可以通过禁用趋势线的“向左射线”和“向右射线”属性来绘制)。该函数接收矩形的坐标,形式为起始和结束时间,以及一个价格,该价格在矩形的两侧保持一致。这样就得到了一条使用输入参数中指定颜色的普通线段。
在 EURUSD M30 图表上运行该指标,我们可以看到如下的市场轮廓图:
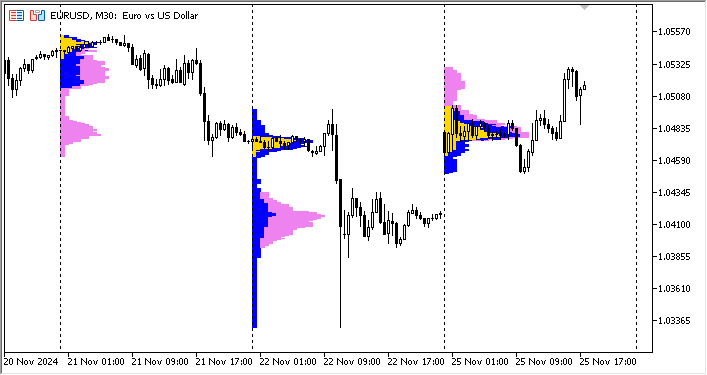
如果我们从每一个前一日(从其控制点 POC)画线,可以清晰地看到“公允”价格的位置,这些位置完全可以作为支撑与阻力位,或价格吸引点(当天的缺口很可能会回补,而该位置恰好是前一日 POC)。
结论
通过研究市场轮廓(Market Profile),你将能更好地理解市场动态,识别关键价位,并找到高效的入场与出场点。市场轮廓与 Tick 图不同,它将价格、成交量和时间以一种便捷的形式结合起来。它能够帮助识别价格均衡水平,并分析当前谁在主导市场。这为交易决策提供了优势,使交易者能够适应市场参与者对公允价值评估的变化。
在熟悉了 MetaTrader 5 客户端自带的市场轮廓指标后,我们现在已经理解了其操作的简便性、构建的逻辑,并可以利用它来评估市场状况,也可以在其基础上开发出更高级、更复杂的工具。
为了全面理解并与其它概念进行比较,你可以阅读 mql5.com上提供的关于市场轮廓的其他文章:
- 价格直方图(市场轮廓)及其在 MQL5 中的实现
- 市场轮廓 — MetaTrader 4 指标
- MarketProfile — MetaTrader 4 指标
- MarketProfile — MetaTrader 5 指标
本文所讨论的指标完整注释代码已附在下方,供您下载和学习。
本文由MetaQuotes Ltd译自俄文
原文地址: https://www.mql5.com/ru/articles/16461
注意: MetaQuotes Ltd.将保留所有关于这些材料的权利。全部或部分复制或者转载这些材料将被禁止。
本文由网站的一位用户撰写,反映了他们的个人观点。MetaQuotes Ltd 不对所提供信息的准确性负责,也不对因使用所述解决方案、策略或建议而产生的任何后果负责。

指标很好,对交易者很有帮助、
但编译后不会出错、
但应用到 mt5 图表后,mt5 会挂起,需要关闭,出现无响应窗口,请解决这个问题。
解决这个问题
是的,计算算法是一样的。
指标很好,对交易者很有帮助、
但编译后不会出错、
但在 mt5 图表上应用后,mt5 会挂起,需要关闭,出现无响应窗口。
解决这个问题
该指标很好,对交易者非常有用、
但它在编译后不会产生错误、
但在 mt5 图表上应用后,mt5 会挂起,需要关闭,出现 "未响应 "窗口,请解决这个问题。
解决此问题
已检查。该指标的两个变体都能在图表上正常运行。
需要更多有关运行位置和方式的数据。