
从零开始在MQL5中实现移动平均线:简单明了

内容
概述
移动平均线是指某一货币对在特定时间段内的平均价格,以一定数量的K线图来表示。它是历史最悠久的技术指标之一,或许也是最受欢迎、使用频率最高的指标,因为大量其他指标都是基于它构建的。
移动平均线被广泛用于解决各种应用问题。从数学角度讲,简单移动平均线(SMA)是给定数值序列的常规算术平均值。在为MetaTrader 5终端创建各种指标、脚本或EA时,都会以某种方式计算移动平均线。移动平均线是一种简单且相当高效的工具,可用于确定趋势方向、平滑微小价格波动(噪音),或基于移动平均线以及客户端和mql5.com上广泛提供的其他指标创建交易策略。
有趣的是,移动平均线不仅广泛应用于金融市场,还应用于其他领域,如气象学和经济学。一些机器学习模型也使用移动平均线的概念作为时间序列预测的特征之一。
移动平均线是一种强大的工具,使用得当可大幅改善交易结果和数据分析。
简单移动平均线 (SMA)
简单移动平均线是给定数量数值(如K线收盘价)的算术平均值。在每个计算点上,移动平均线的值相对于所计算数值序列的相邻点具有相同的权重。就SMA指标而言,在指标线的每根K线(N)上,我们看到的是左侧相邻K线的平均值(N + N-1 + N-2 + N-3 + Nx)/ x,其中x是平均周期(计算K线的数量)
SMA特点:
- 计算方法简单,易于计算和理解。
- 由于其简单性,SMA可能会滞后于价格变化,尤其是在使用较长的计算周期时。
- 常与其他指标结合使用以确认信号。

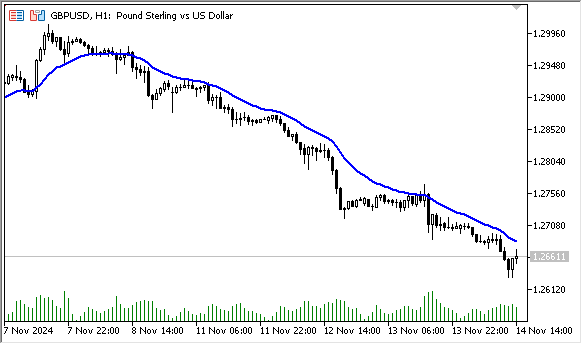
图例1. 简单移动平均线,计算周期为10的收盘价SMA
计算
基于K线收盘价计算的SMA指标可以表示如下:
SMA = SUM(CLOSE(i), N) / N
其中:
- SUM — 求和;
- CLOSE(i) — 当前周期收盘价;
- N — 计算周期数。
对于指标而言,简单移动平均线的计算方式如下:
double result=0;
for(int j=0; j<period; j++)
   result+=close[i-j];
result/=period;
其中:
- result — 一个变量,用于存储简单移动平均线(SMA)的计算结果;
- period — SMA计算周期:即所计算数值序列中的数据量,此处表示K线的收盘价;
- i — 指标主循环(的索引);
- j — 循环索引,用于计算索引为i的K线左侧K线收盘价的平均值。
也就是说,在计算5个周期的平滑平均值时,从索引为i的K线开始循环,并将索引为i-j的K线收盘价相加(i-0 + i-1 + i-2 + i-3 + i-4)。
将“period”数量内所有K线的收盘价相加后,将结果除以周期值。这样,我们就得到了周期内K线收盘价的常规算术平均值。
指标代码:
//+------------------------------------------------------------------+
//|                                           SMAonPriceCloseRAW.mq5 |
//|                                  Copyright 2024, MetaQuotes Ltd. |
//|                                             https://www.mql5.com |
//+------------------------------------------------------------------+
#property copyright "Copyright 2024, MetaQuotes Ltd."
#property link      "https://www.mql5.com"
#property version   "1.00"
#property indicator_chart_window
#property indicator_buffers 1
#property indicator_plots   1

//--- plot MA
#property indicator_label1  "SMA"
#property indicator_type1   DRAW_LINE
#property indicator_color1  clrRed
#property indicator_style1  STYLE_SOLID
#property indicator_width1  1

//--- input parameters
input int      InpPeriod   =  10;   // SMA Period

//--- indicator buffers
double         MABuffer[];
//+------------------------------------------------------------------+
//| Custom indicator initialization function                         |
//+------------------------------------------------------------------+
int OnInit()
  {
//--- indicator buffers mapping
   SetIndexBuffer(0,MABuffer,INDICATOR_DATA);

//--- successful initialization
   return(INIT_SUCCEEDED);
  }
//+------------------------------------------------------------------+
//| Custom indicator iteration function                              |
//+------------------------------------------------------------------+
int OnCalculate(const int rates_total,
                const int prev_calculated,
                const datetime &time[],
                const double &open[],
                const double &high[],
                const double &low[],
                const double &close[],
                const long &tick_volume[],
                const long &volume[],
                const int &spread[])
  {
//--- in the loop from the value of InpPeriod to the current history bar
   for(int i=InpPeriod; i<rates_total; i++)
     {
      //--- calculate average close prices for InpPeriod bars
      double result=0;
      for(int j=0; j<InpPeriod; j++)
         result+=close[i-j];
      result/=InpPeriod;

      //--- Write the calculation result to the buffer
      MABuffer[i]=result;
     }
//--- return value of prev_calculated for the next call
   return(rates_total);
  }
这是一个最简单的指标,它能在图表上显示根据设置(InpPeriod)为历史数据中每根K线计算出的指定周期内的平均收盘价。这些值以线条的形式显示在价格图表上。
要计算指定数量K线的平均价格,我们需要从当前K线开始循环(同样在循环中),将所需数量的收盘价相加,然后将得到的总和除以计算算术平均值所需的K线数量。
因此,从历史数据的起始位置开始循环,对于i循环中的每根K线,我们在j循环中计算其左侧K线收盘价的平均值。这就是为什么主循环不是从0开始,而是从我们计算平均值所需的K线数量值开始——这样在SMA计算开始时,左侧就有所需数量的K线。
上文中我们介绍了很简单且大多非最优化的代码,展示了简单移动平均线的计算方法。这种指标循环的构建方式迫使它再次重新计算整个历史数据,同时在每根K线上执行另一个计算平均价格的循环。按照上述计算方式,我们迟早(很可能很快)会在日志中收到以下消息:
indicator is too slow, 66141 ms. rewrite the indicator, please
显然,我们需要对其进行优化。首先,我们应该有一种更节省资源的指标计算实现方法。
SMAonPriceCloseRAW.mq5指标文件可在本文的附件中找到。
计算优化
节省资源的指标计算意味着按照以下顺序计算:
- 当指标首次启动(或交易品种历史数据发生任何变化)时,对整个可用历史数据进行完整的指标计算。
- 完整计算后,所有计算出的数据将绘制在图表上,现在,我们只需要在每个新报价(tick)到达时,仅计算并更改当前K线的数据。
当接收到Calculate(计算)事件时,指标计算开始启动。此时会调用OnCalculate()事件处理函数(即触发该函数的执行)。
这通常发生在接收到与指标计算所针对交易品种相关的新报价(tick)时。
定义OnCalculate()处理函数有两种方式。但一个指标中不能同时使用这两种函数。
第一种调用形式适用于仅需基于单个数据缓冲区进行计算的指标。
int OnCalculate (const int rates_total,      // price[] array size
                 const int prev_calculated,  // handled bars at the previous call
                 const int begin,            // where significant data starts
                 const double& price[]       // array for calculation
   );
价格时间序列中的某一序列,或某个指标计算得出的数据缓冲区,均可作为price[]数组传入。
用户在启动指标时,可在“参数”选项卡中选择所需的时间序列或指标作为price[]数组。
第二种调用形式适用于所有其他需要使用多个时间序列进行计算的指标。
int OnCalculate (const int rates_total,      // size of input time series
                 const int prev_calculated,  // handled bars at the previous call
                 const datetime& time[],     // Time
                 const double& open[],       // Open
                 const double& high[],       // High
                 const double& low[],        // Low
                 const double& close[],      // Close
                 const long& tick_volume[],  // Tick Volume
                 const long& volume[],       // Real Volume
                 const int& spread[]         // Spread
   );
- open[]、high[]、low[]和close[]参数分别包含当前时间周期的开盘价、最高价、最低价和收盘价数组。
- time[]参数包含开盘时间值的数组。
- spread[]参数是一个包含点差历史数据的数组(如果该交易品种提供了点差数据)。
- volume[]和 tick_volume[]参数分别包含交易量和Tick量(即价格变动次数)的历史数据。
- rates_total参数包含可供指标计算的K线数量,对应图表上显示的K线总数。
- 函数调用时,prev_calculated参数包含上一次调用OnCalculate()函数时返回的值。这使得为计算自定义指标而实现资源节约型算法成为可能,避免对自上次函数调用以来未发生变化的K线进行重复计算。为此,通常只需返回当前函数调用中rates_total参数的值(即当前的K线总数)。如果价格数据在最后一次调用OnCalculate()函数之后发生了变化(例如加载了更久远的历史数据或填补了历史数据的缺口),那么终端会自动将prev_calculated输入参数的值设为0。
由此可见,我们需要prev_calculated变量的值来实现资源节约型计算。在首次启动或历史数据发生变化时,该变量将包含0值。我们可以利用它来实现首次启动时完整的指标计算,而在整个指标计算完成并将全部历史数据写入其缓冲区后,仅计算当前K线的数据。
由于指标循环会遍历历史数据(从某个特定编号开始,直到 rates_total-1 的值),因此,如果我们知道上一次指标运行时计算了多少根K线(该值存储在 prev_calculated 中),就可以控制计算循环的起始位置。
假设这个起始位置由start变量表示,它应包含指标循环应开始的K线索引。在首次运行时,prev_calculated变量将存储0值。这意味着我们可以从0开始循环,直到指标所运行交易品种的K线总数。
但此处有一点注意事项:为了计算移动平均线的值,我们需要从循环的当前K线向前回溯至历史数据起点,并计算平均价格值。但如果我们从零号K线(历史数据起点)开始主循环,那么零号K线左侧就没有数据了,我们将无法获取缺失的历史K线数据。因此,主循环的起始位置应相对于历史数据起点偏移一定数量的K线,这个数量就是计算平均值所需的K线数。这就是指标的计算周期(例如,Period)。
将已计算的K线数量设置到start变量的代码应如下所示:
//--- If this is the first run or a change in historical data
   if(prev_calculated==0)
     {
      //--- initialize the indicator buffer with an empty value and
      //--- set the start of the calculation to the Period value
      ArrayInitialize(MABuffer,EMPTY_VALUE);
      start=Period;
     }
//--- If this is not the first run, the calculation will start at the current bar
   else
      start=prev_calculated-1;
当指标首次启动时,会先向其缓冲区写入一个初始化值。该值为 EMPTY_VALUE — 指标缓冲区的空值,不参与绘图渲染。随后,将指标主循环的起始K线索引设置为start变量。若非首次启动指标,则prev_calculated变量会包含上一次调用OnCalculate()处理函数时已计算的K线数量。因此,在这种情况下,我们将当前K线的索引设为循环的起始位置。多数情况下,该值为prev_calculated - 1。
由于OnCalculate()处理函数会返回一个值(通常为rates_total),我们可通过该返回值调控下一次调用处理函数时需要计算的K线数量。若返回存储在rates_total中的已计算K线数量,则下一次调用OnCalculate时,该值会被写入prev_calculated变量。相应地,若将循环起始K线编号设为prev_calculated - 1,那么在当前K线时,该值为当前K线的索引,而当新K线形成时,该值为前一根K线的索引。通过这种方式,我们指定了循环的起始K线索引:
- 首次启动时:从指标计算周期(如移动平均周期)对应的K线开始;
- 新K线形成时:从前一根K线开始(计算前一根和当前K线);
- 当前K线处理时:每收到一个新报价(Tick)仅计算当前K线。
以下是完整的指标代码示例:
//+------------------------------------------------------------------+
//|                                           SMAonPriceCloseECO.mq5 |
//|                                  Copyright 2024, MetaQuotes Ltd. |
//|                                             https://www.mql5.com |
//+------------------------------------------------------------------+
#property copyright "Copyright 2024, MetaQuotes Ltd."
#property link      "https://www.mql5.com"
#property version   "1.00"
#property indicator_chart_window
#property indicator_buffers 1
#property indicator_plots   1

//--- plot MA
#property indicator_label1  "SMA"
#property indicator_type1   DRAW_LINE
#property indicator_color1  clrRed
#property indicator_style1  STYLE_SOLID
#property indicator_width1  1

//--- input parameters
input int      InpPeriod   =  10;   // SMA Period

//--- indicator buffers
double         MABuffer[];

//--- global variables
int   ExtPeriod;  // SMA calculation period
//+------------------------------------------------------------------+
//| Custom indicator initialization function                         |
//+------------------------------------------------------------------+
int OnInit()
  {
//--- indicator buffers mapping
   SetIndexBuffer(0,MABuffer,INDICATOR_DATA);

//--- successful initialization
   return(INIT_SUCCEEDED);
  }
//+------------------------------------------------------------------+
//| Custom indicator iteration function                              |
//+------------------------------------------------------------------+
int OnCalculate(const int rates_total,
                const int prev_calculated,
                const datetime &time[],
                const double &open[],
                const double &high[],
                const double &low[],
                const double &close[],
                const long &tick_volume[],
                const long &volume[],
                const int &spread[])
  {
//--- Adjust the entered value of the SMA calculation period
   ExtPeriod=(InpPeriod<1 ? 10 : InpPeriod);

//--- If there is not enough historical data for calculation, return 0
   if(rates_total<ExtPeriod)
      return 0;

   int start=0;   // calculation start bar

//--- If this is the first run or a change in historical data
   if(prev_calculated==0)
     {
      //--- initialize the indicator buffer with an empty value and
      //--- set the start of the calculation to ExtPeriod
      ArrayInitialize(MABuffer,EMPTY_VALUE);
      start=ExtPeriod;
     }
//--- If this is not the first run, the calculation will start at the current bar
   else
      start=prev_calculated-1;

//--- in the loop from the 'start' value to the current history bar
   for(int i=start; i<rates_total; i++)
     {
      //--- calculate average close prices for ExtPeriod bars
      double result=0;
      for(int j=0; j<ExtPeriod; j++)
         result+=close[i-j];
      result/=ExtPeriod;

      //--- Write the calculation result to the buffer
      MABuffer[i]=result;
     }

//--- return the number of bars calculated for the next OnCalculate call
   return(rates_total);
  }
SMAonPriceCloseRAW.mq5指标文件可在本文的附件中找到。
现在,当我们在交易品种图表上运行该指标时,将不再收到“计算速度过慢”的提示。但仍存在一个优化问题:在计算当前K线时,仍需对周期内的所有K线进行平均价格循环计算。由于SMA本质是若干K线价格之和除以周期数,我们可以通过数学优化消除当前K线的冗余循环。
当前版本SMA指标的历史数据计算方式。以计算周期为5根K线的SMA为例,其初始计算过程如下:
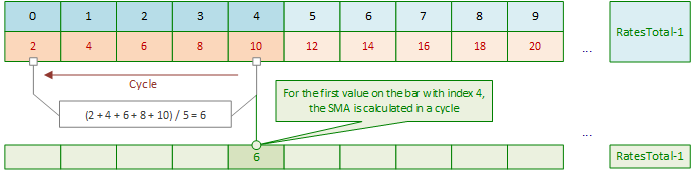
指标启动时,主循环不会从第0根K线开始,而是从 (SMA计算周期数 - 1) 对应的K线开始(即第4根K线):
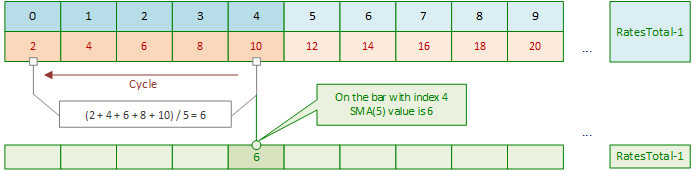
主循环从索引为4的K线开始。计算该K线的SMA值时,需对索引为4、3、2、1、0的K线进行循环。对K线价格求和后,再将总和除以周期数5。假设这些K线的价格分别为2、4、6、8、10(为简化计算以整数值为例),则第4根K线的SMA值为 6 = (2+4+6+8+10)/5。
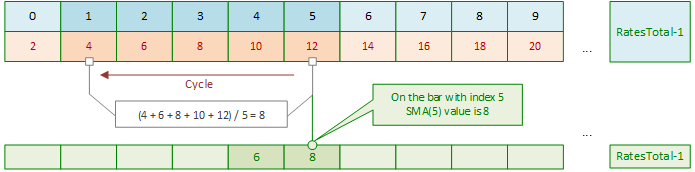
主循环索引右移后,计算下一根K线(索引5)的SMA值时,仍需重新循环求和:
下一次主循环迭代中,再次对索引6的K线执行内循环求和:
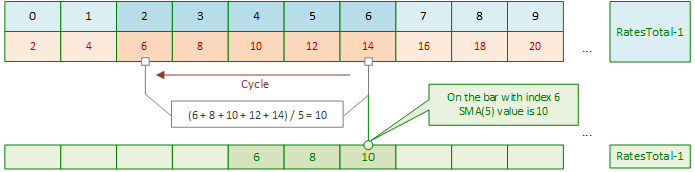
后续每次主循环右移时,均会重复上述模式:对每根新K线重新执行内部循环求和,计算其SMA值。
如此循环,直至主循环到达当前K线:
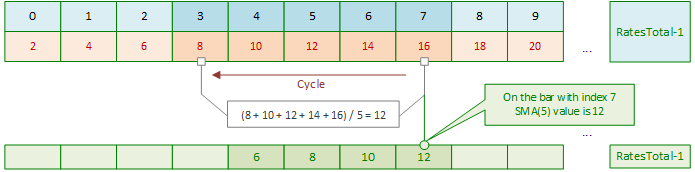
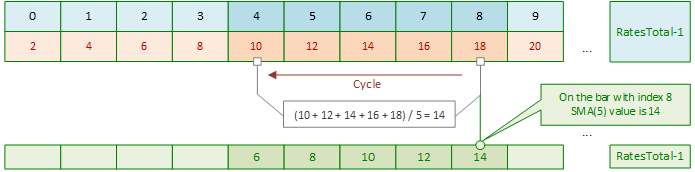
随后,当计算当前K线的SMA值时,每收到一个新的报价(Tick),指标仍会执行内循环来重新计算当前K线的SMA值。
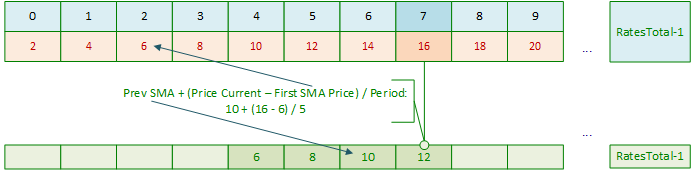
什么是SMA?SMA是某一周期内价格的算术平均值。正如我们所知,要计算一根K线上的SMA,我们需要将前N个周期(Period)K线的价格总和除以计算周期N(Period)。在启动指标时,我们可以通过在循环中累加前N个周期(Period)K线的价格,并将该总和除以周期N(Period)来计算第一个SMA值。现在,当我们将计算SMA的滑动窗口(计算范围)向右移动时,不再需要在循环中累加前N个周期(Period)K线的价格并除以数量,因为我们已经拥有了前一根K线的SMA计算值。
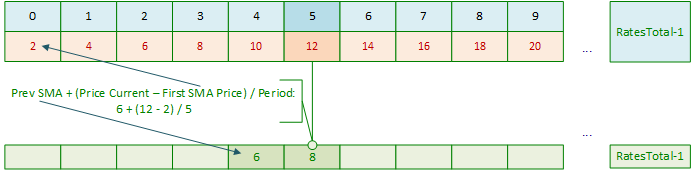
只需从该值中减去参与计算平均值的第一个价格,并将当前价格除以周期N(Period)值后加到结果中即可。一切就绪。换句话说,第一根SMA K线是通过在前N个周期(Period)循环中累加价格,并将累加结果除以周期N(Period)值来计算的。然后,我们只需要进行加法、减法和除法的算术运算:
计算第一个SMA值:
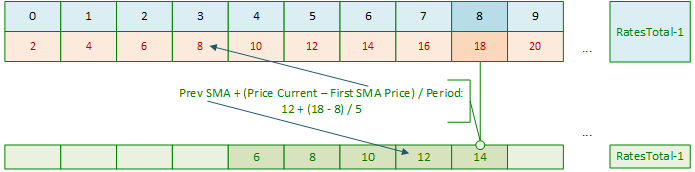
接下来,当主循环索引向右移动时,我们只需进行以下计算:
用新数据重复上述过程:
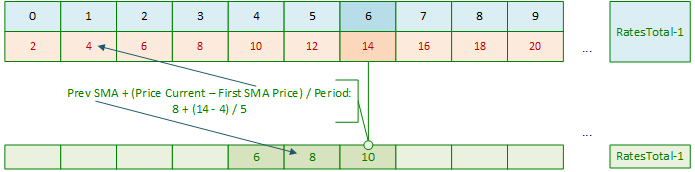
在每次主循环索引偏移时:
每次我们从之前计算的值中得到一个新的SMA值:
让我们考虑以下指标:
//+------------------------------------------------------------------+
//|                                              SMAonPriceClose.mq5 |
//|                                  Copyright 2024, MetaQuotes Ltd. |
//|                                             https://www.mql5.com |
//+------------------------------------------------------------------+
#property copyright "Copyright 2024, MetaQuotes Ltd."
#property link      "https://www.mql5.com"
#property version   "1.00"
#property indicator_chart_window
#property indicator_buffers 1
#property indicator_plots   1

//--- plot MA
#property indicator_label1  "SMA"
#property indicator_type1   DRAW_LINE
#property indicator_color1  clrRed
#property indicator_style1  STYLE_SOLID
#property indicator_width1  1

//--- input parameters
input int      InpPeriod   =  10;   // SMA Period

//--- indicator buffers
double         MABuffer[];

//--- global variables
int   ExtPeriod;  // SMA calculation period
//+------------------------------------------------------------------+
//| Custom indicator initialization function                         |
//+------------------------------------------------------------------+
int OnInit()
  {
//--- indicator buffers mapping
   SetIndexBuffer(0,MABuffer,INDICATOR_DATA);

//--- successful initialization
   return(INIT_SUCCEEDED);
  }
//+------------------------------------------------------------------+
//| Custom indicator iteration function                              |
//+------------------------------------------------------------------+
int OnCalculate(const int rates_total,
                const int prev_calculated,
                const datetime &time[],
                const double &open[],
                const double &high[],
                const double &low[],
                const double &close[],
                const long &tick_volume[],
                const long &volume[],
                const int &spread[])
  {
//--- Adjust the entered value of the SMA calculation period
   ExtPeriod=(InpPeriod<1 ? 10 : InpPeriod);

//--- If there is not enough historical data for calculation, return 0
   if(rates_total<ExtPeriod)
      return 0;

   int start=0;   // calculation start bar

//--- If this is the first run or a change in historical data
   if(prev_calculated==0)
     {
      //--- initialize the indicator buffer with an empty value,
      //--- set the start of the calculation to ExtPeriod and
      //--- calculate average close prices for ExtPeriod bars for the first SMA value on the start-1 bar
      ArrayInitialize(MABuffer,EMPTY_VALUE);
      start=ExtPeriod;
      double value=0;
      for(int i=0; i<start; i++)
         value+=close[i];
      MABuffer[start-1]=value/ExtPeriod;
     }
//--- If this is not the first run, the calculation will start at the current bar
   else
      start=prev_calculated-1;

//--- in the loop from the 'start' value to the current history bar
   for(int i=start; i<rates_total; i++)
     {
      //--- define prices for calculating SMA
      double ma_prev=MABuffer[i-1];             // Previous calculated SMA value
      double price_first=close[i-ExtPeriod];    // Close price ExtPeriod bars ago
      //--- Set the current SMA value to the buffer calculated as
      //--- (past SMA value + (current close price - close price ExtPeriod bars ago) / SMA ExtPeriod calculation period)
      MABuffer[i]=ma_prev+(close[i]-price_first)/ExtPeriod;
     }

//--- return the number of bars calculated for the next OnCalculate call
   return(rates_total);
  }
我们可以将该指标加载到图表上,并将其与标准的SMA进行比较,前提是我们已经为它们设置了相同的计算周期。该指标在启动时使用一个长度为移动平均计算周期的循环,并且在主循环第一次启动时,基于第一个计算出的SMA值为整个工具的历史计算SMA值。在当前K线上,它为每个当前tick执行SMA值的数学计算。
您可以在下方找到SMAonPriceClose.mq5指标文件。
指数移动平均线 (EMA)
指数平滑移动平均线是通过将当前收盘价的一定比例加到之前计算的移动平均值上来计算的。在指数平滑移动平均线中,最近的收盘价更有价值。在计算EMA时,参与计算的K线的价格权重会以由平滑常数k(1 > k > 0)指定的速率呈指数级下降。最常见的情况是,k根据移动平均计算周期来计算:k = 2.0 / (N + 1),其中N是计算周期的值。
EMA:
- 对价格变化的反应更快,使其更适合短期交易,
- 在识别趋势以及买入和卖出信号方面更有效,因为它考虑了最新的数据,
- 常用于与其他EMA(例如50和200)的交叉点,以确定买入或卖出点。

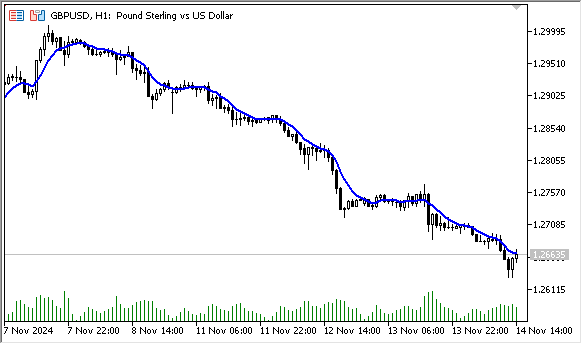
图例2. 指数移动平均线,计算周期为10的收盘价EMA
计算
P-百分比指数移动平均线,其计算如下:
EMA = (CLOSE(i) * P) + (EMA(i - 1) * (1 - P))
其中:
- CLOSE(i) — 当前周期收盘价;
- EMA(i - 1) — 前一周期的移动平均值;
- P — 使用价格数值的百分比(平滑常数)。
让我们编写一个简单的指标,用于展示指数移动平均线的计算过程:
//+------------------------------------------------------------------+
//|                                           EMAonPriceCloseRAW.mq5 |
//|                                  Copyright 2024, MetaQuotes Ltd. |
//|                                             https://www.mql5.com |
//+------------------------------------------------------------------+
#property copyright "Copyright 2024, MetaQuotes Ltd."
#property link      "https://www.mql5.com"
#property version   "1.00"
#property indicator_chart_window
#property indicator_buffers 1
#property indicator_plots   1
//--- plot MA
#property indicator_label1  "EMA"
#property indicator_type1   DRAW_LINE
#property indicator_color1  clrRed
#property indicator_style1  STYLE_SOLID
#property indicator_width1  1

//--- input parameters
input int      InpPeriod   =  10;   // EMA Period

//--- indicator buffers
double         MABuffer[];
//+------------------------------------------------------------------+
//| Custom indicator initialization function                         |
//+------------------------------------------------------------------+
int OnInit()
  {
//--- indicator buffers mapping
   SetIndexBuffer(0,MABuffer,INDICATOR_DATA);

//--- successful initialization
   return(INIT_SUCCEEDED);
  }
//+------------------------------------------------------------------+
//| Custom indicator iteration function                              |
//+------------------------------------------------------------------+
int OnCalculate(const int rates_total,
                const int prev_calculated,
                const datetime &time[],
                const double &open[],
                const double &high[],
                const double &low[],
                const double &close[],
                const long &tick_volume[],
                const long &volume[],
                const int &spread[])
  {
//--- in the loop from zero (the beginning of history) to the current bar
   for(int i=0; i<rates_total; i++)
     {
      double result=0;
      double smf=2.0/(InpPeriod+1.0);                       // smoothing factor
      double prev_value=(i>=1 ? MABuffer[i-1] : close[i]);  // previous calculated EMA value

      //--- calculate EMA based on the Close price of the bar, the previous EMA value and the smoothing factor
      result=close[i]*smf+prev_value*(1-smf);

      //--- Write the calculation result to the buffer
      MABuffer[i]=result;
     }
//--- return value of prev_calculated for the next call
   return(rates_total);
  }
与SMA的计算方式类似,以下展示的EMA计算过程没有对输入参数(例如计算周期)进行校验,同时展示出资源节约型的指标计算逻辑。在首次启动时,指标会计算整个可用的历史数据,然后在每个tick时重新计算整个历史数据。这样不可避免地导致出现提示指标运行太慢的信息。
您可以在附件中找到EMAonPriceCloseRAW.mq5指标文件。
计算优化
让我们来实现一个资源节约型指标计算。在首次启动时,它将计算整个历史数据,然后在每个新的tick时,仅重新计算当前K线:
//+------------------------------------------------------------------+
//|                                              EMAonPriceClose.mq5 |
//|                                  Copyright 2024, MetaQuotes Ltd. |
//|                                             https://www.mql5.com |
//+------------------------------------------------------------------+
#property copyright "Copyright 2024, MetaQuotes Ltd."
#property link      "https://www.mql5.com"
#property version   "1.00"
#property indicator_chart_window
#property indicator_buffers 1
#property indicator_plots   1
//--- plot MA
#property indicator_label1  "EMA"
#property indicator_type1   DRAW_LINE
#property indicator_color1  clrRed
#property indicator_style1  STYLE_SOLID
#property indicator_width1  1

//--- input parameters
input int      InpPeriod   =  10;   // EMA Period

//--- indicator buffers
double         MABuffer[];

//--- global variables
int   ExtPeriod;  // EMA calculation period
//+------------------------------------------------------------------+
//| Custom indicator initialization function                         |
//+------------------------------------------------------------------+
int OnInit()
  {
//--- indicator buffers mapping
   SetIndexBuffer(0,MABuffer,INDICATOR_DATA);

//--- successful initialization
   return(INIT_SUCCEEDED);
  }
//+------------------------------------------------------------------+
//| Custom indicator iteration function                              |
//+------------------------------------------------------------------+
int OnCalculate(const int rates_total,
                const int prev_calculated,
                const datetime &time[],
                const double &open[],
                const double &high[],
                const double &low[],
                const double &close[],
                const long &tick_volume[],
                const long &volume[],
                const int &spread[])
  {
//--- Adjust the entered value of the EMA calculation period
   ExtPeriod=(InpPeriod<1 ? 10 : InpPeriod);

//--- If there is not enough historical data for calculation, return 0
   if(rates_total<ExtPeriod)
      return 0;

   int start=0;   // calculation start bar

//--- If this is the first run or a change in historical data
   if(prev_calculated==0)
     {
      //--- initialize the indicator buffer with an empty value and set the start of the calculation to 0
      ArrayInitialize(MABuffer,EMPTY_VALUE);
      start=0;
     }
//--- If this is not the first run, the calculation will start at the current bar
   else
      start=prev_calculated-1;

//--- in the loop from the 'start' value to the current history bar
   for(int i=start; i<rates_total; i++)
     {
      double result=0;
      double smf=2.0/(ExtPeriod+1.0);                       // smoothing factor
      double prev_value=(i>=1 ? MABuffer[i-1] : close[i]);  // previous calculated EMA value

      //--- calculate the EMA value for the current loop bar
      result=close[i]*smf+prev_value*(1-smf);

      //--- Write the calculation result to the buffer
      MABuffer[i]=result;
     }

//--- return the number of bars calculated for the next OnCalculate call
   return(rates_total);
  }
如果输入的计算周期值小于1,则将移动平均线的默认值设置为10。
EMA的计算使用前一根K线的已计算出的EMA值。
首次启动时,由于尚未执行这类计算,因此我们直接使用收盘价(Close)作为初始数据。
该指标实现了资源节约型数据计算:在首次启动时,计算整个可用的历史数据,在随后的OnCalculate()调用中,仅计算当前K线。
您可以在下方找到EMAonPriceClose.mq5指标文件。
平滑移动平均线 (SMMA)
平滑移动平均线与简单移动平均线不同,它对价格波动的敏感度较低,更注重价格走势的整体方向。
SMMA:
- 比SMA和EMA更不易受波动影响,这使其适用于分析更稳定的趋势,
- 适合长期分析,因为它能平滑掉剧烈的价格波动,
- 可用于生成更可靠的交易信号。
图例3. 平滑移动平均线,计算周期为10的收盘价SMMA
计算
平滑移动平均线第一个值的计算方式与简单移动平均线(SMA)类似:
SUM1  = SUM(CLOSE(i), N)
SMMA1 = SUM1 / N
第二个值的计算按照如下方式:
SMMA(i) = (SMMA1*(N-1) + CLOSE(i)) / N所有后续的移动平均值都通过以下方式计算:
PREVSUM = SMMA(i - 1) * N
SMMA(i) =(PREVSUM - SMMA(i - 1) + CLOSE(i)) / N
其中:
- SUM — 求和;
- SUM1 — 从上一根K线开始的N个周期的收盘价总和;
- PREVSUM — 上一根K线的平滑总和;
- SMMA(i-1) — 上一根K线的平滑移动平均值;
- SMMA(i) — 当前K线的平滑移动平均值(除了第一根K线);
- CLOSE(i) — 当前收盘价;
- N — 平滑周期。
通过算术变换可以简化公式:
SMMA(i) = (SMMA(i - 1) * (N - 1) + CLOSE(i)) / N
让我们编写一个简单的指标,用于计算平滑移动平均线(SSMA):
//+------------------------------------------------------------------+
//|                                          SMMAonPriceCloseRAW.mq5 |
//|                                  Copyright 2024, MetaQuotes Ltd. |
//|                                             https://www.mql5.com |
//+------------------------------------------------------------------+
#property copyright "Copyright 2024, MetaQuotes Ltd."
#property link      "https://www.mql5.com"
#property version   "1.00"
#property indicator_chart_window
#property indicator_buffers 1
#property indicator_plots   1

//--- plot MA
#property indicator_label1  "SMMA"
#property indicator_type1   DRAW_LINE
#property indicator_color1  clrRed
#property indicator_style1  STYLE_SOLID
#property indicator_width1  1

//--- input parameters
input int      InpPeriod=10;  // SMMA Period

//--- indicator buffers
double         MABuffer[];
//+------------------------------------------------------------------+
//| Custom indicator initialization function                         |
//+------------------------------------------------------------------+
int OnInit()
  {
//--- indicator buffers mapping
   SetIndexBuffer(0,MABuffer,INDICATOR_DATA);

//---
   return(INIT_SUCCEEDED);
  }
//+------------------------------------------------------------------+
//| Custom indicator iteration function                              |
//+------------------------------------------------------------------+
int OnCalculate(const int rates_total,
                const int prev_calculated,
                const datetime &time[],
                const double &open[],
                const double &high[],
                const double &low[],
                const double &close[],
                const long &tick_volume[],
                const long &volume[],
                const int &spread[])
  {
//---
   double result=0.0;
   for(int i=InpPeriod-1; i<rates_total; i++)
     {
      //--- first calculation
      if(i==InpPeriod-1)
        {
         //--- calculate a simple moving average for the InpPeriod first bars
         for(int j=0; j<InpPeriod; j++)
           {
            double price=close[i-j];
            result+=price;
           }
         result/=InpPeriod;
         //--- write the first displayed SMMA value calculated as SMA
         MABuffer[InpPeriod-1]=result;
        }
      //--- all subsequent calculations
      else
         result=(MABuffer[i-1]*(InpPeriod-1)+close[i])/InpPeriod;

      //--- Write the calculation result to the buffer
      MABuffer[i]=result;
     }
//--- return value of prev_calculated for the next call
   return(rates_total);
  }
该指标仅显示SMMA的计算过程,在首次启动以及每个新tick时,它会完整地计算整个可用历史数据中的所有K线。这样计算既不理想,也不正确,因为该指标会运行得非常缓慢。我们需要对计算过程进行优化。
计算优化
我们需要控制SMMA计算周期的输入值,在首次启动时完整地计算整个历史数据,然后在每个新tick时仅对当前K线进行计算。
//+------------------------------------------------------------------+
//|                                             SMMAonPriceClose.mq5 |
//|                                  Copyright 2024, MetaQuotes Ltd. |
//|                                             https://www.mql5.com |
//+------------------------------------------------------------------+
#property copyright "Copyright 2024, MetaQuotes Ltd."
#property link      "https://www.mql5.com"
#property version   "1.00"
#property indicator_chart_window
#property indicator_buffers 1
#property indicator_plots   1
//--- plot MA
#property indicator_label1  "SMMA"
#property indicator_type1   DRAW_LINE
#property indicator_color1  clrRed
#property indicator_style1  STYLE_SOLID
#property indicator_width1  1

//--- input parameters
input int      InpPeriod=10;

//--- indicator buffers
double         MABuffer[];

//--- global variables
int   ExtPeriod;  // SMMA calculation period
//+------------------------------------------------------------------+
//| Custom indicator initialization function                         |
//+------------------------------------------------------------------+
int OnInit()
  {
//--- indicator buffers mapping
   SetIndexBuffer(0,MABuffer,INDICATOR_DATA);

//--- successful initialization
   return(INIT_SUCCEEDED);
  }
//+------------------------------------------------------------------+
//| Custom indicator iteration function                              |
//+------------------------------------------------------------------+
int OnCalculate(const int rates_total,
                const int prev_calculated,
                const datetime &time[],
                const double &open[],
                const double &high[],
                const double &low[],
                const double &close[],
                const long &tick_volume[],
                const long &volume[],
                const int &spread[])
  {
//--- Adjust the entered value of the SMMA calculation period
   ExtPeriod=(InpPeriod<1 ? 10 : InpPeriod);

//--- If there is not enough historical data for calculation, return 0
   if(rates_total<ExtPeriod)
      return 0;

   double result=0;
   int    start =0;

//--- If this is the first run or a change in historical data
   if(prev_calculated==0)
     {
      //--- initialize the indicator buffer with an empty value and set the start of the calculation to ExtPeriod
      ArrayInitialize(MABuffer,EMPTY_VALUE);
      start=ExtPeriod;

      //--- calculate a simple moving average for the ExtPeriod first bars
      for(int i=0; i<start; i++)
         result+=close[i];
      result/=ExtPeriod;
      //--- write the first displayed SMMA value calculated as SMA
      MABuffer[start-1]=result;
     }
   else
      start=prev_calculated-1;

//--- in the loop from the 'start' value to the current history bar
//--- calculate the SMMA value for the loop current bar
   for(int i=start; i<rates_total; i++)
      MABuffer[i]=(MABuffer[i-1]*(ExtPeriod-1)+close[i])/ExtPeriod;

//--- return the number of bars calculated for the next OnCalculate call
   return(rates_total);
  }
现在,该指标将高效地计算历史数据和当前K线。您可以在下方找到SMMAonPriceClose.mq5指标文件。
线性加权移动平均线 (LWMA)
就线性加权移动平均线而言,其最新的数据值大于它早期的数值。这使得LWMA对最近的价格变化更为敏感。在这种移动平均线中,K线价格的权重呈线性下降——对于零号(当前)K线,权重最大,而对于编号为N-1的K线,权重为0。
LWMA:
- 与传统的SMA相比,对价格变化的反应更为敏感。
- 允许您以一种方式分析数据,即最新的变化对计算的影响最大。
- 可用于创建各种交易策略,特别是在高波动性的情况下。
图例4. 线性加权移动平均线,计算周期为10的收盘价LWMA
计算
加权移动平均线的计算方式为:将所选序列中的每个收盘价,分别乘以对应的权重系数。
LWMA = SUM(CLOSE(i) * i, N) / SUM(i, N)
其中:
- SUM — 求和;
- CLOSE(i) — 当前收盘价;
- SUM(i, N) — 权重系数的总和;
- N — 平滑周期。
让我们编写一个简单的指标,用于展示线性加权移动平均线的计算过程:
//+------------------------------------------------------------------+
//|                                          LWMAonPriceCloseRAW.mq5 |
//|                                  Copyright 2024, MetaQuotes Ltd. |
//|                                             https://www.mql5.com |
//+------------------------------------------------------------------+
#property copyright "Copyright 2024, MetaQuotes Ltd."
#property link      "https://www.mql5.com"
#property version   "1.00"
#property indicator_chart_window
#property indicator_buffers 1
#property indicator_plots   1
//--- plot MA
#property indicator_label1  "LWMA"
#property indicator_type1   DRAW_LINE
#property indicator_color1  clrRed
#property indicator_style1  STYLE_SOLID
#property indicator_width1  1
//--- input parameters
input int      InpPeriod=10;  // LWMA Period
//--- indicator buffers
double         MABuffer[];
//+------------------------------------------------------------------+
//| Custom indicator initialization function                         |
//+------------------------------------------------------------------+
int OnInit()
  {
//--- indicator buffers mapping
   SetIndexBuffer(0,MABuffer,INDICATOR_DATA);

//---
   return(INIT_SUCCEEDED);
  }
//+------------------------------------------------------------------+
//| Custom indicator iteration function                              |
//+------------------------------------------------------------------+
int OnCalculate(const int rates_total,
                const int prev_calculated,
                const datetime &time[],
                const double &open[],
                const double &high[],
                const double &low[],
                const double &close[],
                const long &tick_volume[],
                const long &volume[],
                const int &spread[])
  {
//--- in the loop from InpPeriod-1 to the current bar
   double result=0.0;
   for(int i=InpPeriod-1; i<rates_total; i++)
     {
      //--- calculate weights (wsum) and the sum of weight coefficients (sum) of InpPeriod bars
      double sum =0.0;
      int    wsum=0;
      for(int j=InpPeriod; j>0; j--)
        {
         wsum+=j;
         sum +=close[i-j+1]*(InpPeriod-j+1);
        }
      //--- get the LWMA value for the current bar of the loop
      result=sum/wsum;
      //--- Write the calculation result to the buffer
      MABuffer[i]=result;
     }
//--- return value of prev_calculated for the next call
   return(rates_total);
  }
该指标在图表上显示每根历史K线的线性加权移动平均线(LWMA)计算结果。每次有新Tick时,系统会对所有历史数据进行完整重算。这种计算方式效率极低且非最优解。我们将通过以下方式优化:采用资源节约型计算逻辑,并添加对输入参数的校验。
LWMAonPriceCloseRAW.mq5指标文件可在本文的附件中找到。
计算优化
优化指标计算逻辑,避免每次Tick都要重算全部历史数据,同时添加对LWMA计算周期输入值的校验。
//+------------------------------------------------------------------+
//|                                             LWMAonPriceClose.mq5 |
//|                                  Copyright 2024, MetaQuotes Ltd. |
//|                                             https://www.mql5.com |
//+------------------------------------------------------------------+
#property copyright "Copyright 2024, MetaQuotes Ltd."
#property link      "https://www.mql5.com"
#property version   "1.00"
#property indicator_chart_window
#property indicator_buffers 1
#property indicator_plots   1
//--- plot MA
#property indicator_label1  "LWMA"
#property indicator_type1   DRAW_LINE
#property indicator_color1  clrRed
#property indicator_style1  STYLE_SOLID
#property indicator_width1  1

//--- input parameters
input int      InpPeriod   =  10;   // LWMA Period

//--- indicator buffers
double         MABuffer[];

//--- global variables
int   ExtPeriod;  // LWMA calculation period
//+------------------------------------------------------------------+
//| Custom indicator initialization function                         |
//+------------------------------------------------------------------+
int OnInit()
  {
//--- indicator buffers mapping
   SetIndexBuffer(0,MABuffer,INDICATOR_DATA);

//--- successful initialization
   return(INIT_SUCCEEDED);
  }
//+------------------------------------------------------------------+
//| Custom indicator iteration function                              |
//+------------------------------------------------------------------+
int OnCalculate(const int rates_total,
                const int prev_calculated,
                const datetime &time[],
                const double &open[],
                const double &high[],
                const double &low[],
                const double &close[],
                const long &tick_volume[],
                const long &volume[],
                const int &spread[])
  {
//--- Adjust the entered value of the LWMA calculation period
   ExtPeriod=(InpPeriod<1 ? 10 : InpPeriod);

//--- If there is not enough historical data for calculation, return 0
   if(rates_total<ExtPeriod)
      return 0;

   double result=0;
   int    start =0;

//--- If this is the first run or a change in historical data
   if(prev_calculated==0)
     {
      //--- initialize the indicator buffer with an empty value and set the start of the calculation to ExtPeriod-1
      ArrayInitialize(MABuffer,EMPTY_VALUE);
      start=ExtPeriod-1;
     }
//--- If this is not the first run, the calculation will start at the current bar
   else
      start=prev_calculated-1;

//--- in the loop from the 'start' value to the current history bar
//--- calculate the LWMA value for the loop current bar
   for(int i=start; i<rates_total; i++)
     {
      //--- calculate weights (wsum) and the sum of weight coefficients (sum) of ExtPeriod bars
      double sum =0.0;
      int    wsum=0;
      for(int j=ExtPeriod; j>0; j--)
        {
         wsum+=j;
         sum +=close[i-j+1]*(ExtPeriod-j+1);
        }
      //--- get the LWMA value for the current bar of the loop
      result=sum/wsum;
      //--- Write the calculation result to the buffer
      MABuffer[i]=result;
     }

//--- return the number of bars calculated for the next OnCalculate call
   return(rates_total);
  }
资源节约型指标的计算原理已在简单移动平均线优化章节中详细阐述。
您可以在下方找到指标文件。
四种移动平均线的优缺点对比
随着时间推移,市场衍生出多种移动平均线类型,包括简单(SMA)、指数(EMA)、加权(WMA)及其他变种。部分采用独特算法,部分基于SMA改进,各自服务于不同分析场景,为数据解读提供全新视角。
以下为四种基础移动平均线的核心优缺点总结:
- SMA(简单移动平均线) 常用于判断趋势方向及识别支撑/阻力位。深受长线交易者与投资者青睐。其通过平滑价格波动,帮助用户更清晰地把握整体趋势。
优点:- 计算与解读简单直观。
- 有效平滑价格波动,趋势清晰呈现。
- 适用于长期趋势分析。
缺点:- 对价格变动反应迟缓,可能导致信号滞后。
- 计算周期内所有价格权重相同,敏感性分布均匀。
- EMA(指数移动平均线)赋予近期价格更高权重,对价格变动更为敏感。用于更快地发出开仓和平仓信号。适合短线交易者及高频操盘手快速捕捉入场/离场时机。
优点:- 侧重最新数据,响应价格变化更快。
- 常与其他指标结合使用,提升信号准确性。
- 提供更贴近当前趋势的实时信息。
缺点:- 市场剧烈波动时可能会产生虚假信号。
- 计算复杂度高于SMA。
- SMMA(平滑移动平均线)可视为EMA与SMA的平滑升级版,在保持信息时效性的同时减少剧烈波动。适合规避虚假信号的交易者进行趋势分析与确认。
优点:- 数据平滑效果优于SMA与EMA。
- 抗波动性强,适用于震荡市场。
- 保留历史数据信息,助力趋势深度分析。
缺点:- 对市场变化的反应速度与SMA相近。
- 趋势检测可能存在滞后。
- LWMA(线性加权移动平均线) 根据价格新旧程度分配权重,近期数据权重更高。适用于需要快速响应价格变动的多周期策略及短线交易。
优点:- 强调近期价格,更精准反映最新市场变化。
- 灵活性优于SMA与EMA,对新数据适应更快。
- 相对更适合短线交易策略。
缺点:- 计算复杂度显著高于SMA与EMA。
- 震荡市场中同样可能产生虚假信号。
结论
我们已经回顾了客户端标准移动平均线指标设置中主流移动平均类型的计算原理。文中展示的算法既可用于带计算优化的指标开发(相关优化方法亦在文中详述),也可作为独立模块嵌入其他程序,实现序列数据集的平均值计算。
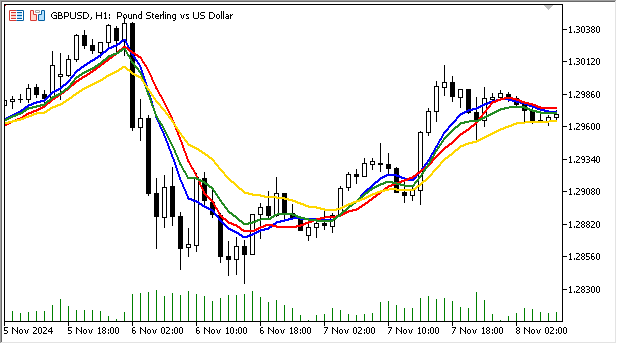
上图展示了相同计算周期(10)下不同类型移动平均线的对比
红色- SMA, 绿色- EMA, 金色- SMMA, 蓝色- LWMA.
由此可见,平滑移动平均线(SMMA)受短期价格波动影响最小,能更清晰地呈现整体趋势方向。
而指数与线性加权移动平均线因对最新数据赋予更高权重,对市场波动反应更为灵敏。
核心总结如下:
SMA作为统计分析工具,通过平滑时间序列数据揭示趋势、短期方向性波动、动态支撑/阻力位及通道边界等关键信息。其概念最早应用于20世纪初,经济学家与工程师借此分析数据并预测未来值。有趣的是,二战期间高射炮部队曾采用SMA算法进行目标定位。
20世纪中期,随着股票交易蓬勃发展,移动平均线在金融分析中被广泛应用。投资者开始寻求平滑股价波动、识别长期趋势的方法。从那时起,移动平均线逐渐成为技术分析领域的标准工具,被交易员与分析师广泛采用。
相同周期不同类型的移动平均线在图表上的表现差异:
- SMA:曲线平滑,但支撑/阻力位识别存在滞后性。
- EMA:紧贴价格走势,对趋势反转反应迅速。
- SMMA:比SMA更平滑,对突发波动反应迟缓。
- LWMA:响应速度快,但波动性高于EMA与SMMA。
移动平均线类型的选用需结合具体策略与市场环境。交易时应综合考虑目标周期、资产波动性及分析目的。在实践中,交易员常组合使用多种移动平均线以提升分析效能。
附件文件:
| # | 类型 | 名称 | 描述 |
|---|---|---|---|
| 1 | 指标 | SMAonPriceCloseRAW.mq5 | SMA计算实例。仅基础计算,不涉及资源节约型算法,也未进行优化处理 |
| 2 | 指标 | SMAonPriceCloseECO.mq5 | SMA计算指标。资源节约型指标计算,未进行优化处理 |
| 3 | 指标 | SMAonPriceClose.mq5 | SMA计算指标。资源节约型指标计算,进行优化处理 |
| 4 | 指标 | EMAonPriceCloseRAW.mq5 | EMA计算实例。仅基础计算,未采用资源节约型算法 |
| 5 | 指标 | EMAonPriceClose.mq5 | EMA计算指标。资源节约型指标计算 |
| 6 | 指标 | SMMAonPriceCloseRAW.mq5 | SMMA计算实例。仅基础计算,未采用资源节约型算法 |
| 7 | 指标 | SMMAonPriceClose.mq5 | SMMA计算指标。资源节约型指标计算 |
| 8 | 指标 | LWMAonPriceCloseRAW.mq5 | LWMA calculation example. 仅基础计算,未采用资源节约型算法 |
| 9 | 指标 | LWMAonPriceClose.mq5 | LWMA计算指标。资源节约型指标计算 |
本文由MetaQuotes Ltd译自俄文
原文地址: https://www.mql5.com/ru/articles/16308
注意: MetaQuotes Ltd.将保留所有关于这些材料的权利。全部或部分复制或者转载这些材料将被禁止。
本文由网站的一位用户撰写,反映了他们的个人观点。MetaQuotes Ltd 不对所提供信息的准确性负责,也不对因使用所述解决方案、策略或建议而产生的任何后果负责。

谢谢你的好文章。但我还是忍不住要批评它。我今天的心情就是这样。
这篇文章特别关注的不是编码,而是公式和计算的优化。但我认为,它对程序员新手 和最近才开始关注使用不同循环运算符的程序员 更有用。我希望接下来的文章能反映出这一点。毕竟,MQL5 中至少有 3 个循环操作符。它们中的任何一个都可以用来构建一个指标。
有用的信息、
最后是 i++ 循环
这篇文章很适合初学者,它展示了标准 4 MQ 平均值背后的代码。
您还应讨论简单优化的重要性及其影响,因为 99% 的刻度都发生在柱形图变化之间。 尽量减少每次柱形图变化之间的计算,将以少量复杂性为代价,大大提高效率。 因此,在柱形图变化时计算一次基准值并保存这些值,将大大减少计算时间:
考虑
double sm=0;
for(int bar=0;bar<N;bar++) sum+=Close[CurrentBar-bar];
SMA=sum/N;
与
静态 double partialsum;
double sum=0;
在条形图变化时{
partialsum=0;
for(int bar=0;bar<N-1;bar++) partialsum+=Close[CurrentBar-bar];
partialsum/=(N-1);
}
SMA =partialsum +Close[CurrentBar]/N;
如果一个条形图周期内有 1000 个刻度点,N=10,那么此优化将为每个条形图节省约 90,000 次 sum+=Close[EndingBar-bar] 计算。 如果您的图表包含 1,000 个条形图,那么将节省超过9,000 万次不必要的计算。 对于现代 CPU 而言,此示例产生的节省是微不足道的,可能并不明显,但随着您的智能交易系统程序越来越复杂,这些节省最终会增加。
手动优化的重要性在于,您可以开发出更好的编程技术,这些技术在未来的项目 中将成为您的第二天性。
感谢你的文章,但不清楚为何,使用 OnCalculate() 函数后,我无法再使用 OrderSend() 交易函数,不知作者如何解决这个问题,我没办法只能使用标准程序库中的指标,方法如下: