Transaction Speed MT5

5

Göstergemiz, piyasada ilgi gösterilen bölgeleri vurgular ve ardından emir birikim bölgelerini gösterir.
Büyük ölçekli bir emir defteri (order book) gibi çalışır.
Bu, büyük sermaye için geliştirilmiş bir göstergedir. Performansı olağanüstüdür.
Piyasada ne tür bir ilgi olursa olsun, onu görürsünüz.

(Bu, tamamen yeniden yazılmış ve otomatikleştirilmiş bir versiyondur – artık manuel analiz gerekmez.)
İşlem Hızı (Transaction Speed), piyasada büyük emirlerin nerede ve ne zaman biriktiğini gösteren ve bundan nasıl faydalanabileceğinizi ortaya koyan yeni nesil bir göstergedir.
Trend değişimlerini çok erken bir aşamada algılayabilir.
Forex piyasasında hacim (volume) kavramı genellikle yanlış anlaşılır. Gerçekte bu, zaman başına fiyat değişimi anlamına gelir.
Bu nedenle, doğru terim işlem hızıdır.
Burada önemli olan, nasıl düşündüğümüz, nasıl analiz ettiğimiz ve nasıl hareket ettiğimizdir.
Paradigma değişikliği son derece önemlidir.
Bu gösterge, Forex’teki hacim anlayışını tamamen yeniden tanımlar ve mantıklı bir yapıya kavuşturarak, benzersiz ve kesin bir araç haline getirir.

Nasıl Kullanılır:

Göstergenin varsayılan ayarı otomatik moddur, böylece tüm zaman dilimlerinde bağımsız olarak kullanılabilir.
Manuel moda geçmek isterseniz, sadece Auto / Manual Mode düğmesine tıklamanız yeterlidir.

Manuel modda tüm hesaplamalar 1 Ocak 2025 tarihinden itibaren başlar.
Bu tarihi istediğiniz gibi değiştirebilir ve farklı analiz sonuçları elde edebilirsiniz.
İdeal veri aralığı 4 ila 6 ay arasıdır.
Bu sayede birçok piyasa döngüsünü kapsayabilir ve güçlü bir temel elde edersiniz.
Dönem uzadıkça, oluşan bölge sayısı azalır.

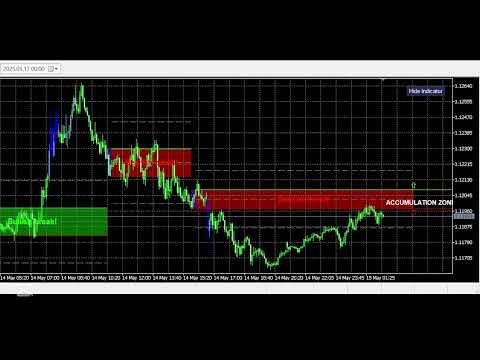
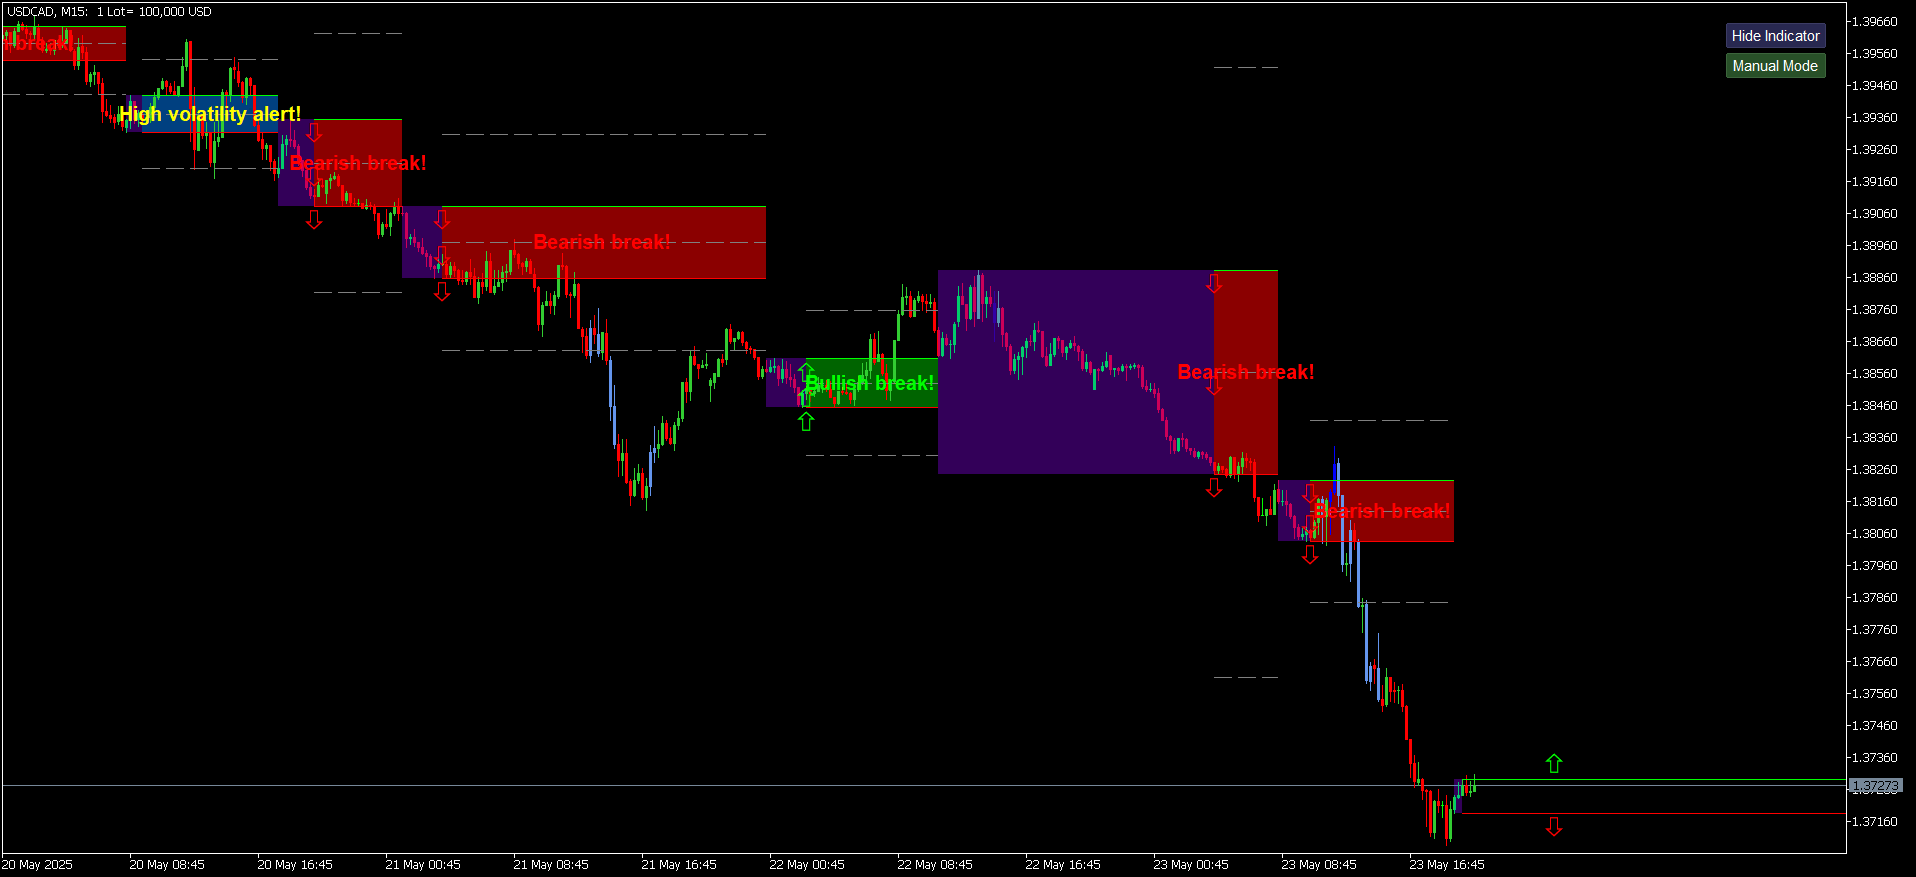
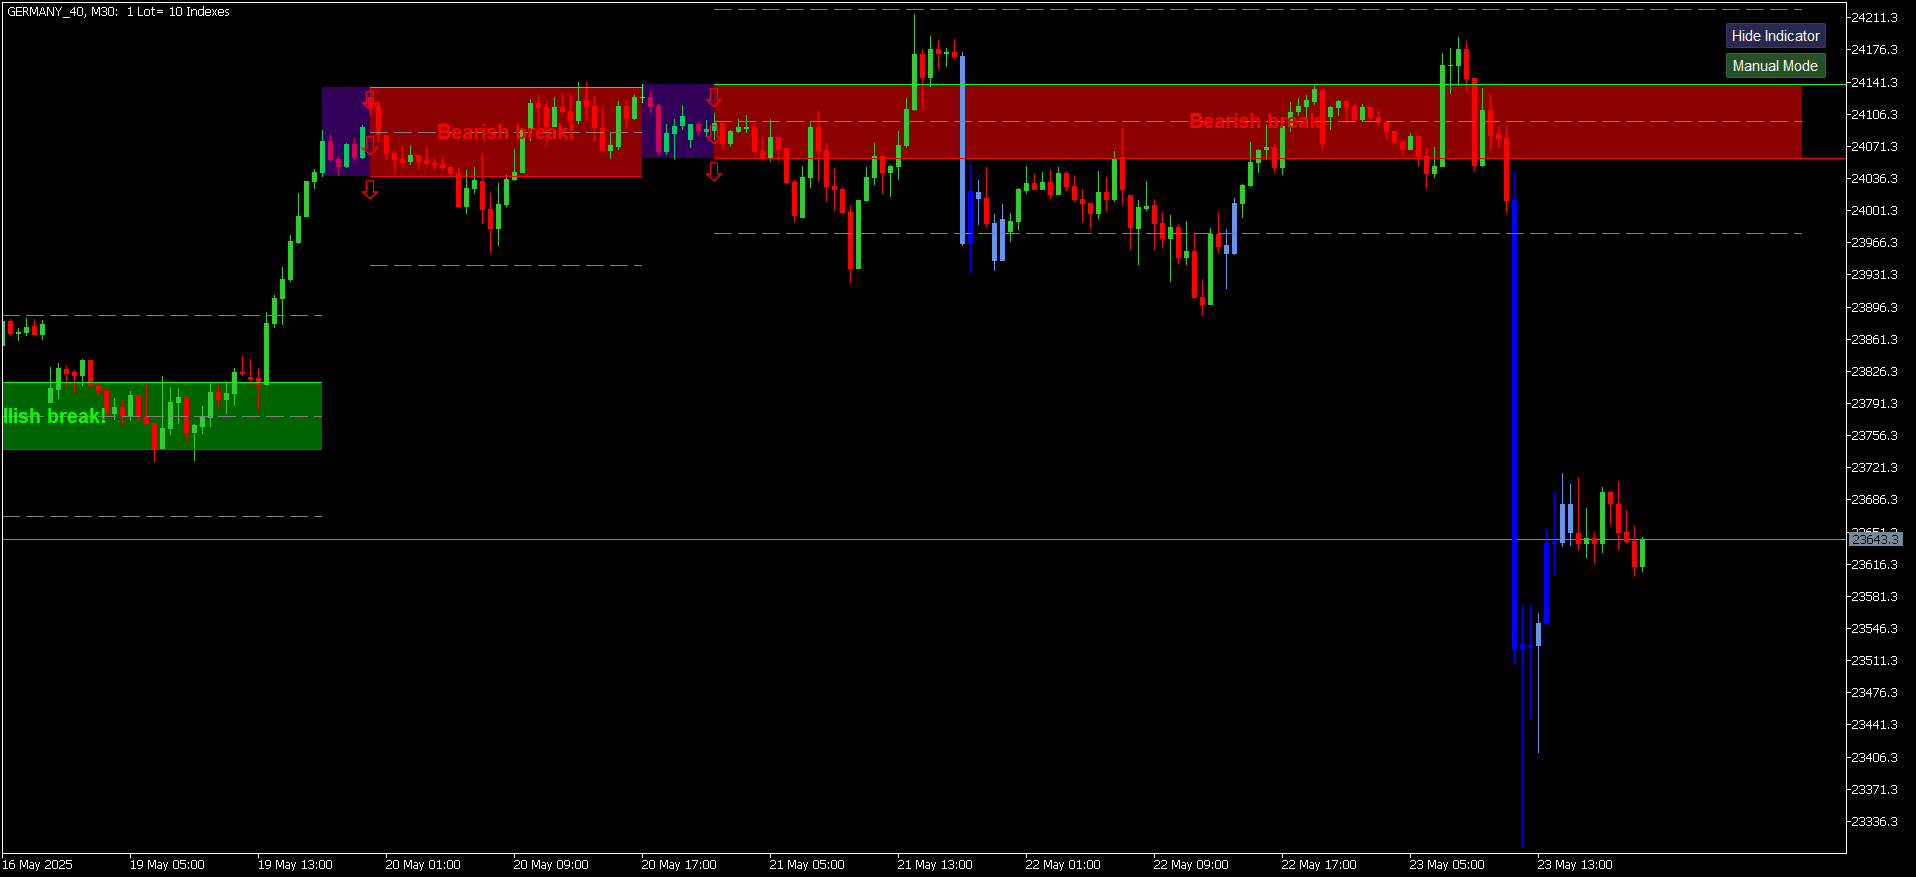
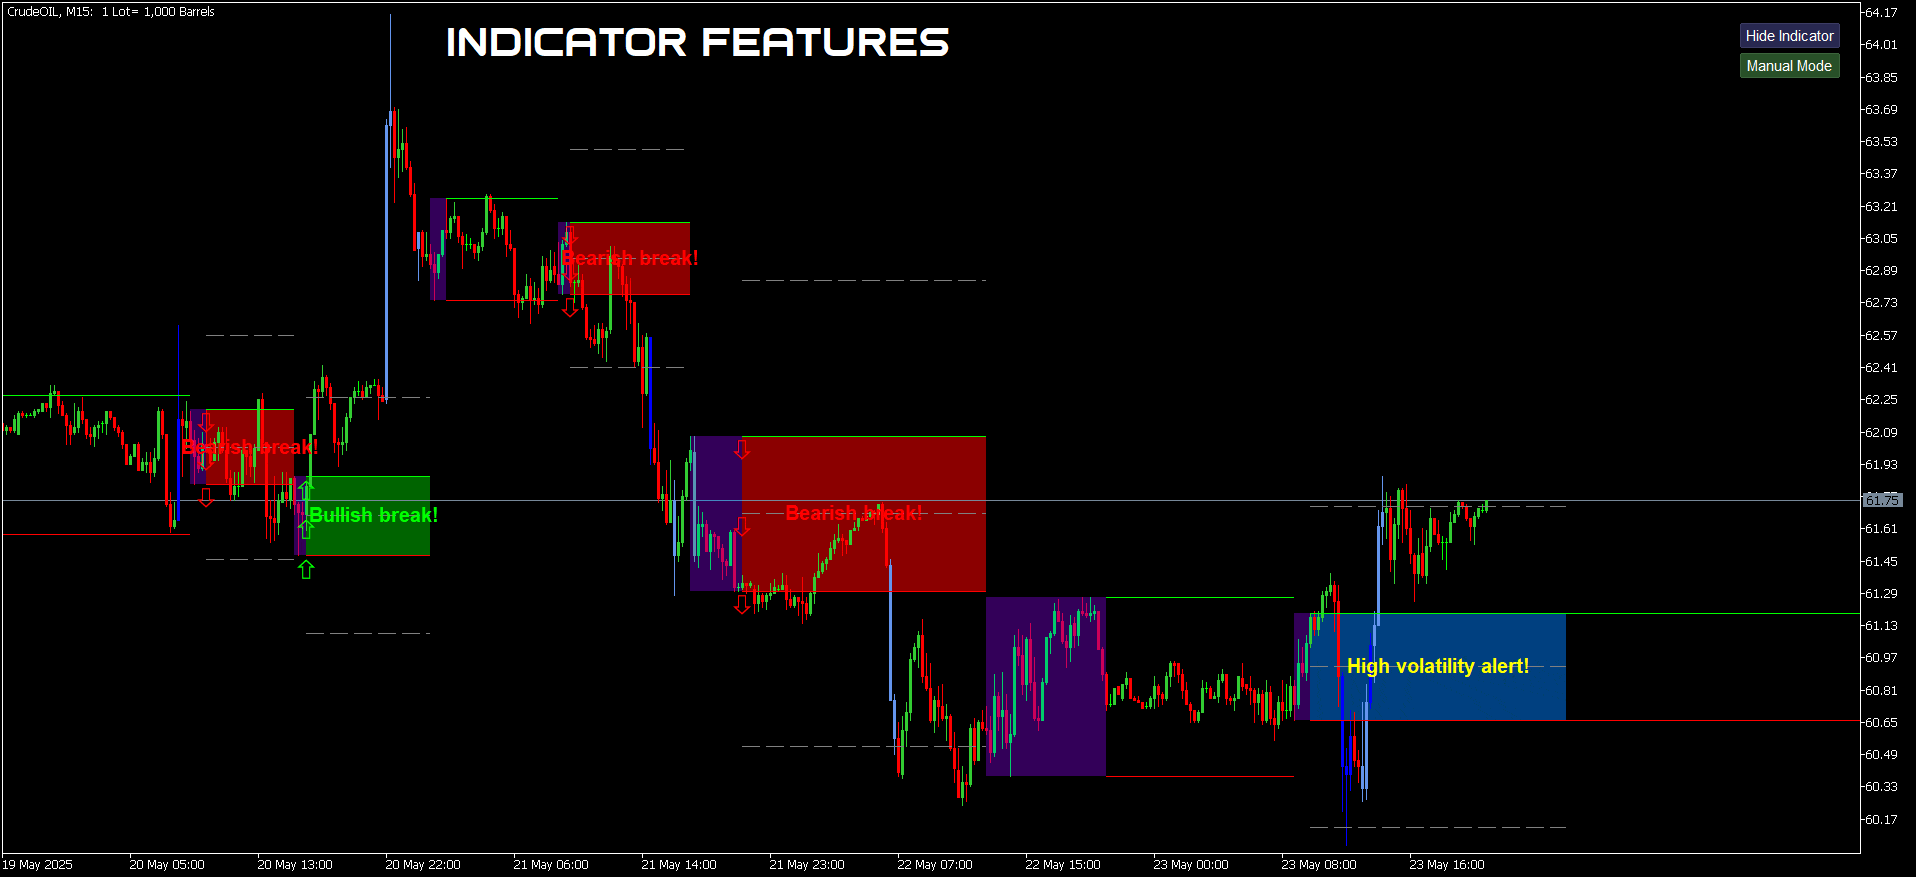
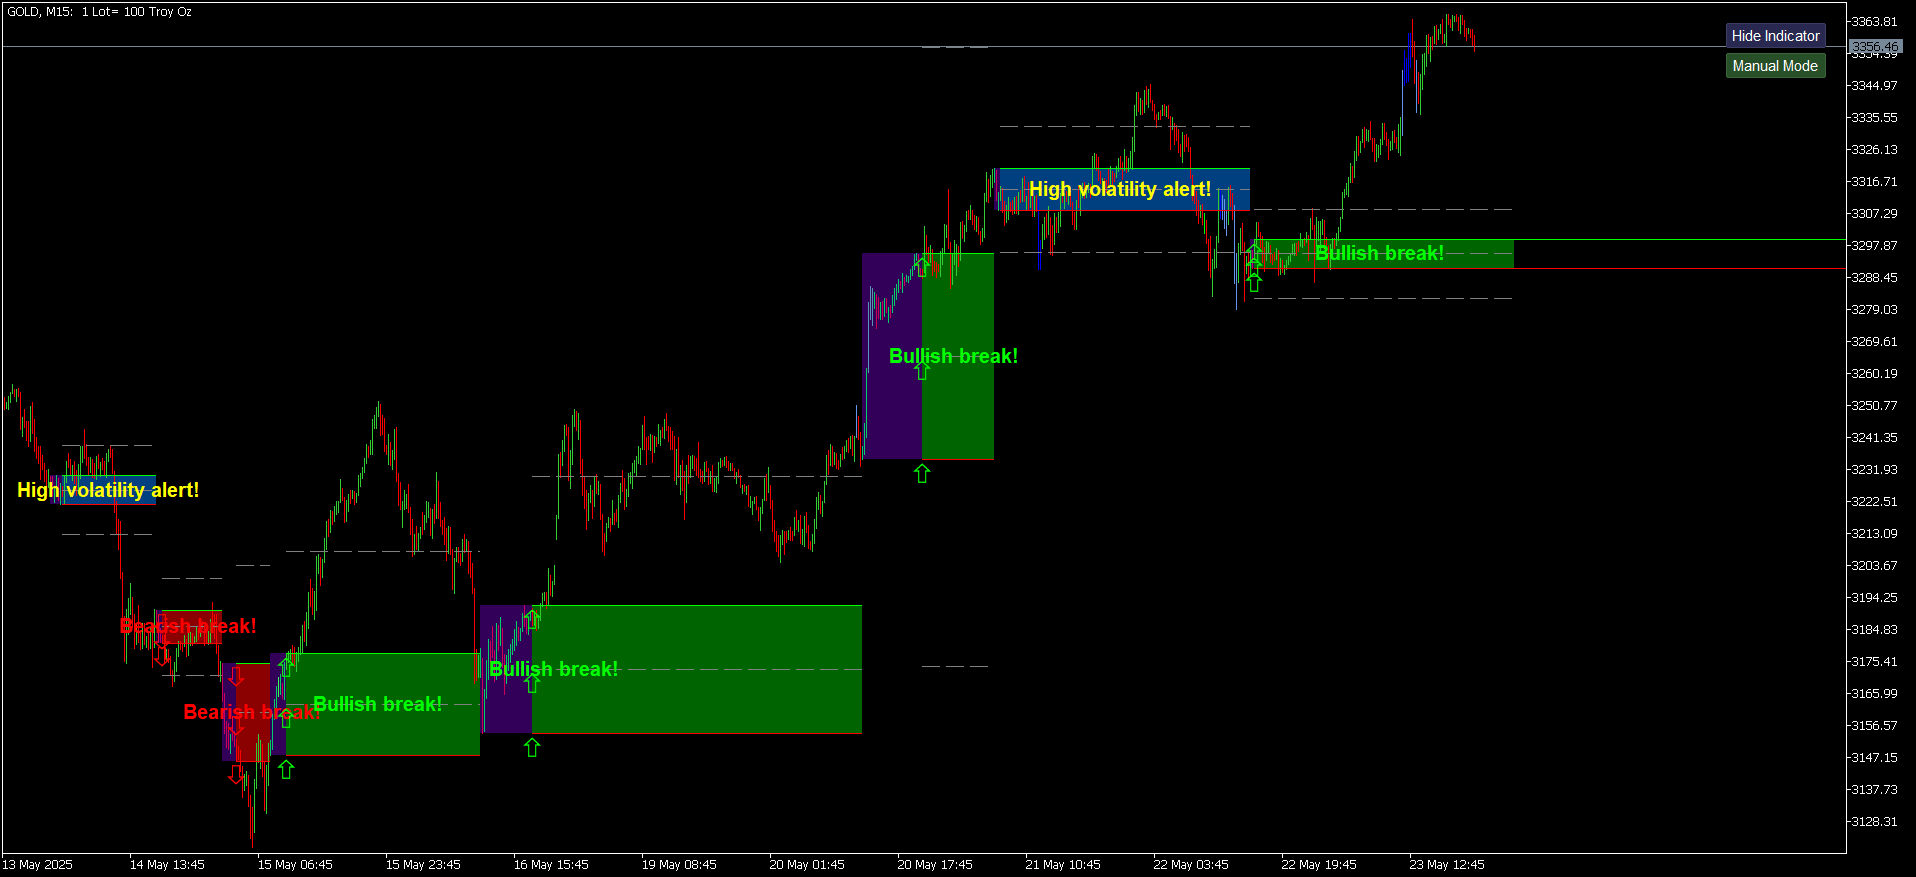
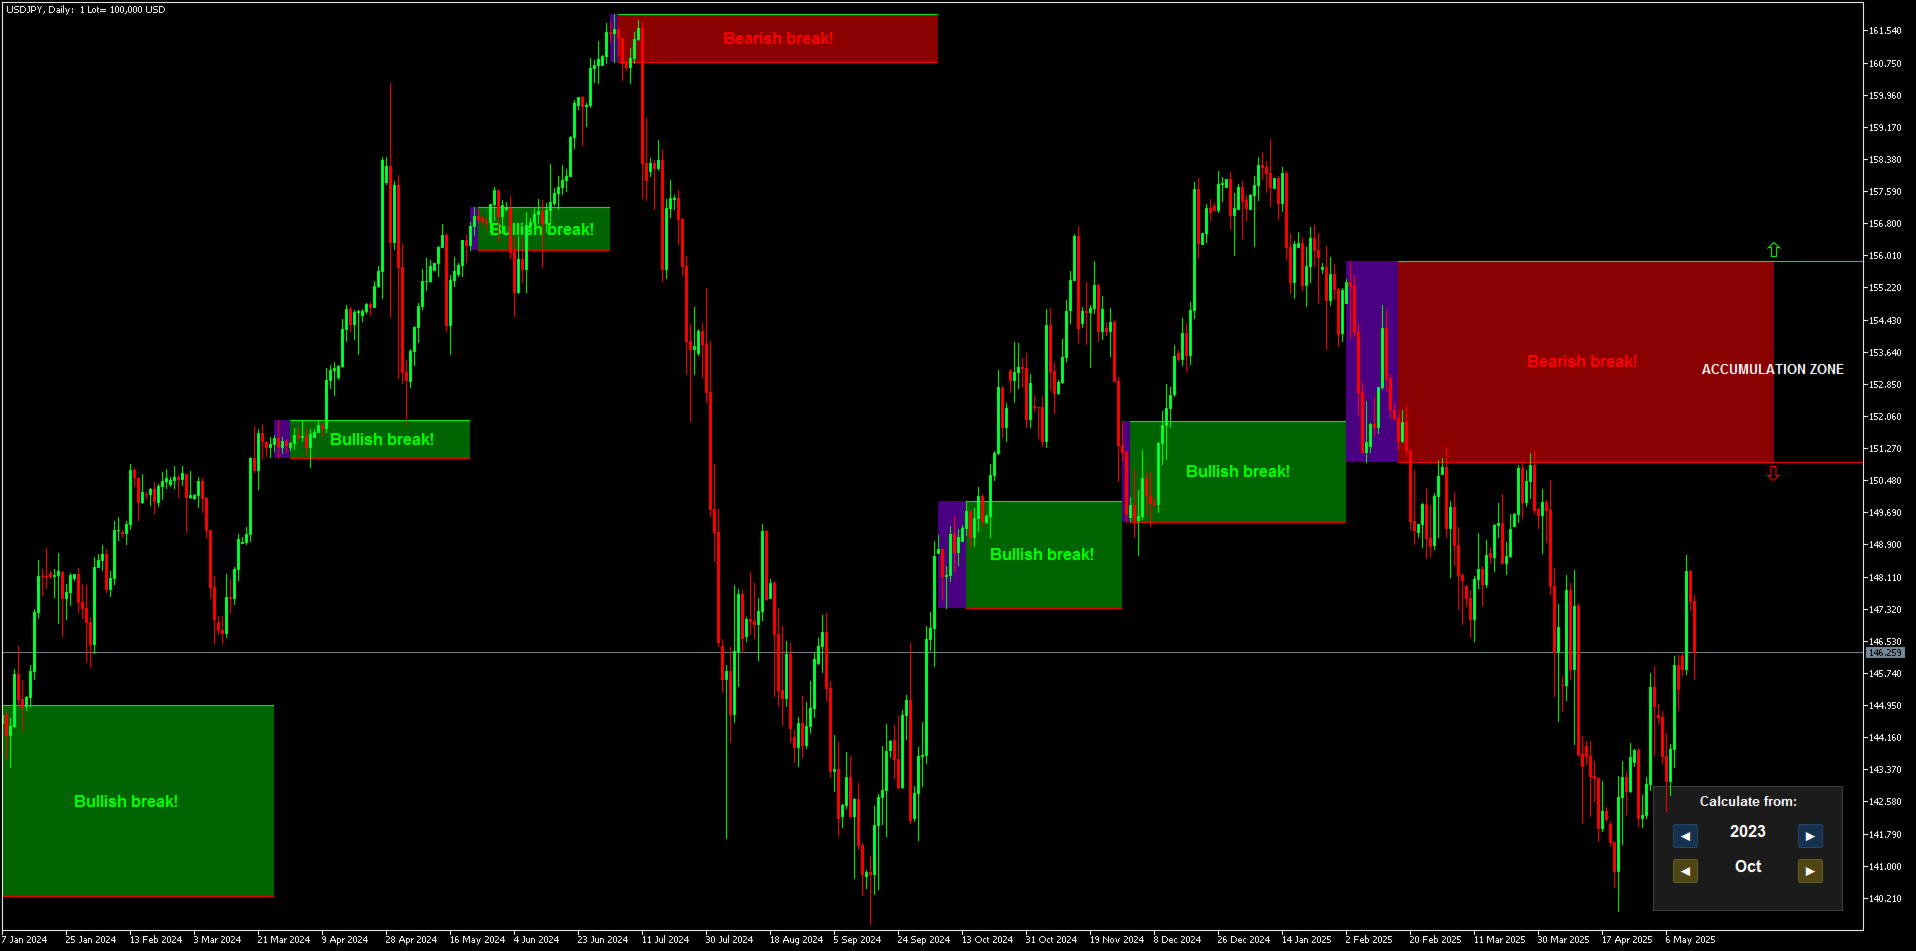
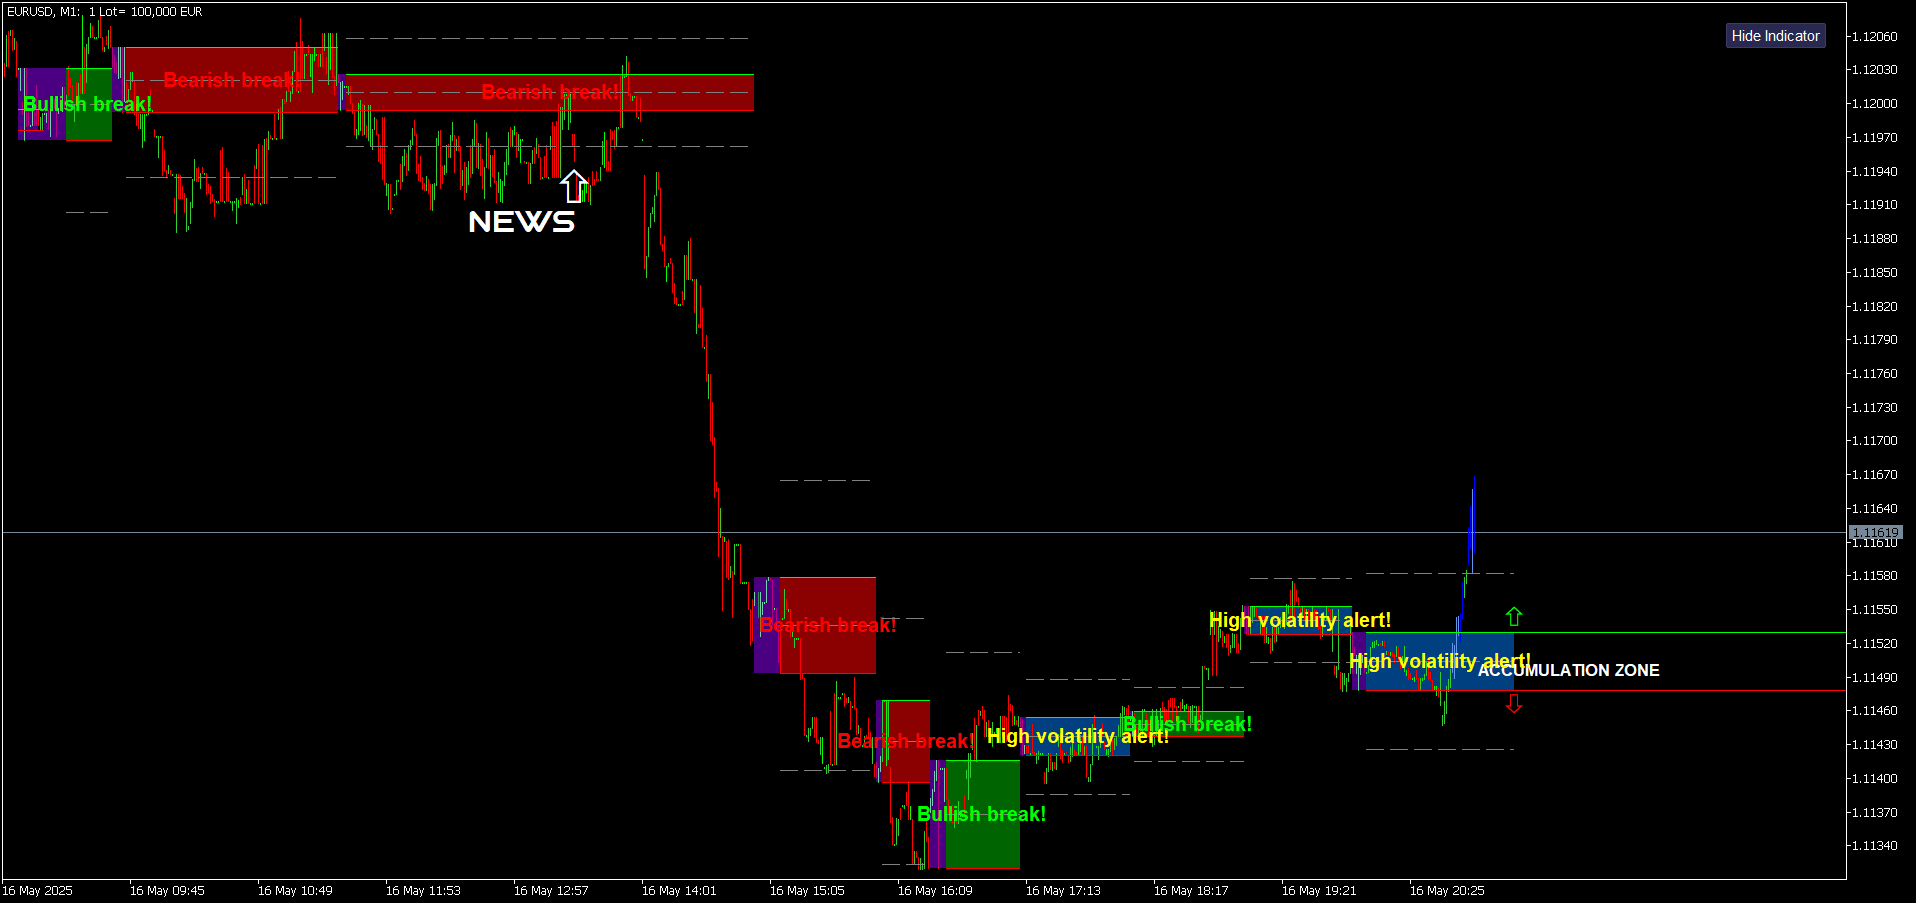
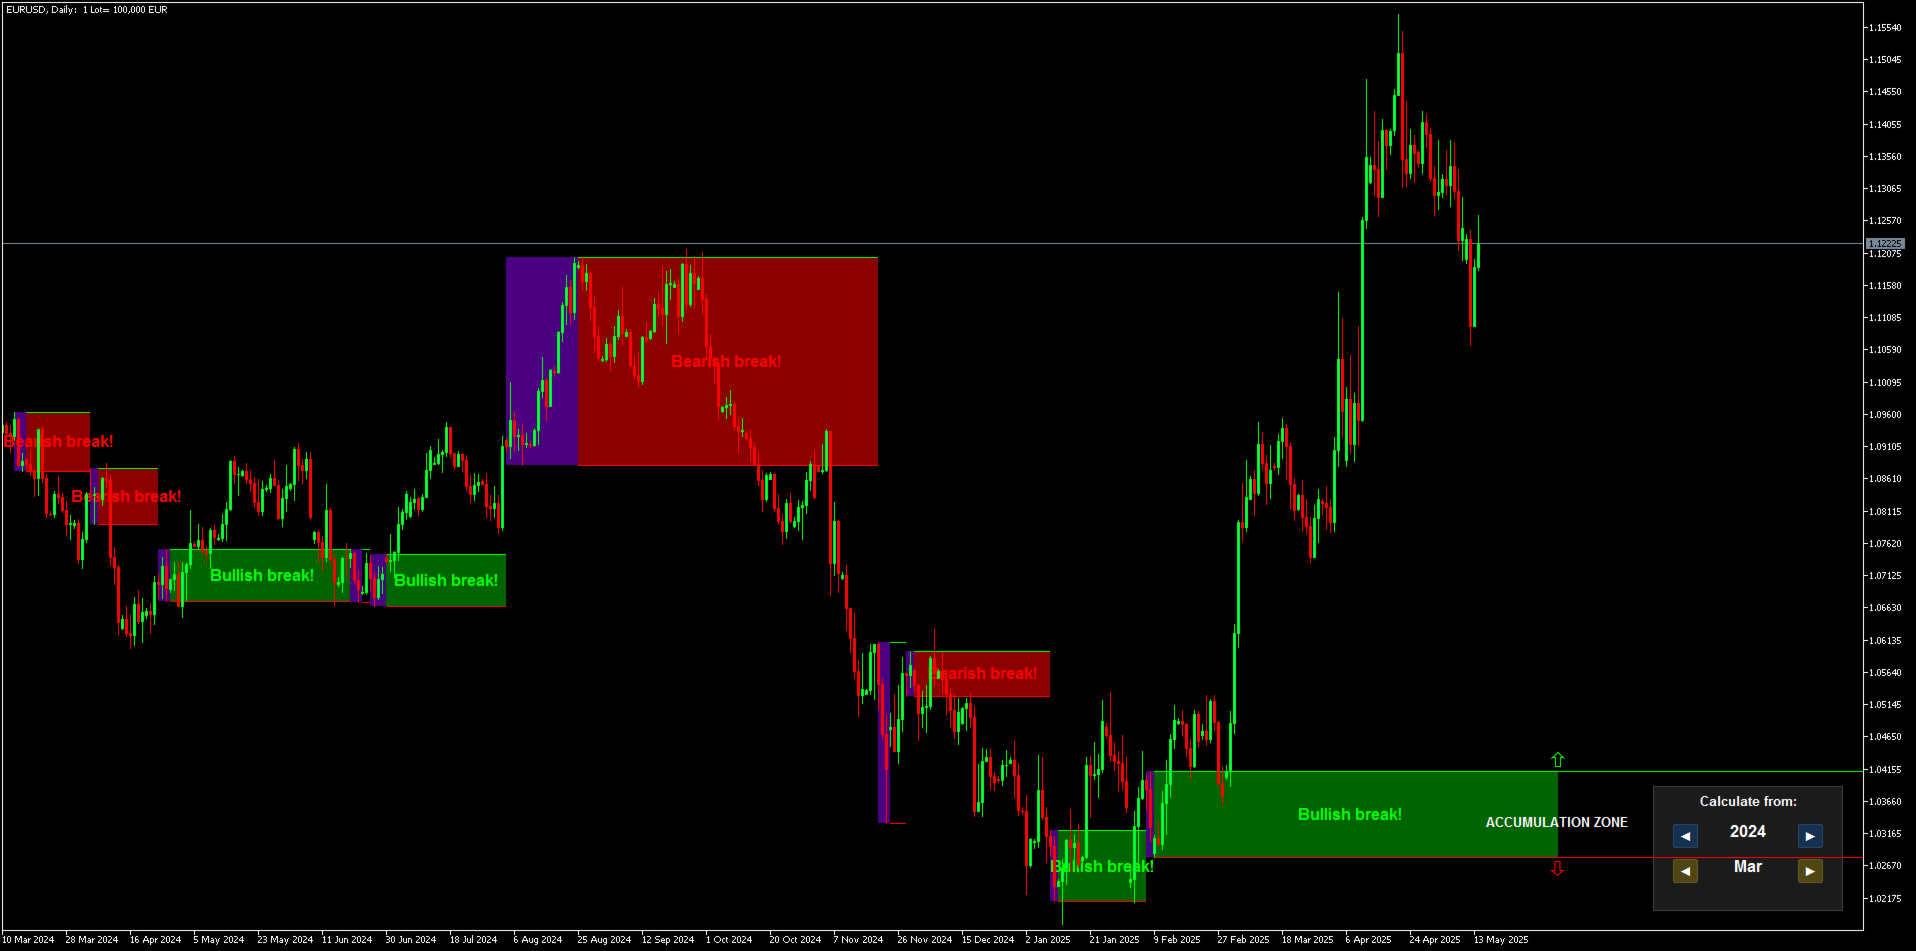
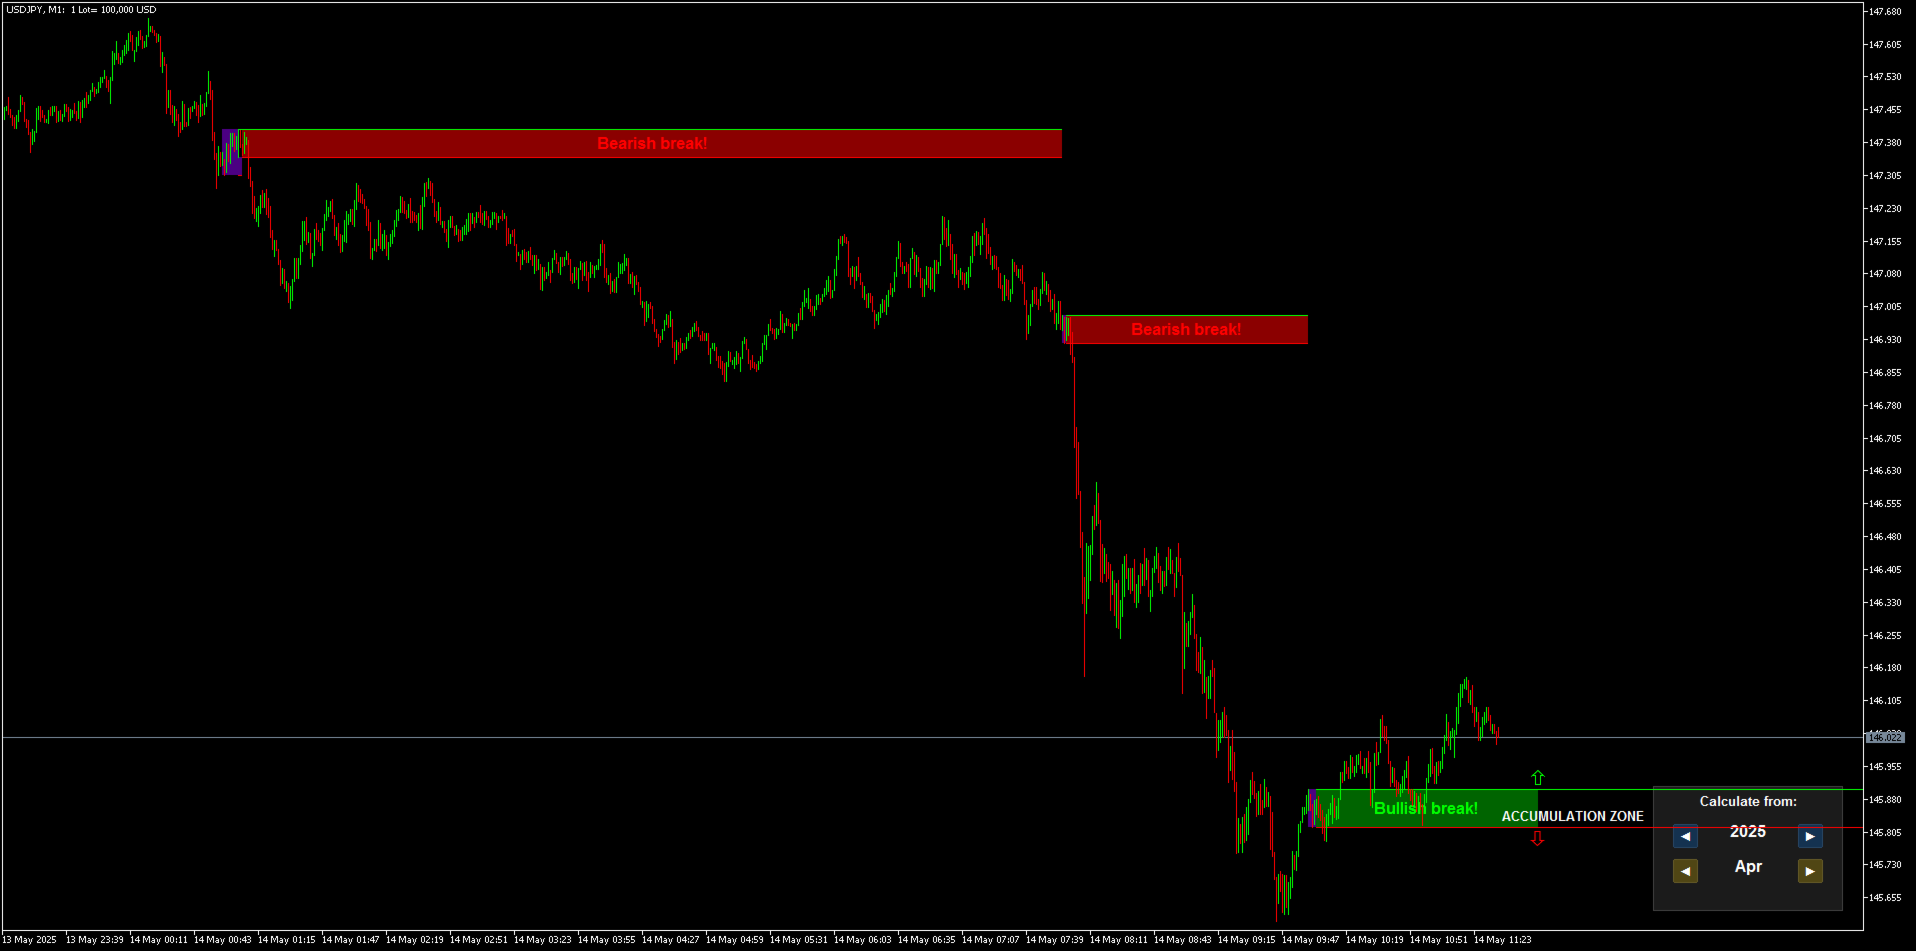
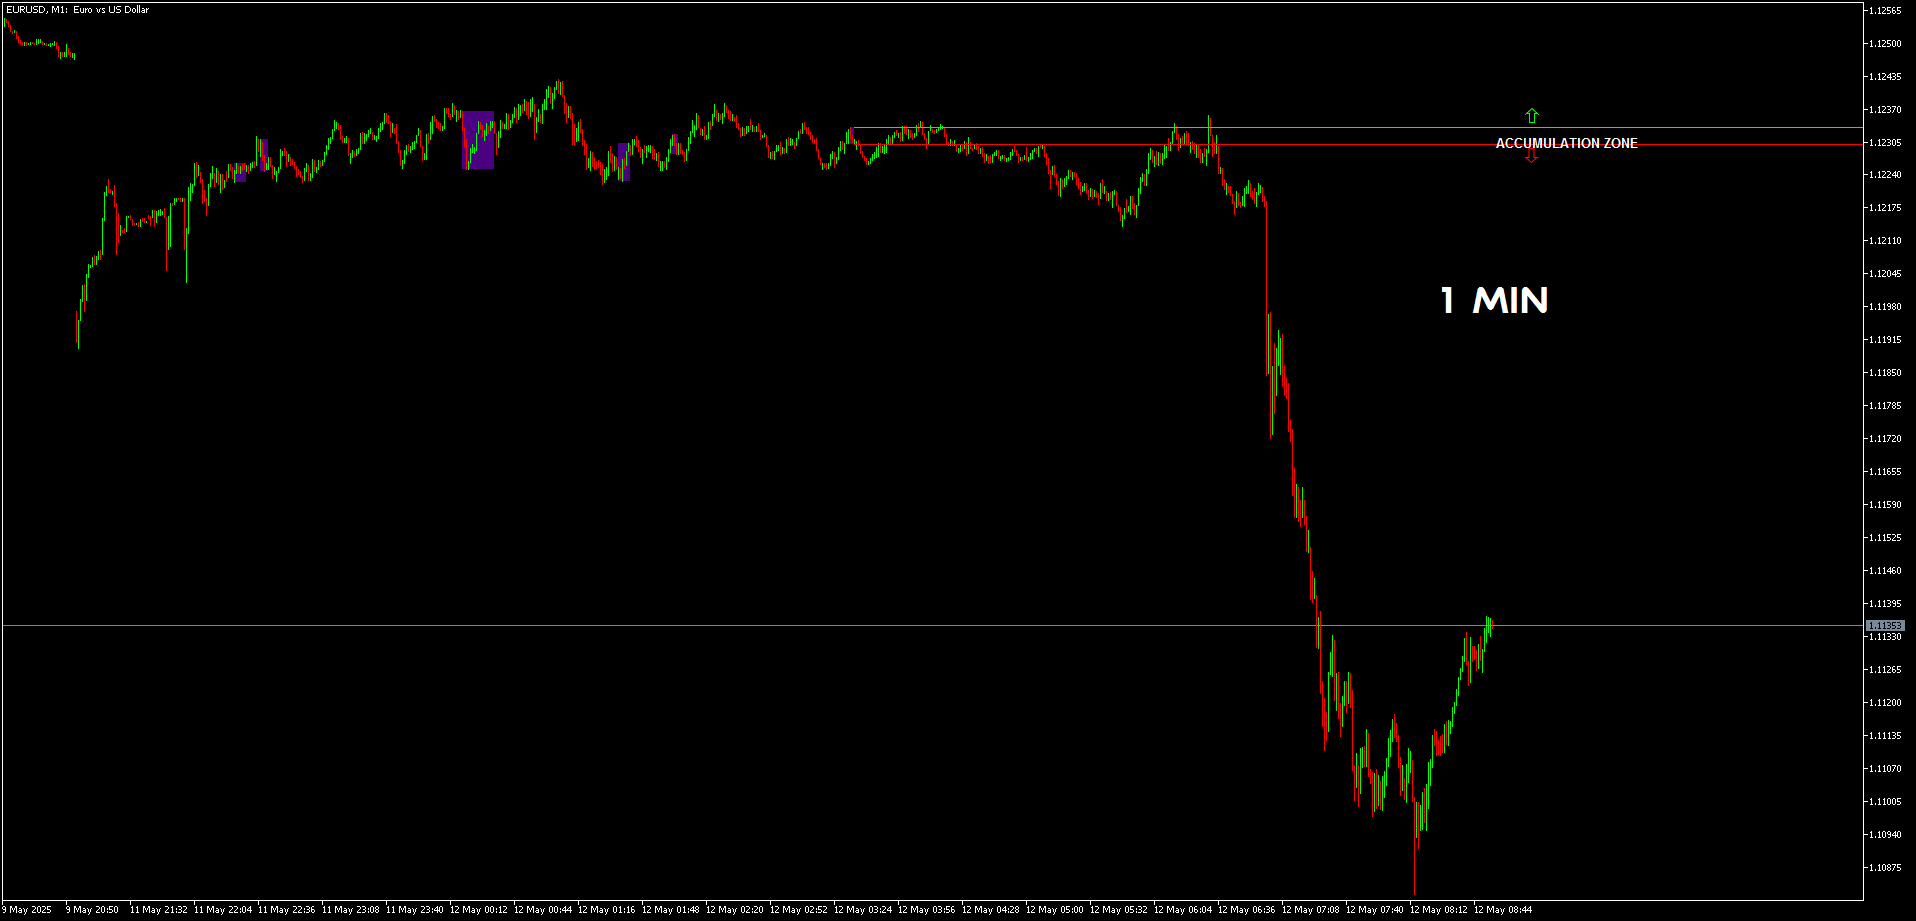
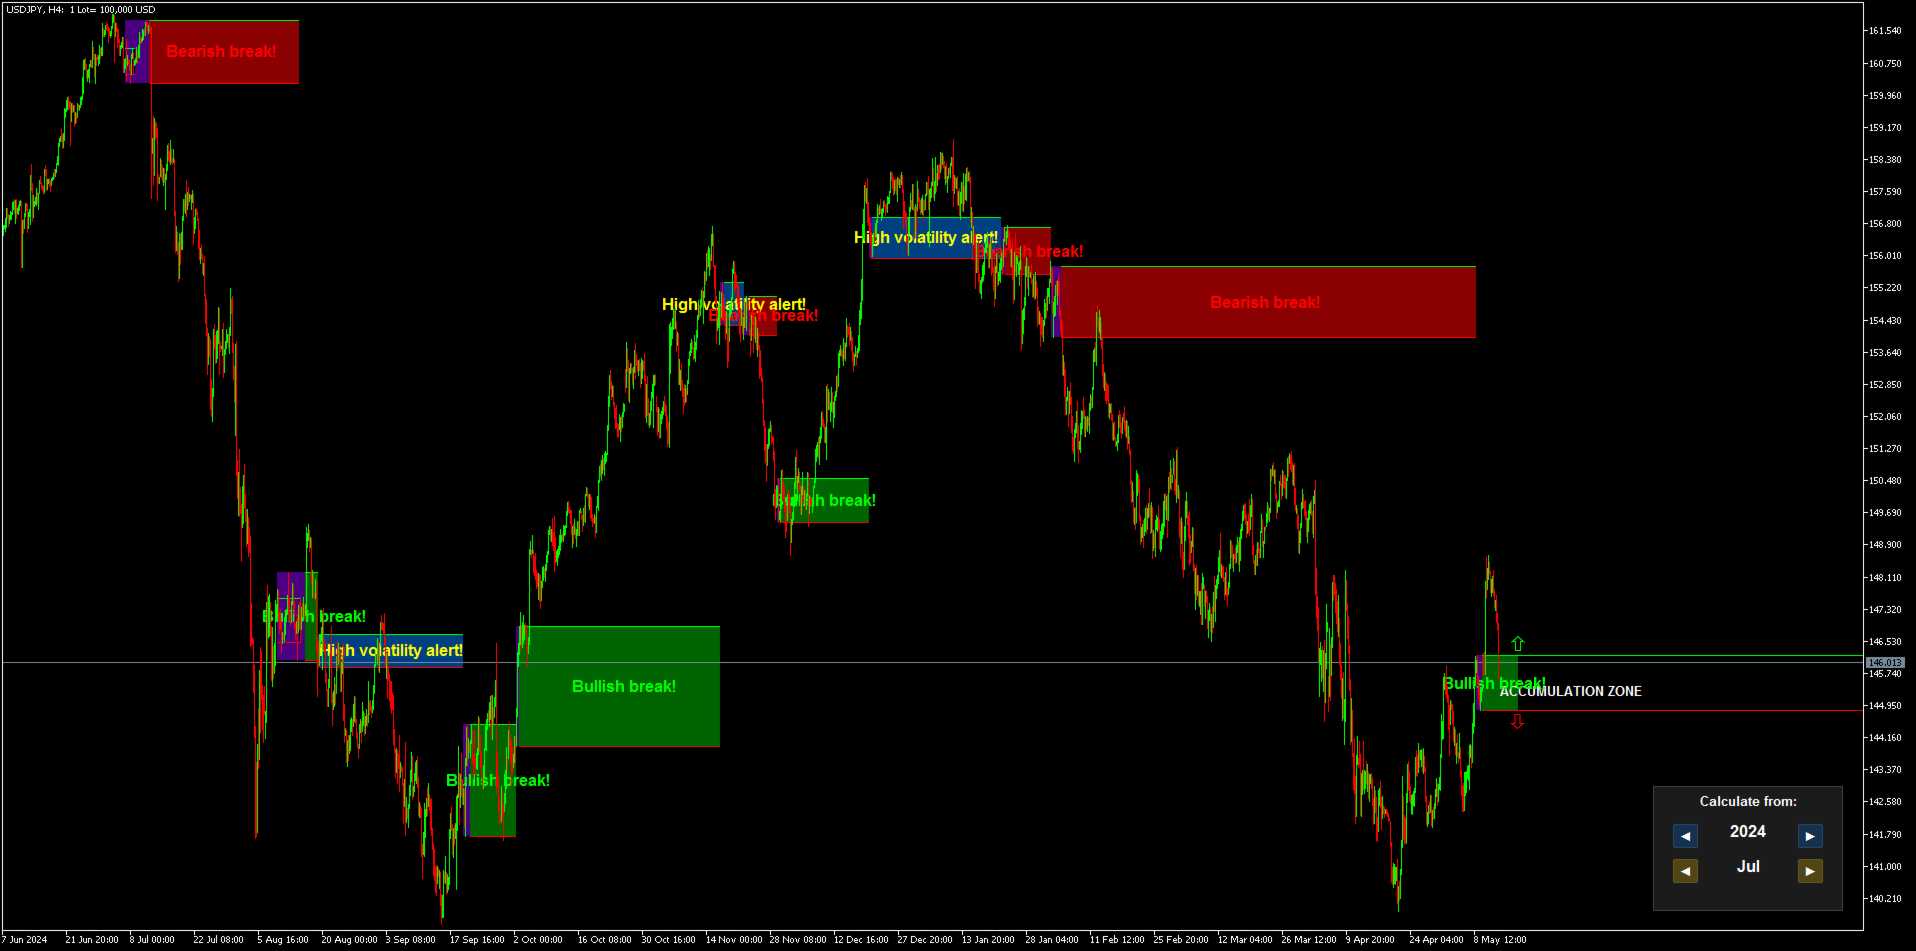
Piyasada belirgin bir ilgi gösterildiğinde, bu bölge mor bir dikdörtgen ile işaretlenir.
Sonrasında emir birikim bölgesi görünür.

  • Eğer piyasa bu bölgenin üzerine çıkarsa, trend yukarı yönlü kabul edilir ve bölge yeşile döner.

  • Eğer piyasa aşağı kırarsa, trend aşağı yönlü olur ve bölge kırmızıya döner.

Bir mum çubuğu, bölge sınırlarına dokunmadan tamamen bölgenin dışında kapanıyorsa, bu gerçek bir kırılma (breakout) olarak değerlendirilir.

Eğer bir mum çubuğu tamamen emir birikim bölgesinin dışında oluşuyorsa, bu piyasa yönünü gösteren net bir kırılma sinyalidir.
Trend, karşı yönde bir kırılma olana kadar ya da yeni bir ilgi bölgesi ortaya çıkana kadar geçerliliğini korur.

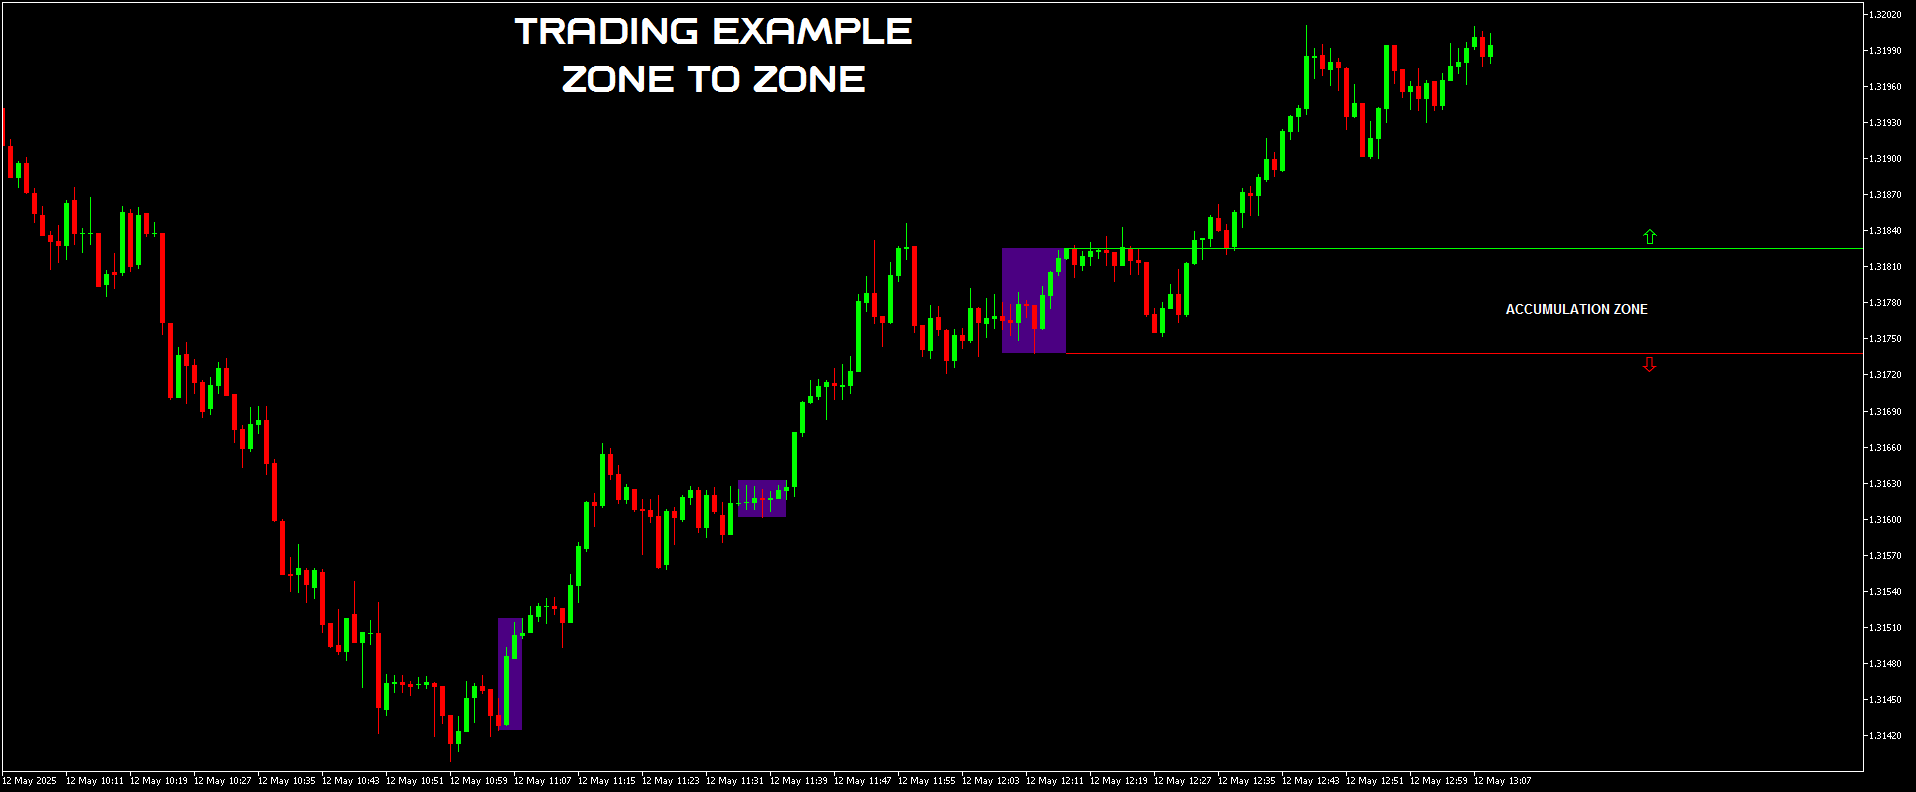
"Bölgeden bölgeye" işlem yapabilirsiniz:

Örnek 1:
Emir birikim bölgesi kırıldığında, piyasa yönünde pozisyon açın.

Örnek 2:
4 saatlik grafikte yukarı yönlü bir kırılma oldu ve piyasa yükseldi. Daha sonra 1 saatlik zaman diliminde yeni bir bölge oluştu.
Pozisyonunuzu kapatabilir ve 1 saatlik bölgeden yeni yön sinyali almayı bekleyebilirsiniz.

Örnek 3:
Bir bölgenin içindeyseniz, bölgenin üstünden satış, altından alış yapabilirsiniz.
Bu bir yatay (range) işlem stratejisidir, ancak daha risklidir.
Göstergenin tersine işlem yapmayın! Asla!

Eğer bir bölge her iki yönden de kırılırsa, yüksek volatilite uyarısı (High Volatility Alert) alırsınız.

Bunlar paranın izleridir.
Ve bunlar çıplak gözle görülemez, çünkü Forex'te yalnızca tick hacmi gözükür ve bu büyük bir yanılgıdır.
İşte bu işlem hızı göstergesi, tick hacmini gerçek piyasa aktivitesine çevirir.

Bu, ileri düzey analizler için tasarlanmış son derece ciddi bir araçtır.

Öneriler:

  • Döviz çiftleri: Sadece yüksek tick hacmine sahip enstrümanlar — EUR/USD, USD/JPY, GBP/USD vb.

  • Zaman dilimleri: Tüm zaman dilimleri uygundur

  • Minimum depozito: Gerekli değil

  • Hesap türü: Sınırlama yok

  • Brokerlar: Sınırlama yok, ancak yüksek hacimli büyük brokerlar önerilir

Saf bilim.


İncelemeler 2
Max2233
520
Max2233 2025.07.08 10:33 
 

I would like to compliment this work of art composed by IVAN, a very precise indicator and in combination with his other jewels created by him, trading has simply become simpler and more intuitive. A round of applause to IVAN.

Mase
1734
Mase 2025.05.29 14:17 
 

Simply perfect! In combination with Ivan's other technical indicators, it is a powerful tool. Warning: highly addictive, as the indicators bring so much joy and success. Highly recommended.

Önerilen ürünler
Trade smarter, not harder: Empower your trading with Harmonacci Patterns This is arguably the most complete harmonic price formation auto-recognition indicator you can find for the MetaTrader Platform. It detects 19 different patterns, takes fibonacci projections as seriously as you do, displays the Potential Reversal Zone (PRZ) and finds suitable stop-loss and take-profit levels. [ Installation Guide | Update Guide | Troubleshooting | FAQ | All Products ] It detects 19 different harmonic pri
Owl Smart Levels MT5
Sergey Ermolov
4.03 (32)
MT4 versiyonu  |  FAQ Owl Smart Levels Indicator , Bill Williams'ın gelişmiş fraktalları , piyasanın doğru dalga yapısını oluşturan Valable ZigZag ve kesin giriş seviyelerini gösteren Fibonacci seviyeleri gibi popüler piyasa analiz araçlarını içeren tek gösterge içinde eksiksiz bir ticaret sistemidir. pazara ve kar elde edilecek yerlere. Stratejinin ayrıntılı açıklaması Gösterge ile çalışma talimatı Baykuş Yardımcısı ticaretinde Danışman Yardımcısı Kullanıcıların özel sohbeti -> Satın aldıktan
Gartley Projections D
Oleksandr Medviediev
3 (2)
The indicator identifies the harmonic patterns (XABCD) according to developments of H.M.Gartley ( "Profits in the Stock Market" , 1935г). It projects D-point as a point in the perspective projection (specify ProjectionD_Mode = true in the settings). Does not redraw. When a bar of the working timeframe closes, if the identified pattern point has not moved during Patterns_Fractal_Bars bars, an arrow appears on the chart (in the direction of the expected price movement). From this moment on, the ar
Overview Harmonic Patterns MT5 is a technical analysis indicator designed for the MetaTrader 5 platform. It identifies and displays harmonic price patterns, such as Butterfly, Cypher, Crab, Bat, Shark, and Gartley, in both bullish and bearish directions. The indicator calculates key price levels, including entry, stop loss, and three take-profit levels, to assist traders in analyzing market movements. Visual elements and customizable alerts enhance usability on the chart. Features Detects six ha
Matreshka
Dimitr Trifonov
5 (2)
Matreshka self-testing and self-optimizing indicator: 1. Is an interpretation of the Elliott Wave Analysis Theory. 2. Based on the principle of the indicator type ZigZag, and the waves are based on the principle of interpretation of the theory of DeMark. 3. Filters waves in length and height. 4. Draws up to six levels of ZigZag at the same time, tracking waves of different orders. 5. Marks Pulsed and Recoil Waves. 6. Draws arrows to open positions 7. Draws three channels. 8. Notes support and re
MercariaPattern1-2-3 відстежує рух ціни, знаходить трьоххвильові структури 1-2-3 та підсвічує момент, коли сценарій підтверджується пробоєм ключового рівня. MercariaPattern1-2-3 tracks price movement, detects three-leg 1-2-3 structures and highlights the moment when the scenario is confirmed by a key level breakout. Індикатор збирає локальні свінги в компактну фігуру 0–1–2–3 , чекає підтвердженого пробою та будує стрілку входу з готовими рівнями SL/TP. The indicator combines local swings into a
The RSI Divergence + FVG Signal indicator combines Relative Strength Index (RSI) Divergence with Fair Value Gap (FVG) detection to generate high-probability buy and sell signals based on both momentum shifts and institutional imbalance zones. Core Features: RSI Divergence Detection : Identifies both regular and hidden bullish/bearish divergences between price and RSI. Divergences indicate potential trend reversals or continuation. FVG Zone Recognition : Detects Fair Value Gaps (imbalances caused
Noize Absorption Index - is the manual trading system that measures the difference of pressure between bears forces and bulls forces. Green line - is a noize free index that showing curent situation. Zero value of index shows totally choppy/flat market.Values above zero level shows how powerfull bullish wave is and values below zero measures bearish forces.Up arrow appears on bearish market when it's ready to reverse, dn arrow appears on weak bullish market, as a result of reverse expectation.
Premium seviye, %80'den fazla doğru tahmin doğruluğuna sahip benzersiz bir göstergedir! Bu gösterge en iyi Ticaret Uzmanları tarafından iki aydan uzun süredir test edilmiştir! Yazarın göstergesini başka hiçbir yerde bulamazsınız! Ekran görüntülerinden bu aracın doğruluğunu kendiniz görebilirsiniz! 1, sona erme süresi 1 mum olan ikili opsiyon ticareti için harikadır. 2 tüm döviz çiftleri, hisse senetleri, emtialar, kripto para birimleri üzerinde çalışır Talimatlar: Kırmızı ok göründüğü an
ATrend
Zaha Feiz
4.82 (17)
ATREND: Nasıl Çalışır ve Nasıl Kullanılır ### Nasıl Çalışır "**ATREND**" göstergesi, MT5 platformu için tasarlanmış olup, traderlara sağlam alım ve satım sinyalleri sağlamak amacıyla teknik analiz metodolojilerinin bir kombinasyonunu kullanır. Bu gösterge, öncelikle volatilite ölçümü için Ortalama Gerçek Aralık (ATR) kullanır ve potansiyel piyasa hareketlerini belirlemek için trend tespit algoritmalarıyla birleştirir. Satın aldıktan sonra bir mesaj bırakın ve özel bir bonus hediyesi kazanın. ##
The indicator detects and displays М. Gartley's Butterfly pattern. The pattern is plotted by the extreme values of the ZigZag indicator (included in the resources, no need to install). After detecting the pattern, the indicator notifies of that by the pop-up window, a mobile notification and an email. The pattern and wave parameters are displayed on the screenshots. The default parameters are used for demonstration purposes only in order to increase the amount of detected patterns. Parameters z
Manyal trading system, CovEchoTrend Robot, focuses on reliability and flexibility. By employing statistical analysis methods to study the relationships between the base indicator and market patterns, the system enables a deeper understanding of market processes. Intelligent pattern analysis: The application of statistical data processing helps identify key trend reversal points more accurately, signaling significant market shifts. Informed decision-making is based on the intersection of indicato
L'indicatore SMC Venom Model BPR è uno strumento professionale per i trader che operano nell'ambito del concetto di Smart Money (SMC). Identifica automaticamente due modelli chiave sul grafico dei prezzi: FVG   (Fair Value Gap) è una combinazione di tre candele, in cui c'è un gap tra la prima e la terza candela. Forma una zona tra livelli in cui non c'è supporto di volume, il che spesso porta a una correzione dei prezzi. BPR   (Balanced Price Range) è una combinazione di due modelli FVG che for
STRICTLY FOR BOOM INDEX ONLY!!!!! Here I bring the Maximum Trend Arrows OT1.0 MT5 indicator. This indicator is made up of a combination of different trend indicators for entries and exits, for entries an orange arrow will paint on the chart below the current market and a red flag for closing of trades and it produces buy arrows only. When the orange arrow appears, it will appear along with it's sound to notify you. The 1H timeframe is recommended, don't use it anywhere else than on the 1H timefr
PR EA - Engulfing Pattern Trading System Automated Engulfing Pattern Detection with MA Confirmation The PR EA is a Meta Trader 5 expert advisor that identifies and trades bullish/bearish engulfing candlestick patterns when confirmed by a moving average filter. Designed for swing trading on 30-minute charts with compatibility for M15 and H1 time frames. Key Features: Pattern Recognition - Detects valid bullish/bearish engulfing candle formations Trend Confirmation - 238-period SMA filter
# DRAWDOWN INDICATOR V4.0 - The Essential Tool to Master Your Trading ## Transform Your Trading with a Complete Real-Time Performance Overview In the demanding world of Forex and CFD trading, **knowing your real-time performance** isn't a luxury—it's an **absolute necessity**. The **Drawdown Indicator V4.0** is much more than a simple indicator: it's your **professional dashboard** that gives you a clear, precise, and instant view of your trading account status. --- ## Why This Indicator
The   Fibonacci Confluence Toolkit   is a technical analysis tool designed to help traders identify potential price reversal zones by combining key market signals and patterns. It highlights areas of interest where significant price action or reactions are anticipated, automatically applies Fibonacci retracement levels to outline potential pullback zones, and detects engulfing candle patterns. Its unique strength lies in its reliance solely on price patterns, eliminating the need for user-define
##   ONLY GOLD ##   Тiльки Золото ## **Mercaria Professional Trading Zones - Complete Guide** ## **Mercaria Professional Trading Zones - Повний посібник** ### **How Mercaria Zones Work / Як працюють зони Mercaria** **English:** Mercaria Zones is an advanced trading indicator that identifies high-probability support and resistance areas using ZigZag extremes combined with mathematical zone calculations. The indicator works on multiple timeframes simultaneously, providing a comprehensive view
Time And Sales Delta
Evgeny Shevtsov
5 (2)
The indicator displays the delta and the cumulative delta based on the "Time & Sales" deals list data. In addition to the standard timeframes, the indicator displays data regarding the seconds timeframes (S5, S10, S15, S20, S30) to choose from. Using the rectangle, user can select an arbitrary area in the indicator subwindow to view the ratio of the volumes of deals of buyers and sellers within this area. Indicator features: The indicator works correctly only on those trading symbols for which
Öncelikle, bu Ticaret Aracının Non-Repainting, Non-Redrawing ve Non-Lagging Gösterge olduğunu vurgulamakta fayda var, bu da onu profesyonel ticaret için ideal hale getiriyor. Çevrimiçi kurs, kullanıcı kılavuzu ve demo. Akıllı Fiyat Hareketi Kavramları Göstergesi, hem yeni hem de deneyimli tüccarlar için çok güçlü bir araçtır. İleri ticaret fikirlerini, Inner Circle Trader Analizi ve Smart Money Concepts Ticaret Stratejileri gibi 20'den fazla kullanışlı göstergeyi bir araya getirerek bir araya
Universal Soul Reaper
Pieter Gerhardus Van Zyl
Universal Soul Reaper is an atmospheric market-flow oscillator designed to interpret price behavior as a cycle of spiritual energy. Instead of reacting to raw price alone, it visualizes the state of the market’s soul —revealing when momentum is awakening, stabilizing, or fading. The indicator operates in a separate window and presents three interwoven entities: the Ectoplasmic Veil , the Spirit Boundary , and the Soul Core . Together, they form a living framework that helps traders sense pressu
ENGLISH DESCRIPTION (MQL5 Standard Optimized) Product Name: Obsidian Forest Automaton AI (MT5) [Subtitle: Forest Structure | Obsidian Blade TEMA | Shield Safety] Introduction Obsidian Forest Automaton AI is a structural trend-following construct designed to navigate the market with the cold precision of an automaton. It builds a "Forest Structure" using Ichimoku Cloud , cuts through noise with the Obsidian Blade (TEMA) , and validates density with Standard Deviation . This creates a system that
Terra Infinity is a flat indicator. This improved version of the CalcFlat indicator has three additional lines that significantly increase its effectiveness. Unlike its predecessor with two static levels, Terra Infinity adds three dynamic lines above the main histogram, which are interpreted as follows: base signal line, minimum signal line, maximum signal line. These lines are formed using the additional parameter Avg, which is the average value of the histogram. Averaging produces a line cl
The  SuperTrend Advance Trading  is a widely-used technical indicator based on  SuperTrend Strategy + Price Action + EMA . How it works: -  Buy/Sell Signals  can be generated when the trend reverses, the conditions of Price action, TrendLine and EMA are met. - After the  Signal  appears, be patient and wait until the candle closes, at that time place the order as soon as possible. You may have time to review your entry, consider whether it is a good entry or not. - Carefully review the entry, up
Gioteen Volatility Index (GVI) - your ultimate solution to overcoming market unpredictability and maximizing trading opportunities. This revolutionary indicator helps you in lowering your losing trades due to choppy market movements. The GVI is designed to measure market volatility, providing you with valuable insights to identify the most favorable trading prospects. Its intuitive interface consists of a dynamic red line representing the volatility index, accompanied by blue line that indicate
Double HMA MTF for MT5
Pavel Zamoshnikov
4 (4)
This is an advanced multi-timeframe version of the popular Hull Moving Average (HMA) Features Two lines of the Hull indicator of different timeframes on the same chart. The HMA line of the higher timeframe defines the trend, and the HMA line of the current timeframe defines the short-term price movements. A graphical panel with HMA indicator data from all timeframes at the same time . If the HMA switched its direction on any timeframe, the panel displays a question or exclamation mark with a tex
Engulfing with EMAs Indicator Unlock the power of advanced candlestick pattern detection with the Engulfing with EMAs Indicator , a cutting-edge tool designed for MetaTrader 5. This futuristic indicator combines the precision of engulfing pattern analysis with the trend-following strength of Exponential Moving Averages (EMA 21 and EMA 50), empowering traders to identify high-probability setups across all currency pairs and timeframes. Key Features: Comprehensive Engulfing Detection : Detects b
Ultimate Boom and Crash Indicator The Ultimate Boom and Crash Indicator is a cutting-edge tool developed by  Coetsee Digital , designed to identify potential spike opportunities in the market. Crafted for traders focusing on Deriv and Weltrade synthetic markets, this indicator is optimized to operate exclusively on the 3-minute (M3), 5-minute (M5), 15-minute (M15), 30-minute (M30), and 1-hour (H1) timeframes and supports only the following pairs: PainX 1200, PainX 999, PainX 800, PainX 600, Pai
Auto Optimized RSI , doğru alım ve satım sinyalleri vermek için tasarlanmış, kullanımı kolay ve akıllı bir ok göstergesidir. Geçmiş verilere dayalı işlem simülasyonları kullanarak, her enstrüman ve zaman dilimi için en etkili RSI seviyelerini otomatik olarak belirler. Bu gösterge, bağımsız bir işlem sistemi olarak veya mevcut stratejinize entegre edilerek kullanılabilir ve özellikle kısa vadeli işlem yapanlar için faydalıdır. Geleneksel RSI’nin sabit seviyeleri (örneğin 70/30) yerine,   Auto Opt
Introduction to the Manual Backtesting Indicator on MQL5 The MetaTrader platform provides an excellent backtesting tool for evaluating Expert Advisors (EAs). However, when it comes to manually backtesting a strategy to assess its effectiveness, this tool has some limitations: You cannot manually draw zones or trend lines while in backtesting mode. You cannot switch timeframes to check time alignment. For example, if my strategy requires additional confirmation from a higher timeframe (HTF), this
Bu ürünün alıcıları ayrıca şunları da satın alıyor
ARIPoint
Temirlan Kdyrkhan
1 (1)
ARIPoint is a powerful trading companion designed to generate high-probability entry signals with dynamic TP/SL/DP levels based on volatility. Built-in performance tracking shows win/loss stats, PP1/PP2 hits, and success rates all updated live. Key Features: Buy/Sell signals with adaptive volatility bands Real-time TP/SL/DP levels based on ATR Built-in MA Filter with optional ATR/StdDev volatility Performance stats panel (Success, Profit/Loss, PP1/PP2) Alerts via popup, sound, push, or email Cu
TrendMaestro5
Stefano Frisetti
note: this indicator is for METATRADER4, if you want the version for METATRADER5 this is the link:  https://www.mql5.com/it/market/product/108106 TRENDMAESTRO ver 2.5 TRENDMAESTRO recognizes a new TREND from the start, he never makes mistakes. The certainty of identifying a new TREND is priceless. DESCRIPTION TRENDMAESTRO identifies a new TREND in the bud, this indicator examines the volatility, volumes and momentum to identify the moment in which there is an explosion of one or more of these da
ARICoins
Temirlan Kdyrkhan
ARICoin is a powerful trading companion designed to generate high-probability entry signals with dynamic TP/SL/DP levels based on volatility. Built-in performance tracking shows win/loss stats, PP1/PP2 hits, and success rates all updated live. Key Features: Buy/Sell signals with adaptive volatility bands Real-time TP/SL/DP levels based on ATR Built-in MA Filter with optional ATR/StdDev volatility Performance stats panel (Success, Profit/Loss, PP1/PP2) Alerts via popup, sound, push, or email Cust
AriX
Temirlan Kdyrkhan
1 (4)
AriX Indicator for MT5 A powerful trend-following and signal-evaluation tool AriX is a custom MT5 indicator that combines Moving Averages and ATR-based risk/reward logic to generate clear buy/sell signals. It visualizes dynamic SL/TP levels, evaluates past trade outcomes, and displays win/loss statistics in a clean on-chart panel. Key features include: Buy/Sell signals based on MA crossovers ATR-based SL/TP1/TP2/TP3 levels with visual lines and labels Signal outcome tracking with real-time stat
IVISTscalp5
Vadym Zhukovskyi
5 (6)
What's new about iVISTscalp5 forecast indicator (Version 10)? iVISTscalp5 is a unique nonlinear forecasting for a week ahead system for any financial instrument which executes fast scalping using time levels. iVISTscalp5 is a tool for easy study and understanding of financial market. 1) iVISTscalp5 forecast indicator has been completely rewritten into another programming language (C++), which has accelerated data loading and processing. As a result, a different graphical display of forecasts
Big Player Range
Thalles Nascimento De Carvalho
5 (3)
BigPlayerRange – MT5 için En İyi Gösterge BigPlayerRange , MetaTrader 5 üzerinde Mini Endeks ve Mini Dolar için en iyi gösterge olarak kabul edilir. Bu güçlü araç, büyük oyuncuların stratejik faaliyet alanlarını vurgulayarak kurumsal teknik analizde yüksek hassasiyet sunar. BigPlayerRange Nasıl Kullanılır: Gösterge, alış bölgelerini (yeşil çizgi) ve satış bölgelerini (kırmızı çizgi) gösterir. Fiyat bu alanların dışına kapandığında trend oluşma olasılığı yüksektir. Yeşil çizginin üzerinde
Rtc ML Ai Predictor
Muhammad Faisal Sagala
Rtc ML Ai | Predictor CORE MACHINE LEARNING ENGINE Adaptive ML Market Predictor – Multi-Bar Trend & Candle Forecast What This Indicator Does This indicator is a  real-time market prediction engine  designed to analyze price behavior and estimate  future market tendencies . Unlike conventional indicators, this system  does not rely on static parameters or historical curve-fitting , but adapts its internal state dynamically during live market operation. Instead of using static rules, the indic
FXLAND Smart Reversal Indicator (MT5) FXLAND Smart Reversal Indicator is a professional technical analysis tool designed to help traders identify potential price reversal zones and key market turning points with clarity and precision. The best reversal indicator and price return by choosing only one ceiling or floor in each time frame A masterpiece of combining mathematics and Gann, fractal matrix, Fibonacci, movement angle and time. Completely intelligent Key Features Detects potenti
Pantera Indicator
Temirlan Kdyrkhan
5 (1)
A tool for on-chart strategy backtesting and performance analysis. A utility for developing, debugging, and testing custom trading ideas and indicator functions. An indicator designed to quickly test trading concepts and visualize the effectiveness of different input parameters. An all-in-one sandbox for testing everything from simple crossovers to complex, multi-condition trading systems.
VTrende Pro
Andrii Diachenko
5 (1)
VTrende Pro - MTF indicator for trend trading with a display panel for MT5 *** Videos can be translated into any language using subtitles (video language - Russian) Although the signals of the VTrende Pro indicator can be used as signals of a full-fledged trading system, it is recommended to use them in conjunction with the Bill Williams TS. VTrende Pro is an extended version of the VTrende indicator. Difference between Pro version and VTrende: - Time zones - Signal V - signal 1-2 waves -    S
WARNING: This indicator is distributed EXCLUSIVELY on MQL5.com MT4 version:   https://www.mql5.com/it/market/product/160363 MT5 version:   https://www.mql5.com/it/market/product/160410 ============================================================================================= MAX RIBBON ver 1.00 The indicator that shows you the TREND clearly and unambiguously! ============================================================================================= DESCRIPTION MAX RIBBON is an advanced tre
+++++++++++++++++++++++++++++++++++++++++++++++++++++++++++++++++++++++++++++++++++++++++++++++++ +++ Link to EURUSD Only Free Version -->  https://www.mql5.com/en/market/product/156904?source=Unknown +++++++++++++++++++++++++++++++++++++++++++++++++++++++++++++++++++++++++++++++++++++++++++++++++ Hallo Trader, This is a traditional GANN & FIBONACCI strategy based on detection of an impulsive move in the opposite direction. This is called a Breakout. At the moment of Breakout, the indicator draw
WanaScalper
Isaac Wanasolo
1 (1)
A scalping indicator based on mathematical patterns, which on average gives signals with relatively small SL, and also occasionally helps to catch big moves in the markets (more information in the video) This indicator has three main types of notifications: The first type warns of a possible/upcoming signal on the next bar The second type indicates the presence of a ready signal to enter the market/open a position The third type is for SL and TP levels - you will be notified every time price re
MATADOR GOLD – XAUUSD MT5 M5 Timeframe Scalp Signals MATADOR GOLD is a professional signal indicator designed for XAUUSD (Gold) scalping on the M5 timeframe , with optional higher-timeframe confirmation. This indicator does not open or manage trades automatically . It provides structured buy and sell signals, intelligent filtering, and alerts, allowing traders to execute trades using their own strategy and risk management rules. Core Concept (Multi-Concept Architecture) MATADOR GOLD is built
Frontier Pivots
Nestor Jose Mendez Boza
FRONTIER PIVOTS - Geometric Levels Indicator This indicator plots support and resistance levels/ranges on the chart using mathematical calculations. It helps traders identify potential price reaction zones based on geometric patterns. Main Features: Automatically calculates and displays key price levels Plots both support and resistance lines Uses daily price data for level calculation Clean visual presentation with different colors for different level types No repainting - levels remain static
CGE Trading Suite
Carl Gustav Johan Ekstrom
5 (1)
CGE Trading Suite is a market analysis system designed to eliminate guesswork from trading. It continuously adapts to real-time price behavior, helping traders stay aligned with key market levels and evolving market conditions. This comprehensive system integrates multiple analytical tools into a single workflow, including dynamic grid mapping, liquidity behavior analysis, ECM, trend lines, MIDAS, trade cycles, and directional channel projections. Together, these tools provide a clear picture of
Enigma 112
issam rahhal sabour
Enigma 112 Indicator - User Manual Enigma 112 Indicator Complete User Manual - Ultimate Trading Solution Introduction The Enigma 112 is a comprehensive multi-timeframe trading indicator that combines advanced technical analysis concepts including Tesla 3-6-9 Gates, Huddleston Theory, PO3 Dealing Ranges, and sophisticated risk management systems. Tesla 3-6-9 Gates Based on Nikola Tesla's vortex mathematics for precise support and resistance levels Huddleston Theory Volume-based market
The Expert Advisor and the video are attached in the Discussion tab . The robot applies only one order and strictly follows the signals to evaluate the indicator efficiency. Pan PrizMA CD Phase is an option based on the Pan PrizMA indicator. Details (in Russian). Averaging by a quadric-quartic polynomial increases the smoothness of lines, adds momentum and rhythm. Extrapolation by the sinusoid function near a constant allows adjusting the delay or lead of signals. The value of the phase - wave s
Классификатор силы тренда. Показания на истории не меняет. Изменяется классификация только незакрытого бара. По идее подобен полной системе ASCTrend, сигнальный модуль которой, точнее его аппроксимация в несколько "урезанном" виде, есть в свободном доступе, а также в терминале как сигнальный индикатор SilverTrend . Точной копией системы ASCTrend не является. Работает на всех инструментах и всех временных диапазонах. Индикатор использует несколько некоррелируемых между собой алгоритмов для класси
FFx Universal Strength Meter PRO is more than a basic strength meter. Instead of limiting the calculation to price, it can be based on any of the 19 integrated strength modes + 9 timeframes. With the FFx USM, you are able to define any period for any combination of timeframes. For example, you can set the dashboard for the last 10 candles for M15-H1-H4… Full flexibility! Very easy to interpret... It gives a great idea about which currency is weak and which is strong, so you can find the best pai
The FFx Universal MTF alerter shows on a single chart all the timeframes (M1 to Monthly) with their own status for the chosen indicator. 9 indicators mode (MACD-RSI-Stochastic-MA-ADX-Ichimoku-Candles-CCI-PSAR). Each can be applied multiple times on the same chart with different settings. Very easy to interpret. Confirm your BUY entries when most of the timeframes are showing green color. And confirm your SELL entries when most of the timeframes are showing red color. 2 Alert Options : input to s
The FFx Watcher PRO is a dashboard displaying on a single chart the current direction of up to 15 standard indicators and up to 21 timeframes. It has 2 different modes: Watcher mode: Multi Indicators User is able to select up to 15 indicators to be displayed User is able to select up to 21 timeframes to be displayed Watcher mode: Multi Pairs User is able to select any number of pairs/symbols User is able to select up to 21 timeframes to be displayed This mode uses one of the standard indicators
FFx Patterns Alerter gives trade suggestions with Entry, Target 1, Target 2 and StopLoss .... for any of the selected patterns (PinBar, Engulfing, InsideBar, OutsideBar) Below are the different options available: Multiple instances can be applied on the same chart to monitor different patterns Entry suggestion - pips to be added over the break for the entry 3 different options to calculate the SL - by pips, by ATR multiplier or at the pattern High/Low 3 different options to calculate the 2 TPs -
MetaTrader 4 version available here : https://www.mql5.com/en/market/product/24881 FFx Basket Scanner is a global tool scanning all pairs and all timeframes over up to five indicators among the 16 available. You will clearly see which currencies to avoid trading and which ones to focus on. Once a currency goes into an extreme zone (e.g. 20/80%), you can trade the whole basket with great confidence. Another way to use it is to look at two currencies (weak vs strong) to find the best single pairs
MetaTrader 4 version available here: https://www.mql5.com/en/market/product/25793 FFx Pivot SR Suite PRO is a complete suite for support and resistance levels. Support and Resistance are the most used levels in all kinds of trading. Can be used to find reversal trend, to set targets and stop, etc. The indicator is fully flexible directly from the chart 4 periods to choose for the calculation: 4Hours, Daily, Weekly and Monthly 4 formulas to choose for the calculation: Classic, Camarilla, Fibonac
ClassicSBA
Umri Azkia Zulkarnaen
this indicator very simple and easy if you understand and agree with setup and rule basic teknical sba you can cek in link : please cek my youtube channel for detail chanel : an for detail info  contact me  basicly setup buy (long) for this indicator is Magenta- blue and green candle or magenta - green  and green candlestik and for setup sell (short) is Black - yellow - and red candle or black - red  and red candlestik
Pendiente de Precio
Cesar Juan Flores Navarro
Indicador en base a la pendiente de la linea de precio, dibuja una línea de color cuando sube a base de los precios que previamente has sido procesados o linealizados, y cuando baja la pendiente la linea linealizada toma otro color. En este caso se a considerado 6 lineas de diferentes procesos desde pendientes largas hacia las cortas, observándose que cuando coincidan las pendientes se produce un máximo o mínimo, lo que a simple vista nos permitirá hacer una COMPRA O VENTA.
Индикатор Coefficient Of Determination (COD) представляет собой значение коэффициента детерминации или квадрат коэффициента корреляции между зависимой переменной — ценой и объясняющей переменной — тиковым объемом. Что это дает нам на практике? COD отлично распознает кульминацию трендовых движений, что позволяет подбирать оптимальные точки и ловить развороты рынка. Как использовать индикатор: Наиболее популярная торговая стратегия строится совместно с трендовым индикатором Moving Average (MA), пе
Fibonacci Multiple 12
Cesar Juan Flores Navarro
Fibonacci Múltiple 12, utiliza la serie fibonacci plasmado en el indicador fibonacci, aumentadolo 12 veces según su secuencia. El indicador fibonacci normalmente muestra una vez, el presente indicador se mostrara 12 veces empezando el numero que le indique siguiendo la secuencia. Se puede utilizar para ver la tendencia en periodos cortos y largos, de minutos a meses, solo aumentado el numero MULTIPLICA.
Recommended TimeFrame >= H1. 100% Non Repainted at any moment.  Use it carefully, only with Trend Direction. Trading Usage: 2 Variants: as Range System or as BreakOut System (Both Only With Trend Direction)::: (Always use StopLoss for minimise Risk); [1] as Range System: (Recommended) in UP TREND:  - BUY in Blue Line , then if price goes down by 50 points (on H1) open Second BUY.   Close in any Profit you wish: TrailingStop(45 points) or Close when Price touches upper Gold Line. in DOWN TREND
Yazarın diğer ürünleri
Meravith
Ivan Stefanov
5 (1)
Gösterge, her noktadan hacmi analiz eder ve bu hacim için piyasa tükenme seviyelerini hesaplar. Üç çizgiden oluşur: Boğa hacmi tükenme çizgisi Ayı hacmi tükenme çizgisi Piyasa trendini gösteren bir çizgi. Bu çizgi, piyasanın boğa mı yoksa ayı mı olduğunu yansıtacak şekilde rengini değiştirir. Piyasayı istediğiniz herhangi bir başlangıç noktasından analiz edebilirsiniz. Bir hacim tükenme çizgisine ulaşıldığında, bir sonraki analize başlamak için yeni bir nokta belirleyin. Herhangi bir şeyi analiz
Meravith AUTO
Ivan Stefanov
5 (1)
Meravith Auto, Meravith ticaret sisteminin otomatik bir versiyonudur. Gösterge, rengini değiştiren bir trend çizgisinden oluşur. Yükseliş trendindeyken yeşil, düşüş trendindeyken kırmızıdır. Bu, trendin destek çizgisidir. Boğa hacminin ayı hacmine eşit olduğu bir likidite çizgisi. Üçlü boğa sapma çizgisi. Üçlü ayı sapma çizgisi. Yüksek hacmi gösteren mor ve mavi noktalar. Mor nokta, ortalama hacmin iki sapma üstünde hacmi gösterirken, mavi nokta iki sapmayı gösterir. Nasıl kullanılır? Trend çizg
MACD divergency
Ivan Stefanov
5 (4)
Bu gösterge, fiyat hareketleri ile MACD histogramı arasındaki yükseliş ve düşüş uyumsuzluklarını (divergence) doğru bir şekilde tespit eder. Kullanılan üssel hareketli ortalamalar (EMA) periyotları 5 (hızlı) ve 34 (yavaş), sinyal hattı periyodu ise 5’tir. Gösterge, momentumin zayıfladığı noktaları vurgulayarak muhtemel trend dönüşlerine işaret eder. Doğru uyumsuzluk tespiti kuralları Yükseliş uyumsuzluğu, fiyat daha düşük dipler oluştururken MACD histogramı sıfır çizgisinin üzerinde aynı anda da
FREE
Horizont
Ivan Stefanov
Horizont, giriş noktası, Hedef 1, Hedef 2 ve Stop Loss dahil olmak üzere eksiksiz bir işlem kurulumu sağlayan bir ticaret sistemidir ve tüm seviyeler otomatik olarak hesaplanır. Sistem, piyasanın zirve ve diplerini otomatik olarak tespit eder ve bunları mevcut trendi tanımlamak için birleştirir. Hangi trend üzerinde işlem yapmak istediğinizi seçersiniz ve Horizont buna uygun giriş, hedef ve stop seviyelerini oluşturur. Sistem, otomatik risk yönetimi içerir. Hesap bakiyenizi kontrol eder, riski
Göstergе, herhangi bir noktadan hacmi analiz eder ve bu hacim için piyasanın tükeniş seviyelerini hesaplar. Meravith’in ana çizgileri: Boğa hacim tükeniş çizgisi – hedef olarak kullanılır. Ayı hacim tükeniş çizgisi – hedef olarak kullanılır. Trend çizgisi – piyasa trendini gösterir. Piyasanın boğa mı ayı mı olduğuna bağlı olarak rengi değişir ve trend desteği görevi görür. Nasıl kullanılır: Mor dikey çizgiye çift tıklayın ve istediğiniz konuma taşıyın. Her şeyi analiz edebilirsiniz – trendleri v
Fiyatlara dayalı seviyeleri hesaplayan nadir göstergelerden biridir. Bu gösterge zaman dilimlerinden, trendlerden veya piyasa döngülerinden etkilenmez. Şimdiye kadar oluşturulmuş en mantıklı göstergelerden biridir. FIFTY göstergesi artık otomatik bir versiyonla sunuluyor; bu da seviyeleri manuel olarak çizme ihtiyacını ortadan kaldırıyor. Bu versiyon, grafik üzerine günlük, haftalık, aylık ve yıllık seviyeleri otomatik olarak çizer; böylece hem doğruluk sağlanır hem de zaman kazandırır. Ayrıca,
Bu gösterge, MetaTrader 4 ve 5 için etkileşimli bir Elliott Dalga etiketleme aracıdır. Kullanıcının, grafik üzerindeki menüden etiket boyutunu, rengini ve dalga türünü (ABC düzeltmeleri, 5 dalgalı impulslar veya WXY yapıları) seçerek dalga etiketlerini manuel olarak grafiğe yerleştirmesine olanak tanır. Grafikte tek bir tıklamayla, gösterge seçilen fiyat ve zaman noktasına uygun dalga etiketlerini sırasıyla yerleştirir ve yatırımcıların Elliott Dalga yapılarını görsel olarak haritalandırmasına v
FREE
Gelişmiş momentum osilatörü, daha doğru aşırı alım ve aşırı satım sinyalleri için periyodunu piyasa oynaklığına göre otomatik olarak ayarlar. Çalışma Prensibi: Gösterge, yüksek oynaklıkta kısalan ve düşük oynaklıkta uzayan uyarlanabilir bir periyot hesaplaması kullanır. Bu dinamik ayar, piyasa trend halindeyken daha hızlı sinyaller sağlar ve yatay piyasa koşullarında yanlış sinyalleri azaltır. RSI değeri, bu değişken periyoda göre hesaplanır, bu da onu mevcut piyasa koşullarına daha duyarlı hale
FREE
Meravith Auto, Meravith ticaret sisteminin otomatik bir versiyonudur. Gösterge, rengini değiştiren bir trend çizgisinden oluşur. Yükseliş trendindeyken yeşil, düşüş trendindeyken kırmızıdır. Bu, trendin destek çizgisidir. Boğa hacminin ayı hacmine eşit olduğu bir likidite çizgisi. Üçlü boğa sapma çizgisi. Üçlü ayı sapma çizgisi. Yüksek hacmi gösteren mor ve mavi noktalar. Mor nokta, ortalama hacmin iki sapma üstünde hacmi gösterirken, mavi nokta iki sapmayı gösterir. Nasıl kullanılır? Trend çizg
Bu gösterge, MetaTrader 4 ve 5 için etkileşimli bir Elliott Dalga etiketleme aracıdır. Kullanıcının, grafik üzerindeki menüden etiket boyutunu, rengini ve dalga türünü (ABC düzeltmeleri, 5 dalgalı impulslar veya WXY yapıları) seçerek dalga etiketlerini manuel olarak grafiğe yerleştirmesine olanak tanır. Grafikte tek bir tıklamayla, gösterge seçilen fiyat ve zaman noktasına uygun dalga etiketlerini sırasıyla yerleştirir ve yatırımcıların Elliott Dalga yapılarını görsel olarak haritalandırmasına v
FREE
Naturu
Ivan Stefanov
5 (1)
“Naturu”, doğanın simetrisini algoritması olarak kullanan bir manuel indikatördür. Basit bir strateji ve gizli bilgelikle piyasayı fethedin! İndikatörü yüklediğinizde iki çizgi görürsünüz: Üst (Top) ve Alt (Bottom). Bir çizgiye tıklayarak aktifleştirin. Taşımak için, yerleştirmek istediğiniz mumun üzerine tıklayın. Bir tepe noktası ve bir dip noktası belirlersiniz, indikatör otomatik olarak hesaplar: Boğalar ve ayıların çıkarlarının en yakınlaştığı, destek veya direnç rolü oynaması en muhtemel b
Sense
Ivan Stefanov
5 (2)
SENSE, seçilen GANN yöntemlerini fraktal hesaplamalarla birleştiren otomatik bir sistemdir. Sistem bize işlemlerin nerede açılacağını ve kapatılacağını söyler. Artık karmaşık hesaplamalarla zaman kaybetmenize gerek yok - SENSE sizin için her şeyi yapar. Sadece göstergeyi yükleyin. Temel ilkeler: Fiyat beyaz çizgilerin üzerinde olduğunda piyasa yükselişe geçer Beyaz çizgilerin üzerinde satın alın, altında durun Yeşil çizgiler yukarı yönlü hedeflerdir Fiyat beyaz çizgilerin altında olduğunda
Imbalance Pro
Ivan Stefanov
5 (4)
Gösterge, seçilen bir dönem boyunca boğalar ve ayılar arasındaki dengesizliği ölçer ve iki nokta arasında düz bir çizgi gösterir. Boğalar ayılardan daha fazla hacme sahipse, çizgi yeşile döner.  Ayılar daha fazla hacme sahipse kırmızı olur. Çizgi ayrıca hacimdeki yüzde farkını da gösterir. Gösterge aynı verileri ayrı bir pencerede gösterir. Bölünmüş hacmi de görebilirsiniz. Göstergenin iki modu vardır. Bu amaçla, sol üstte bir düğme vardır,  - basılı değilse, piyasadaki rastgele bir nokta
Two Snakes
Ivan Stefanov
5 (1)
2 SNAKES birinci sınıf bir scalping sistemidir. Girişler oldukça hassas olduğundan, bu sisteme çok hızlı bir şekilde bağımlı hale gelmeniz muhtemeldir.  2 yılanınız var. Üstlerinde veya altlarında onlara dokunmayan bir mum gördüğünüzde - bu sizin scalping sinyalinizdir. Daha büyük bir zaman çerçevesi kullanırsanız, scalping takip eden trend haline gelebilir. Yılanlar, piyasanın mevcut durumuna göre tam olarak hesaplanır. Hareketli ortalamalar DEĞİLDİR.  Pozisyonunuzu ne kadar süre tutacağ
Separated Volume
Ivan Stefanov
5 (1)
Bu gösterge, forex piyasasındaki tik hacmini etkin bir şekilde yükseliş ve düşüş kategorilerine ayırır. Ek olarak, seçtiğiniz herhangi bir dönem için yükseliş ve düşüş kene hacimlerinin toplamını hesaplama ve görüntüleme işlevselliği sağlar. Grafikteki iki mavi çizgiyi hareket ettirerek dönemi kolayca ayarlayabilir, ticaret ihtiyaçlarınıza göre özelleştirilebilir ve hassas hacim analizine izin verebilirsiniz. Eğer faydalı bulursanız yorumlarınız takdir edilecektir! Mutlu ticaretler!
FREE
Bu gösterge pratik deneyimlere dayanmaktadır.  En üst/en alt seviyenizin tarihini/saatini girin. Üstten/alttan mevcut ana kadar en çok ziyaret edilen seviyeyi hesaplar. Her yeni mumla otomatik olarak güncellenir. Farklı trendler ve zaman dilimleri için aynı anda birden fazla gösterge kullanabilirsiniz. Uzunluk her zaman döneminizin başlangıcından günümüze kadar çizilir. Yararlı PRO aracı.
FREE
Enigmera
Ivan Stefanov
5 (8)
ENIGMERA: Pazarın Kalbi Önemli: MQL5.com demosu Strategy Tester'da çalışır ve Enigmera'nın tüm işlevlerini tam olarak yansıtmayabilir. Daha fazla bilgi için açıklamayı, ekran görüntülerini ve videoyu kontrol edin. Herhangi bir sorunuz varsa, bana mesaj göndermekten çekinmeyin! Göstergenin kodu tamamen yeniden yazılmıştır. 3.0 sürümü, yeni işlevler ekler ve göstergenin başlangıcından bu yana biriken hataları giderir. Giriş Bu gösterge ve ticaret sistemi, finansal piyasalara dikkat çekici bir ya
Levelss
Ivan Stefanov
5 (1)
LEVELSS göstergesi gösterir: - Günlük yükseliş ve düşüş bölgesi. Her gün 00:00 ile 23:59 arasında görülebilir.  - Haftalık yükseliş ve düşüş bölgesi. Her hafta Pazartesi 0:00'dan Cuma 23:59'a kadar görülebilir. - Diğer tüm zaman dilimlerinde görüntülenen belirli bir zaman diliminden özel olarak hesaplanan kanal. Varsayılan olarak, bu, işlem yapmak istediğiniz diğer zaman dilimine değiştirebileceğiniz 4 saatlik zaman dilimidir. Kesintisiz olarak hesaplanır. Ekranın sol üst köşesinde, bölgeleri
GANN Master
Ivan Stefanov
5 (1)
GANN’ın kesin hedefleri, yıllarca test edilmiş yöntemlerine dayanarak hesaplanır ve karşınızda sunulur. Bu araç, ticareti daha kolay ve sezgisel hale getirmek için tasarlanmıştır. Beyaz çizgiyi yukarı veya yeşil çizgiyi aşağı doğru hareket ettirdiğinizde, GANN'ın tekniklerinin ticaret dünyasında neden hala etkili olduğunu hemen anlayacaksınız. GANN’ın stratejileri, piyasa hareketlerini yüksek bir doğrulukla tahmin etmeye odaklanır ve bu araç bu gücü parmaklarınızın ucuna getirir. İster deneyimli
Stefanov
Ivan Stefanov
The indicator displays support and resistance zones defined logically using the MACD. The entire concept is explained in the video, with specific examples shown. The indicator works on any instruments and timeframes. It does not repaint. After placing it on the chart, please go through all the timeframes sequentially, from monthly to 1-minute, so that all lines load correctly. After that, you can start using it. The concept is unique and has not been seen in other systems or indicators.
Fifty Pro
Ivan Stefanov
5 (1)
FIFTY göstergesi artık manuel seviye çizme ihtiyacını ortadan kaldıran otomatik bir versiyonla sunulmaktadır. Bu versiyon, günlük, haftalık, aylık ve yıllık seviyeleri otomatik olarak grafiğe çizer, böylece doğruluk sağlanır ve zaman tasarrufu yapılır. Ayrıca, bu seviyelerin görünürlüğünü açıp kapatmak için düğmeler mevcuttur, bu da tamamen özelleştirilebilir bir kullanım sunar. Manuel kullanımı tercih edenler için, göstergeyi ücretsiz versiyonu hâlâ mevcut olup tam işlevselliğe sahiptir. Böylec
“Naturu”, doğanın simetrisini algoritması olarak kullanan bir manuel indikatördür. Basit bir strateji ve gizli bilgelikle piyasayı fethedin! İndikatörü yüklediğinizde iki çizgi görürsünüz: Üst (Top) ve Alt (Bottom). Bir çizgiye tıklayarak aktifleştirin. Taşımak için, yerleştirmek istediğiniz mumun üzerine tıklayın. Bir tepe noktası ve bir dip noktası belirlersiniz, indikatör otomatik olarak hesaplar: Boğalar ve ayıların çıkarlarının en yakınlaştığı, destek veya direnç rolü oynaması en muhtemel b
Balance Levels, net alım ve satım sinyalleri ile dinamik fiyat seviyeleri sağlayan, kullanımı kolay bir işlem indikatörüdür. Bu sayede yatırımcılar giriş ve çıkışlarını daha güvenle planlayabilir. Araç son derece esnektir – bağımsız bir strateji olarak kullanılabilir veya mevcut herhangi bir işlem sistemine entegre edilebilir. Tüm zaman dilimlerinde ve tüm piyasalarda çalışır: Forex, Altın, Endeksler, Kripto Paralar veya Hisseler. Balance Levels her işlem tarzına uygundur – scalping , gün içi iş
Enigmera MT5
Ivan Stefanov
3.67 (3)
ENIGMERA: Piyasanın özü (Bu, manuel bir indikatördür ve bazı özellikler mevcut MetaTrader test ortamı tarafından desteklenmeyebilir) Giriş Bu indikatör ve ticaret sistemi, finansal piyasalara benzersiz bir yaklaşım sunar. ENIGMERA, destek ve direnç seviyelerini hassas bir şekilde hesaplamak için fraktal döngüler kullanır. Gerçek bir birikim (akümülasyon) aşamasını gösterir ve yön ile hedefleri belirtir. Hem trend hem de düzeltme dönemlerinde çalışan bir sistemdir. Nasıl çalışır İndikatörün çoğu
Efsanevi William Gann seviyelerini tam otomatik MT5 indikatöründe. GANN Master, günlük, haftalık ve aylık verilere dayanarak fiyatın en muhtemel dönüş veya trend devamı bölgelerini tespit eder. Temel Özellikler Tek tıkla zaman periyodu: “Daily”, “Weekly” veya “Monthly” düğmesine tıklayarak bugünün, bu haftanın veya bu ayın zonlarını anında çizin Otomatik ve Manuel Modlar Otomatik : GANN Master tüm seviyeleri sizin için hesaplar—manuel girdi gerekmez Manuel : “Top” ve “Bottom” çizgilerini sürükle
SPEKULATOR, önemli destek bölgelerini ve piyasa yönünü belirlemenize yardımcı olan manuel bir ticaret sistemi ve göstergesidir. Basit bir strateji ve gizli bilgiyle piyasayı ustaca yönetin. Grafikte herhangi bir zirve (TOP) ve dip (BOTTOM) seçiyorsunuz, ardından gösterge şunları çizer: Trendinize göre bir destek bölgesi. Yükseliş trendi için yeşil bir bölge, düşüş trendi için kırmızı bir bölge görünür. Destek bölgesinin hassasiyeti, göstergenin ayarlarında ayarlanabilir. Bu bölge, seçtiğiniz tre
Time Zones Fifty Gösterge temel bir sorunu çözüyor: Zamanı nasıl saymalıyız? Hangi bölgeleri kullanmalıyız, nasıl ve neden? Tamamen mantığa dayalıdır. Zaman bölgelerinin uygulanması Zaman bölgelerini uygulamak için bir başlangıç noktası gerekir. Bu nokta rastgele değil, mantıksal olarak tanımlanmalıdır. Bazıları şu noktalardan başlamayı seçer: yılın ilk günü ayın ilk günü çeyrek ya da haftanın başlangıcı Ama bu, piyasa hareketlerinin her yıl aynı tarihte mutlaka tekrar edeceği anlamına gelir. Ör
Balance Levels is an easy-to-use trading indicator that provides clear buy and sell signals along with dynamic price levels, helping traders plan their entries and exits with more confidence. The tool is highly flexible – it can be used as a standalone strategy or integrated into any existing trading system. It works on all timeframes and across all markets: Forex, Gold, Indices, Crypto, or Stocks. Balance Levels suits every trading style – from scalping and intraday, to swing trading and even l
Volume Equilibrium göstergesi, alım hacmi ile satış hacminin eşit olduğu seviyeleri gösterir. Bu seviyeleri her gün, hafta, ay ve yıl için hesaplayabilir. Fiyat çizginin üzerindeyken, hacmin alıcı tarafında olduğunu ve piyasanın yükseliş bölgesinde olduğunu gösterir. Fiyat çizginin altındayken ise hacmin satıcı tarafında olduğunu ve piyasanın düşüş bölgesinde olduğunu gösterir. Gösterge, seviyeleri hesaplamak için “Meravith” göstergesinin algoritmasını kullanır. Hacim seviyeleri son derece hassa
Filtrele:
Max2233
520
Max2233 2025.07.08 10:33 
 

I would like to compliment this work of art composed by IVAN, a very precise indicator and in combination with his other jewels created by him, trading has simply become simpler and more intuitive. A round of applause to IVAN.

Mase
1734
Mase 2025.05.29 14:17 
 

Simply perfect! In combination with Ivan's other technical indicators, it is a powerful tool. Warning: highly addictive, as the indicators bring so much joy and success. Highly recommended.

İncelemeye yanıt