Meravith

5

Market maker aracı.

Meravith şunları yapar:

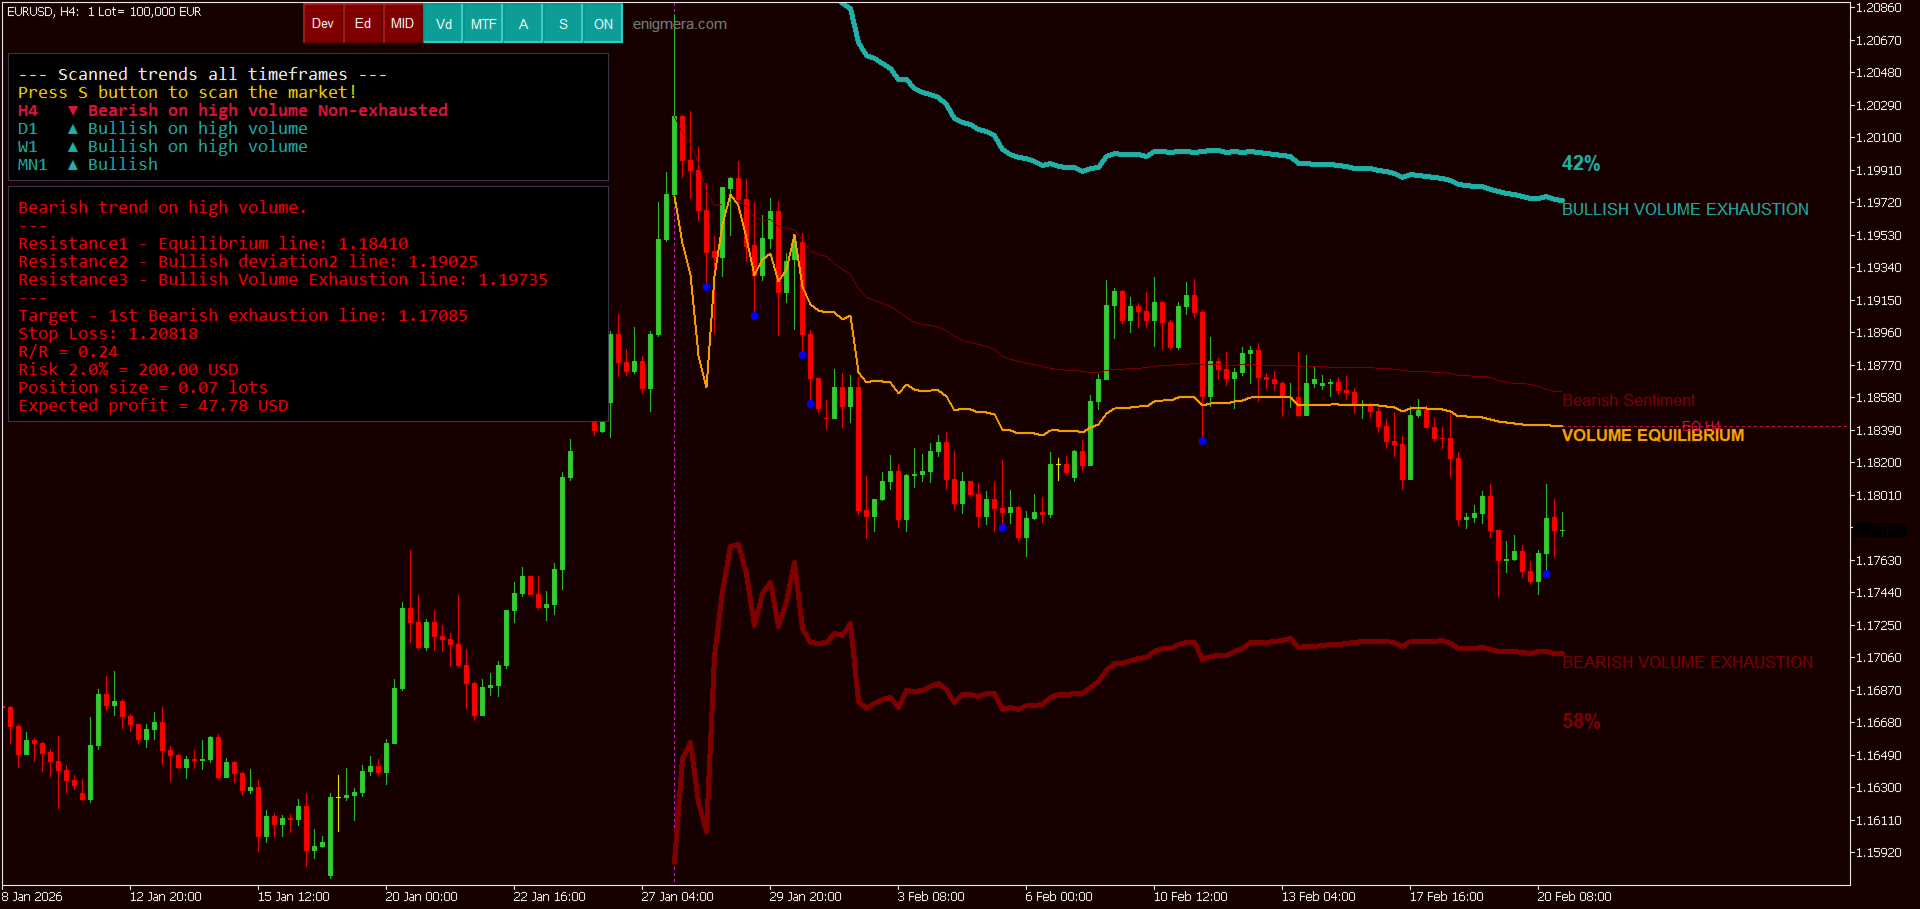
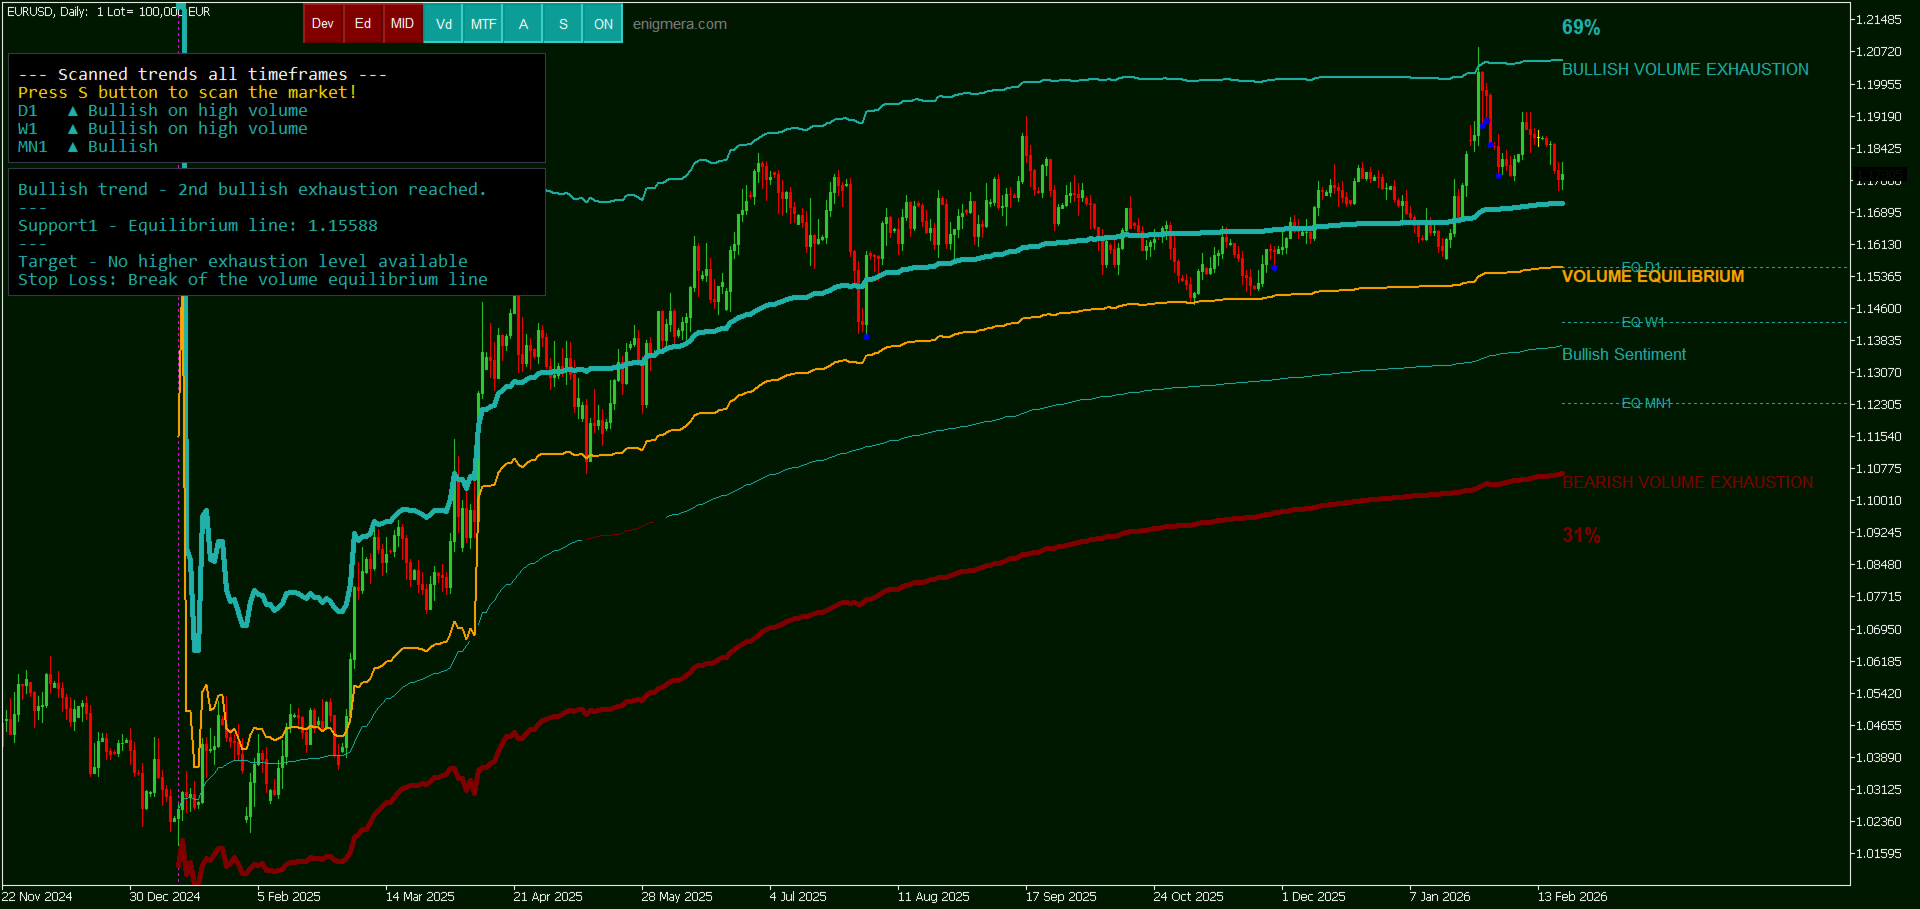
Tüm zaman dilimlerini analiz eder ve geçerli trendi gösterir.
Alış ve satış hacimlerinin eşit olduğu likidite bölgelerini (hacim dengesi) vurgular.
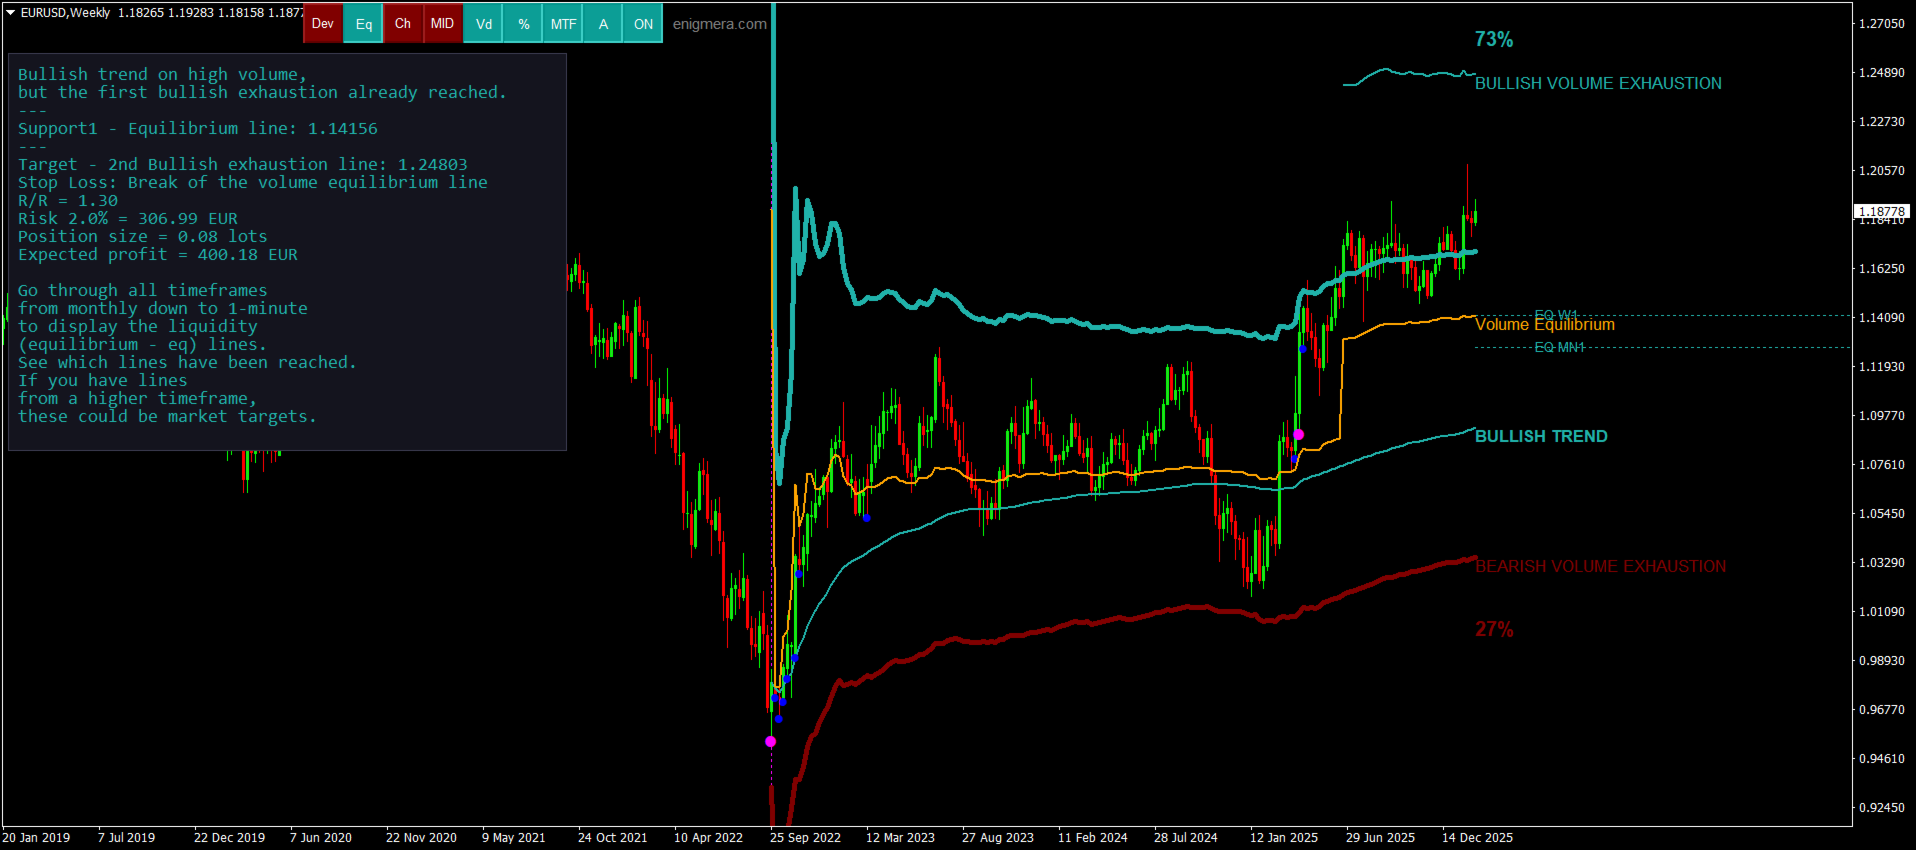
Farklı zaman dilimlerinden tüm likidite seviyelerini doğrudan grafiğinizde gösterir.
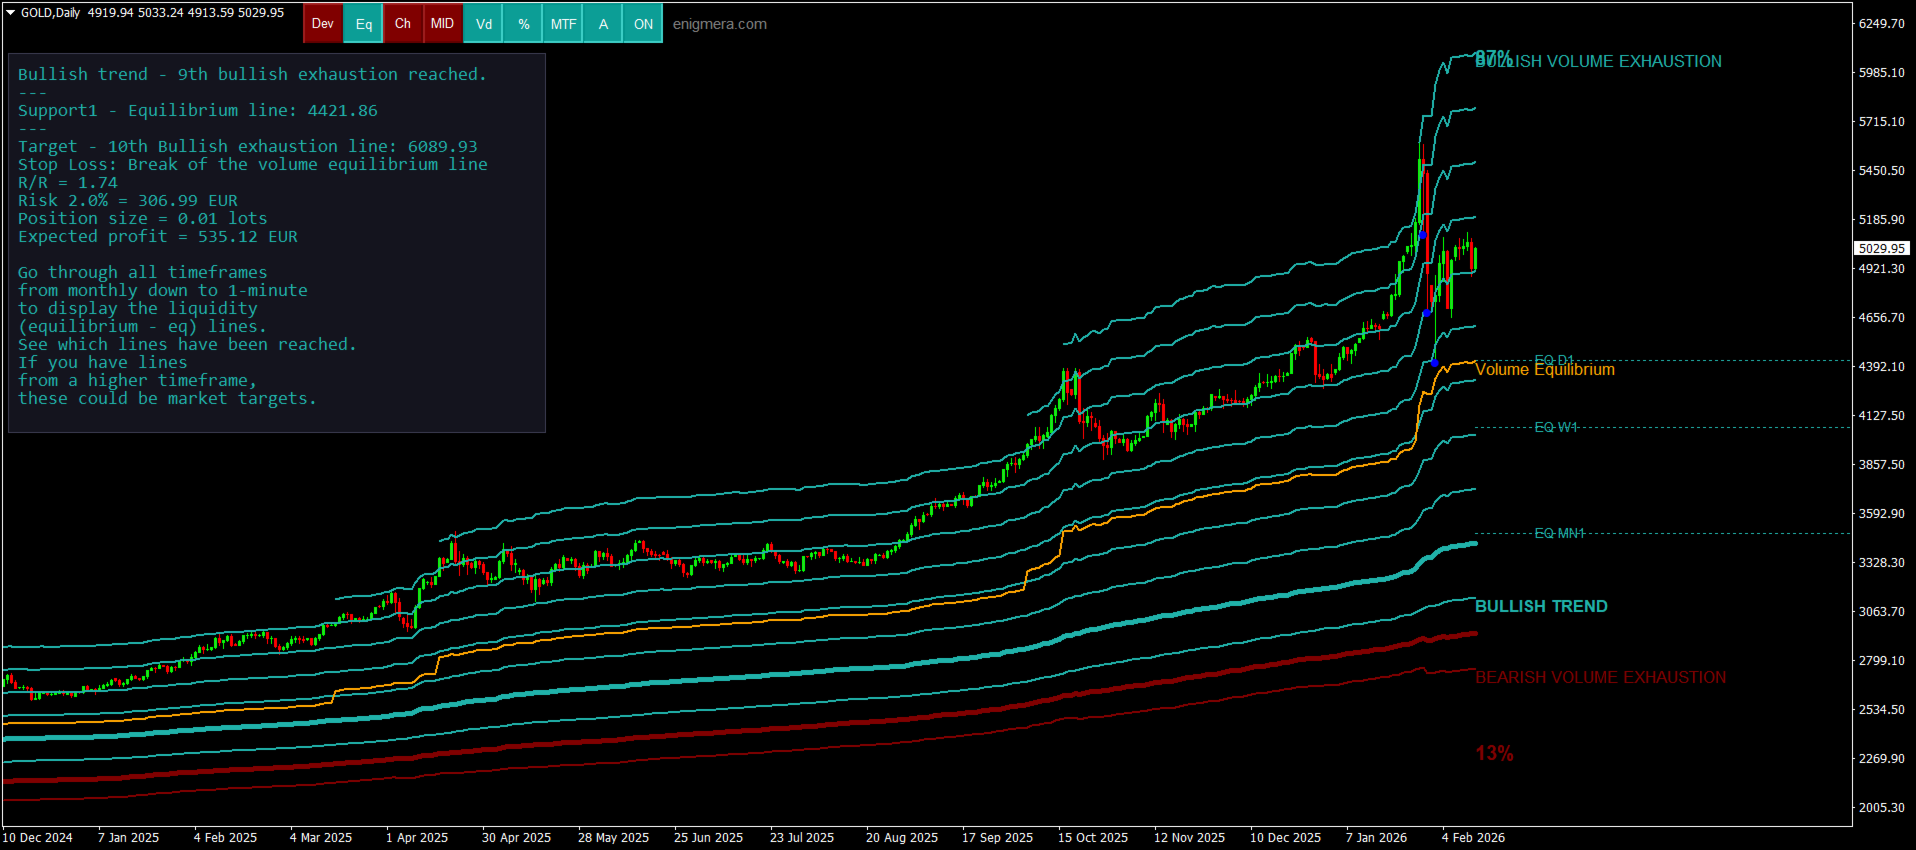
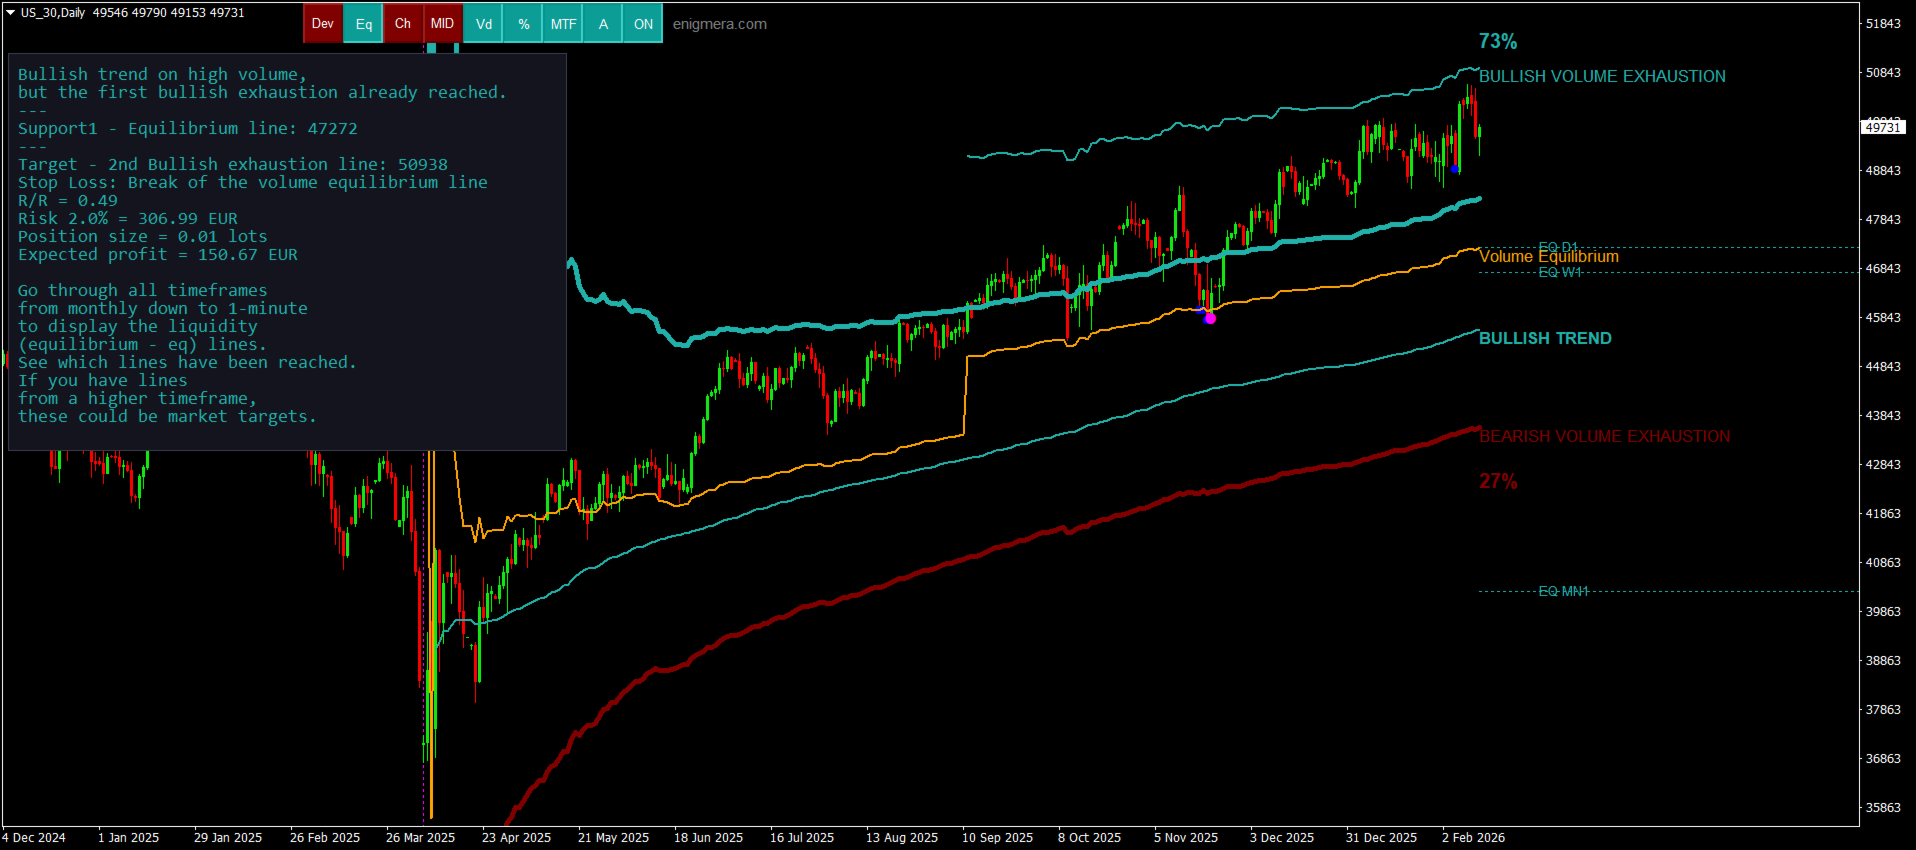
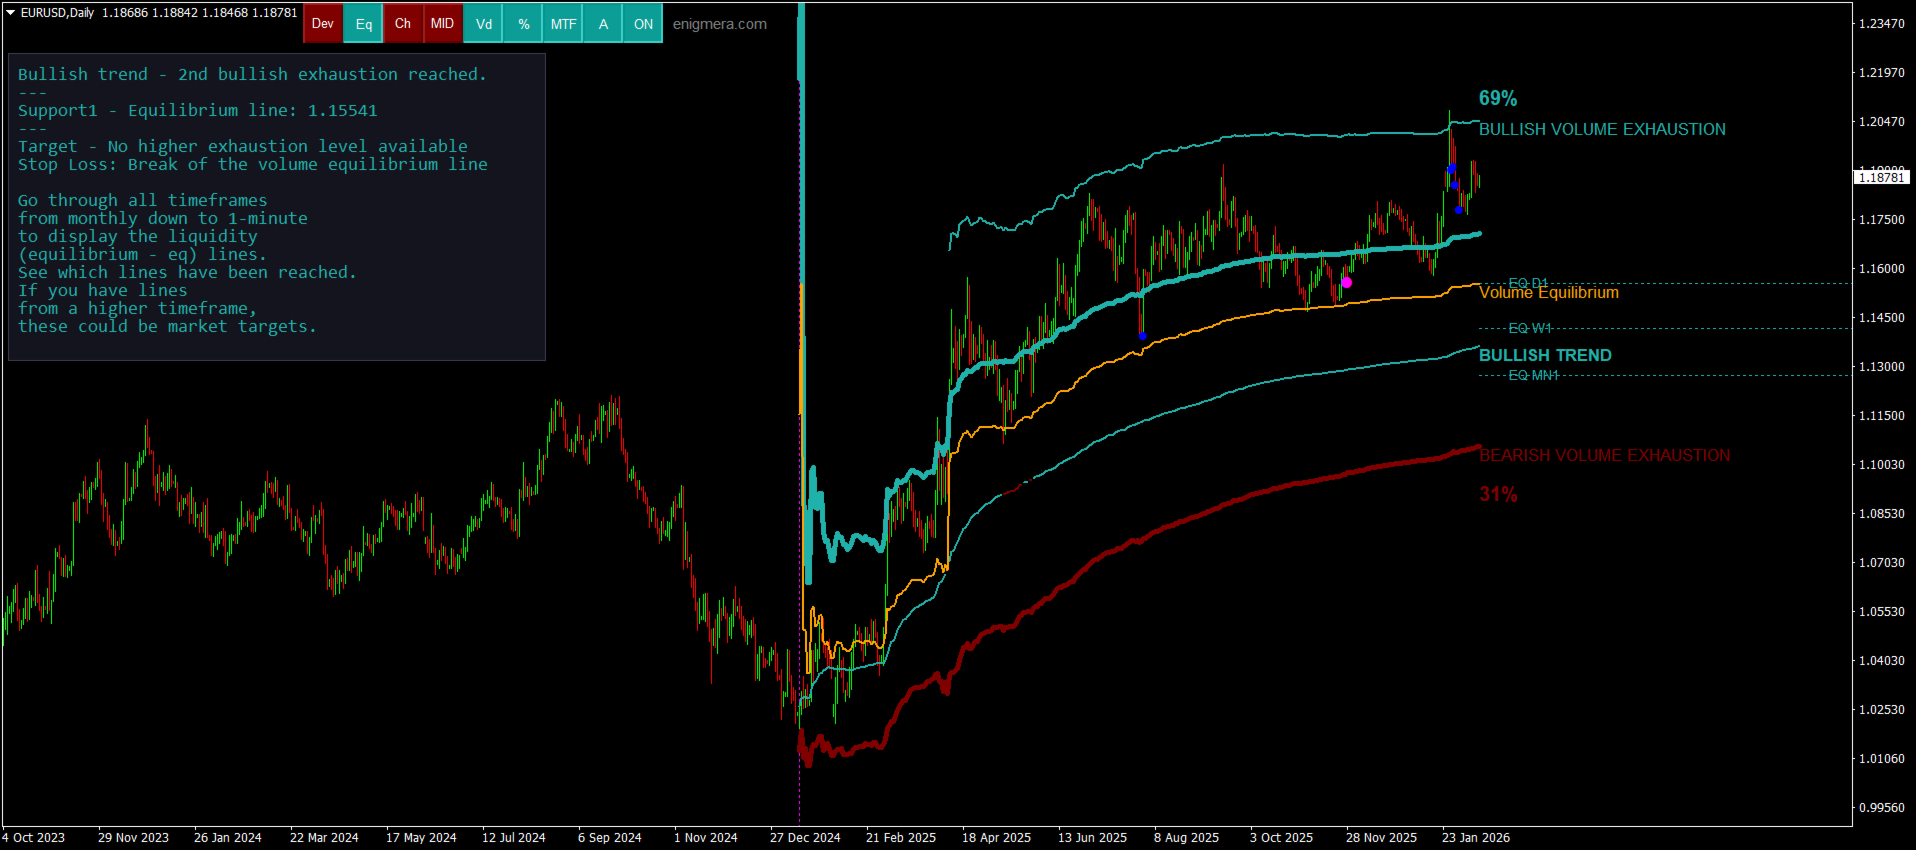
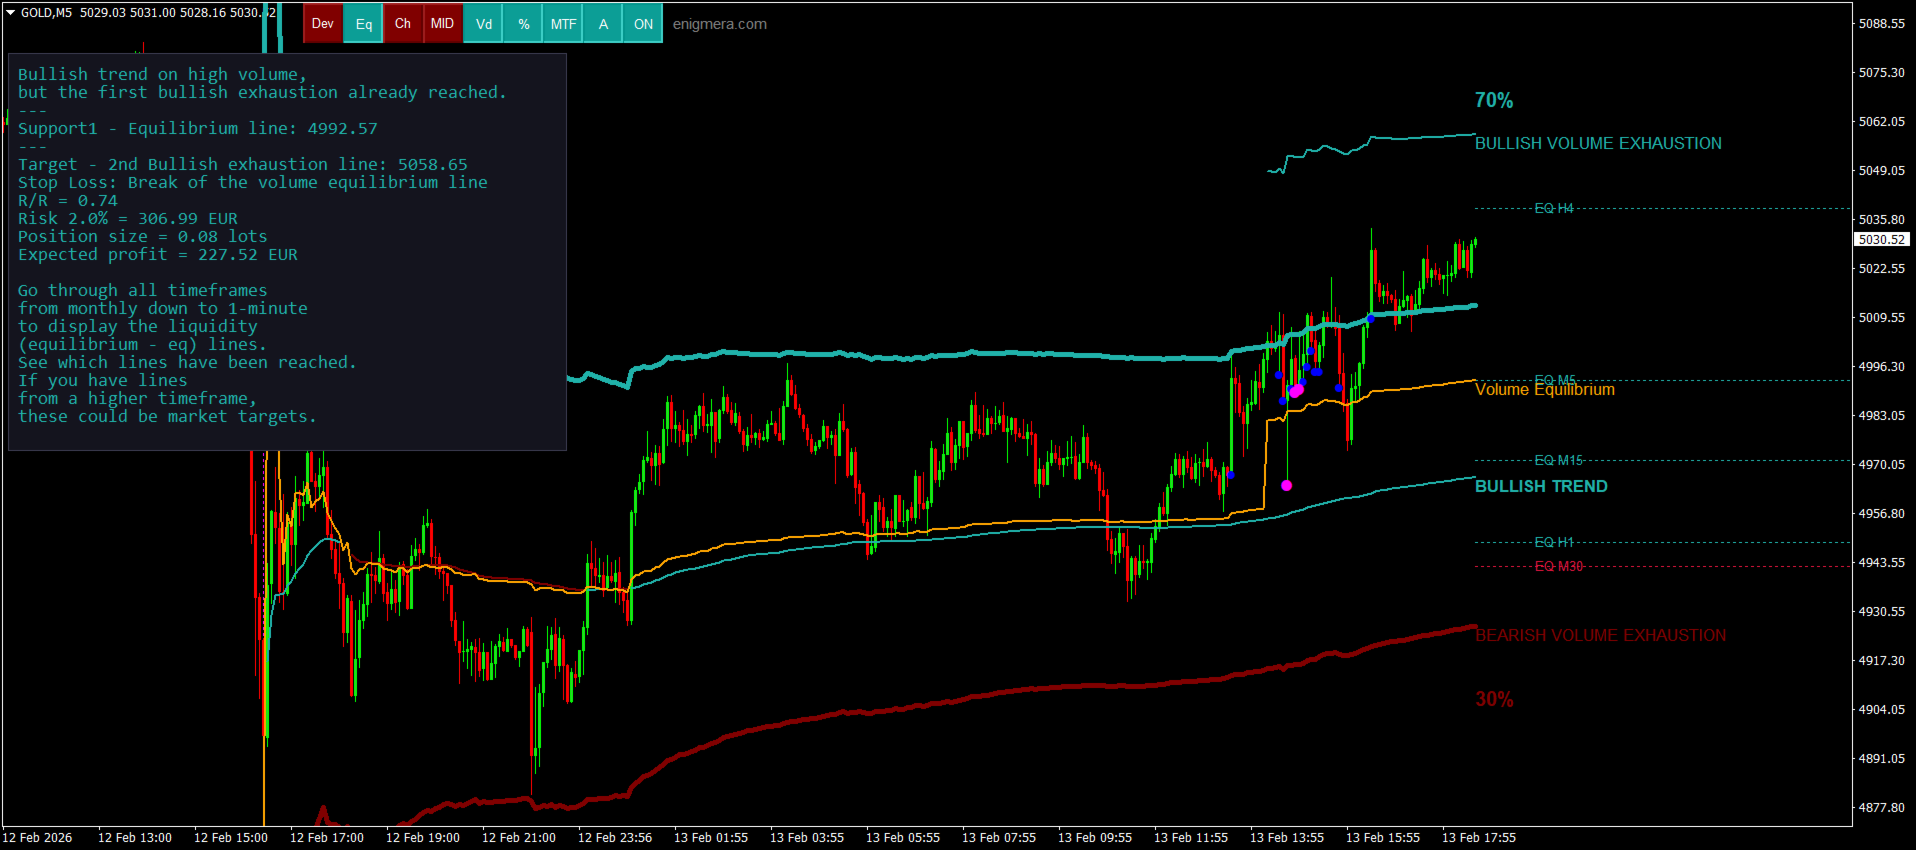
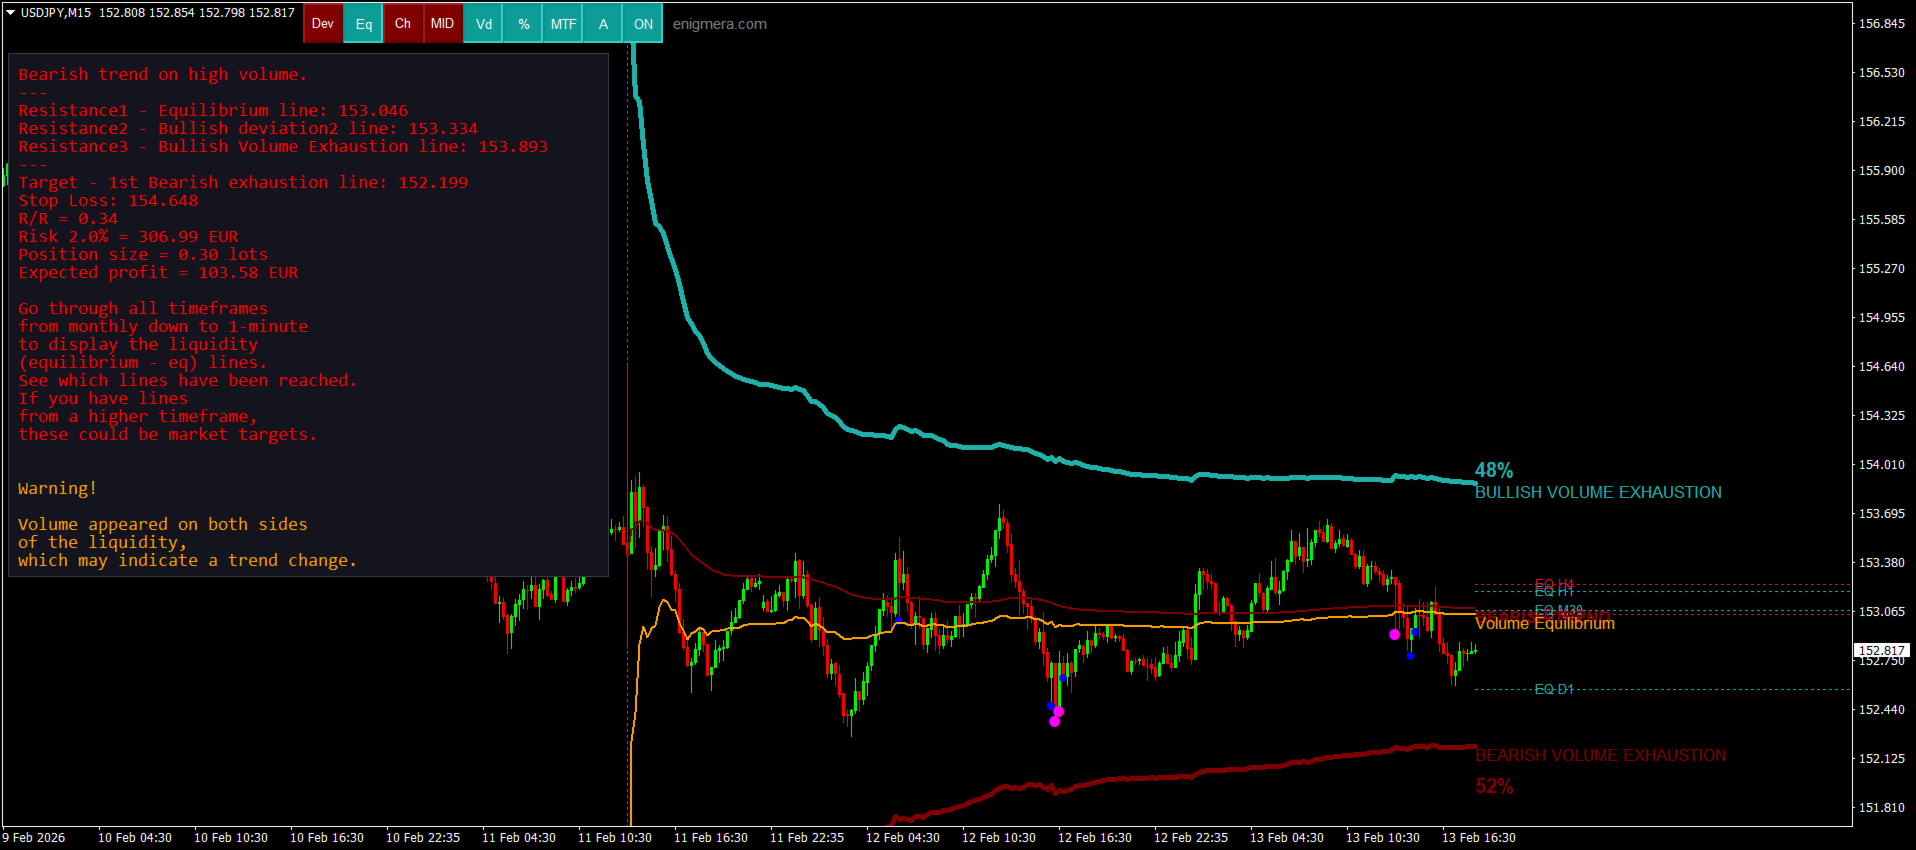
Referansınız için metin tabanlı piyasa analizi üretir ve sunar.
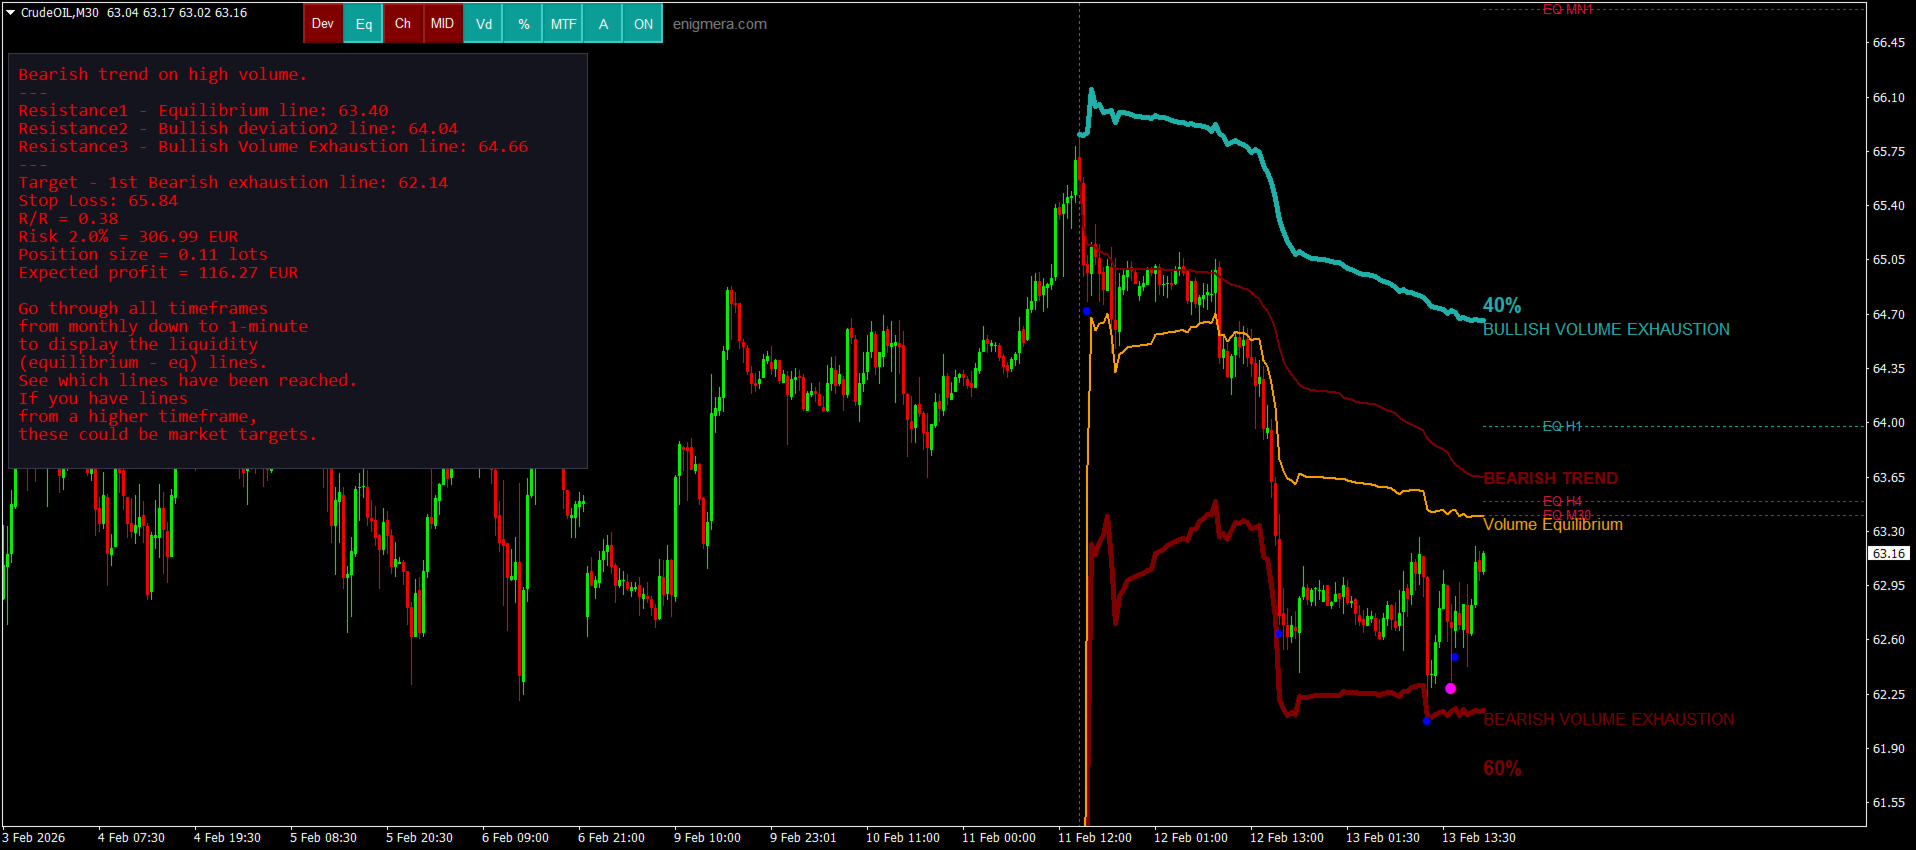
Mevcut trende göre hedefler, destek seviyeleri ve stop-loss noktalarını hesaplar.
İşlemleriniz için risk/ödül oranını hesaplar.
Hesap bakiyenize göre pozisyon büyüklüğünü belirler ve potansiyel kazancı tahmin eder.

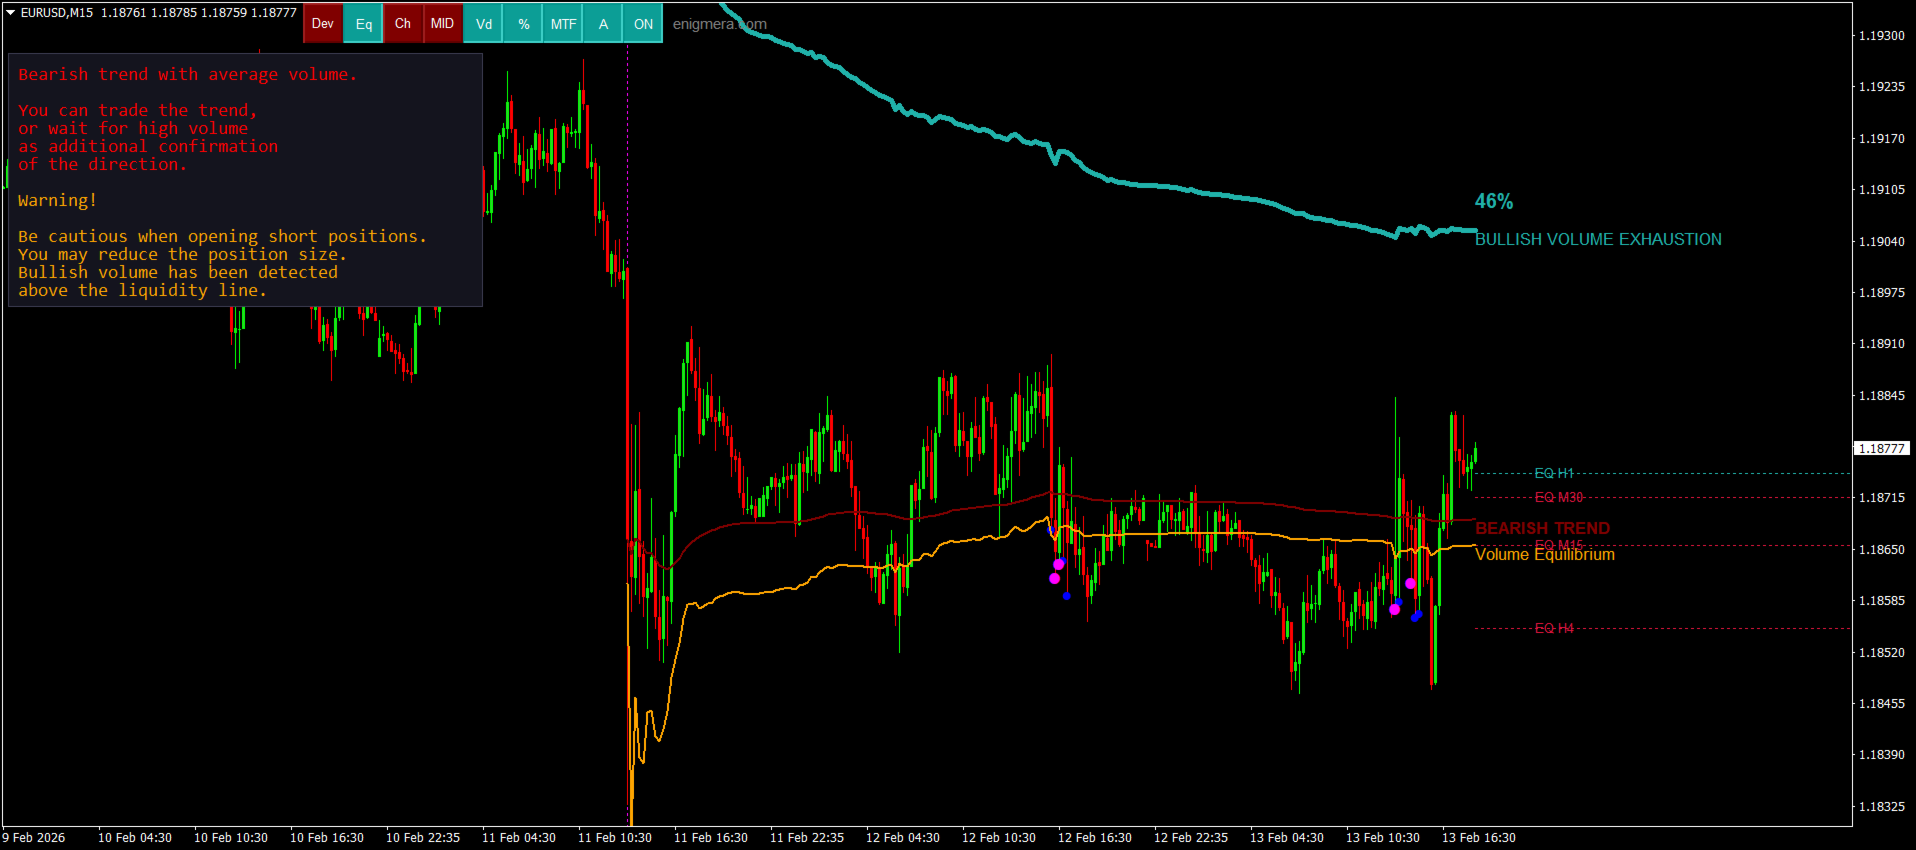
Önemli piyasa değişiklikleri durumunda Meravith uyarılar da verir.

Göstergenin ana çizgileri:

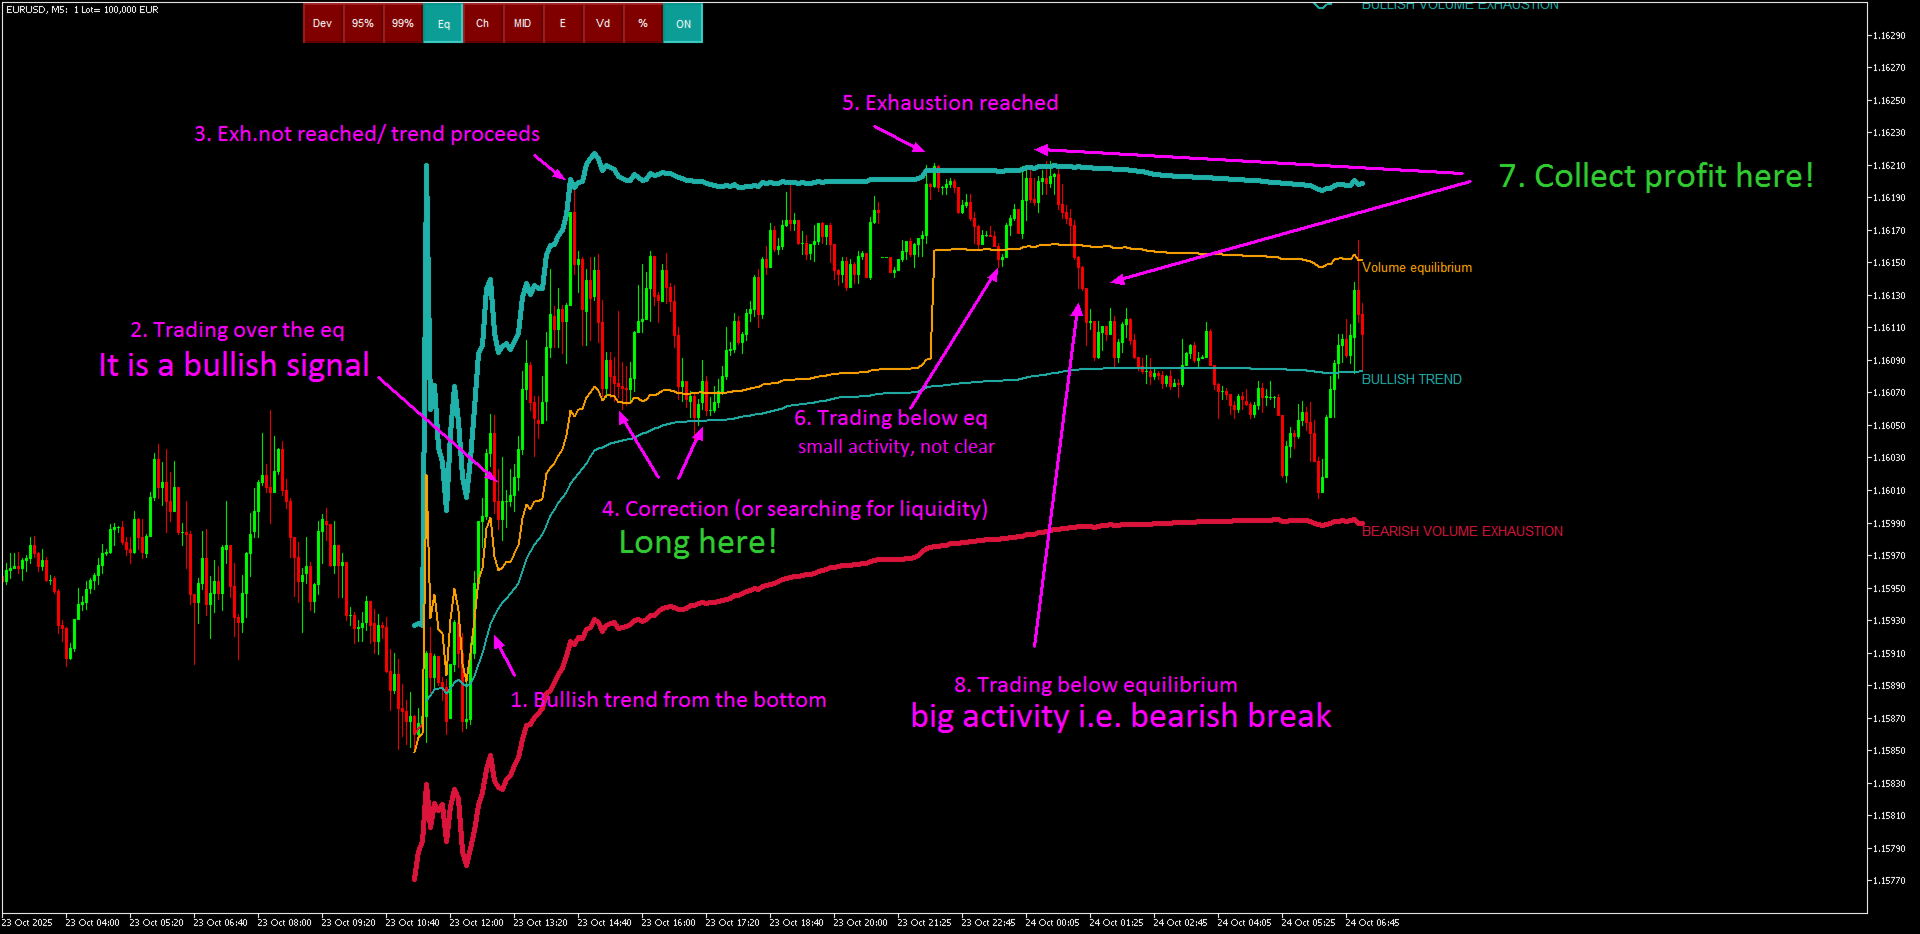
Alış/Satış hacmi tükenme çizgileri — hedef olarak kullanılır.
Piyasa trendini gösteren çizgi. Piyasa yükseliş veya düşüşteyse renk değiştirir ve trend desteği olarak görev yapar. Rengi, piyasa hissiyatını gösterir.
Hacim Dengesi Çizgisi (Eq). Eq (Volume Equilibrium) çizgisi sistemin merkezidir. Alıcılar ve satıcılar arasındaki hacim dengesi noktasını temsil eder. Piyasadaki likiditeyi gösterir. Eq’nin üzerinde bir kırılma, yükseliş eğilimi; altında bir kırılma, düşüş eğilimi sinyali verir. Kırılmadan sonra, fiyatın zıt trendin sapma veya tükenme çizgilerinden birine dönmesini bekleyin.

Kullanımı: Sadece grafiğinize ekleyin.

Meravith her şeyi analiz eder — trendler ve düzeltmeler.

Trend çizgisi ile hacim tükenme çizgisi arasındaki mesafe ne kadar büyükse, o yöndeki hacim o kadar yüksektir.
Trend çizgisi, emir açmak için; tükenme çizgileri ise kar almak için kullanılabilir.

Meravith, grafikteki butonları içerir, bu da çalışmayı çok daha kolay ve hızlı hale getirir — tüm temel işlevler doğrudan grafikten açılıp kapatılabilir. Her butonun işlevi şunlardır:

DEV – Destek çizgisinden çift sapmayı gösterir, trend içindeki yüksek hacim durumunda ek destek seviyesi olarak kullanılabilir.
Eq – Hacim dengesi çizgisi. Piyasa likidite çizgisidir. Yükseliş hacmi, düşüş hacmine eşittir.
CH – Yapının daha iyi görselleştirilmesi için tam destek kanalını gösterir.
MID – Hareketin ortasını (50%) ve 0% ile 100% seviyelerini işaretler.
Vd – Ortalama ile karşılaştırıldığında olağanüstü yüksek hacim sapmasına sahip mumları vurgular.
% – Yükseliş ve düşüş kanallarını yüzde (%) olarak karşılaştırır.
MFT – Bu butona (Multi Time Frame) basın ve ardından tüm zaman dilimlerini geçin. Gösterge, tüm likidite seviyelerini otomatik olarak hesaplar ve seçtiğiniz zaman diliminde gösterir. Her zaman dilimi kendi likidite seviyesini ve üst zaman dilimlerinin seviyelerini gösterir. Alt zaman dilimlerinin seviyeleri gösterilmez. Buton, bu seviyeleri gösterip gizlemenizi sağlar.
A – Analysis. Bu buton, göstergenin piyasaya yönelik ürettiği metin analizini gösterir veya gizler.
ON / OFF – Göstergenin tamamını açar veya kapatır.

MT4, MT5 ve TradingView için mevcuttur.

Öneriler:

Döviz çiftleri: Tüm çiftler, tüm piyasalar
Zaman dilimi: Tüm zaman dilimleri
Minimum depozito: Minimum depozito yok
Hesap türü: Sınırlama yok
Brokerler: Sınırlama yok

Satın almadan önce:

Lütfen MetaTrader test cihazında test edin. Herhangi bir sorunuz olursa, MQL5 profilim üzerinden bana mesaj gönderebilirsiniz.
Satın alma sonrası tam destek ve bonus materyaller mevcuttur.

Değerlendirmeler 3
igivaka
93
igivaka 2026.02.20 16:58 
 

A deep understanding of forex, the philosophy of forex and life, translated into an understandable, easily applicable, profitable, and underpriced Meravith indicator (in fact, a complete system). On top of that, you get a dedicated, friendly, knowledgeable, and always available author ready to help.

zeke21t2
421
zeke21t2 2026.02.14 18:32 
 

The Meravith and the Transaction Speed ​​are two of the three best indicators I know. They integrate three perspectives: ΔP (price change), ΔV (trading volume change), and ΔT (time change), accurately analyze the market, and are designed to be intuitively applicable to actual trading. It's fascinating to watch the price move exactly as the indicators suggest. Despite their intuitive interface, both indicators are incredibly deep, and your research can make them even more useful. Winning EAs are great, but winning through discretionary trading is even better, right? If that sounds like you, I highly recommend them. The author is a very honest and kind person, and I admire his dedication to market research.

Mase
1739
Mase 2025.10.24 05:51 
 

one of the best tools i have ever used, highly recommend it. Ivan spends a lot time improving it consistently and is highly supportive!

Önerilen ürünler
Gösterge, tarihsel olanlarla karşılaştırılabilecek güncel teklifler oluşturur ve bu temelde bir fiyat hareketi tahmini yapar. Gösterge, istenen tarihe hızlı navigasyon için bir metin alanına sahiptir. Seçenekler: Sembol - göstergenin göstereceği sembolün seçimi; SymbolPeriod - göstergenin veri alacağı dönemin seçimi; GöstergeRenk - gösterge rengi; Ters - doğru tırnakları tersine çevirir, yanlış - orijinal görünüm; Sonraki, tarihi girebileceğiniz ve 'enter' tuşuna basarak hemen atlayab
Blahtech Market Profile
Blahtech Limited
4.53 (15)
Was: $249  Now: $99   Market Profile defines a number of day types that can help the trader to determine market behaviour. A key feature is the Value Area, representing the range of price action where 70% of trading took place. Understanding the Value Area can give traders valuable insight into market direction and establish the higher odds trade. It is an excellent addition to any system you may be using. Blahtech Limited presents their Market Profile indicator for the MetaTrader community. Ins
BoxChart MT4
Evgeny Shevtsov
4.4 (5)
The market is unfair if only because 10% of participants manage 90% of funds. An ordinary trader has slim changes to stand against these "vultures". This problem can be solved. You just need to be among these 10%, learn to predict their intentions and move with them. Volume is the only preemptive factor that faultlessly works on any timeframe and symbol. First, the volume appears and is accumulated, and only then the price moves. The price moves from one volume to another. Areas of volume accumu
Blahtech Supply Demand
Blahtech Limited
4.58 (36)
Was: $299  Now: $99   Supply Demand uses previous price action to identify potential imbalances between buyers and sellers. The key is to identify the better odds zones, not just the untouched ones. Blahtech Supply Demand indicator delivers functionality previously unavailable on any trading platform. This 4-in-1 indicator not only highlights the higher probability zones using a multi-criteria strength engine, but also combines it with multi-timeframe trend analysis, previously confirmed swings
İşlem hacimlerine ilişkin okumaları hesaplayan teknik bir gösterge. Histogram biçiminde, ticaret enstrümanının hareket gücünün birikimini gösterir. Yükseliş ve düşüş yönleri için bağımsız hesaplama sistemlerine sahiptir. Herhangi bir ticaret enstrümanı ve zaman dilimi üzerinde çalışır. Herhangi bir ticaret sistemini tamamlayabilir. Gösterge değerlerini yeniden çizmez, sinyaller mevcut mum üzerinde görünür. Kullanımı kolaydır ve grafiği yüklemez, ek parametre hesaplamaları gerektirmez. Değiştiril
Description The Market Profile & Volume Profile Indicator is a powerful technical analysis tool designed to visualize market activity and price distribution over specific timeframes. Unlike standard technical indicators that focus solely on price over time, this indicator organizes price data to show where the market spent the most time (TPO) and where the most volume was traded (Volume Profile). It automatically calculates and displays key structural levels such as the Point of Control (POC) ,
Price vs Vwap
Pieter Gerhardus Van Zyl
Check out my German Pro Signal - https://www.mql5.com/en/signals/2354346 Price vs VWAP is a clean, non-repainting indicator that compares raw market price directly against a rolling Volume Weighted Average Price (VWAP) over a configurable time window. It plots two lines in a separate window: the real closing price and a dynamically calculated VWAP based on recent volume and price interaction. By adapting the VWAP lookback to the chart timeframe, it delivers a clear view of value versus executio
The   Visual Volatility Clustering   indicator clusters the market based on volatility. The indicator does not redraw and gives accurate data, does not use closing prices. Uses the opening prices or the highs or lows of the previous completed bar. Therefore, all information will be clear and unambiguous. The essence of the indicator is to divide the price market into certain areas according to a similar type of volatility. This can be done in any way. In this example, the indicator is configure
MarketProfile EForex
Veridiana Adorno Kendrick
Market Profile Shows where the price has spent more time, highlighting important levels that can be used in trading. It is a powerful tool which is designed to take the fundamental components which comprise every market; price/volume/time, and visually display their relationship in real-time as the market develops for a pre-determined time period. Very powerful tool!
VPPD:Ваш «Рентген» для графика. Простыми словами о сложном Представьте, что рынок — это большое здание. Обычные графики показывают вам только его фасад (цену). **VPPD** — это инструмент, который показывает вам чертежи несущих конструкций и подсчитывает, сколько людей зашли через парадный вход, а сколько вышли через черный. Это индикатор для MetaTrader 4, который показывает, где на самом деле находятся деньги крупных игроков и кто сейчас рулит рынком: покупатели или продавцы.   В чем суть
The Magneto Volume Trigger indicator is designed for determining the volume confirmed by the candlestick pattern and predicting the trend tendency. Indicator setup and use The calculation of values is affected by two parameters - Period and Gate . The lower the value of Gate , the higher the sensitivity of the indicator. Period allows making a sample of data for the specified number of candles. The lower the value of Period , the more the indicator is adapted to the current market conditions. I
Volume Compair
Thiago Pereira Pinho
Professional Cumulative Delta & Volume Median Indicator Track   real buying/selling pressure   with this powerful volume analysis tool. The   Volume Compare Indicator   combines   Cumulative Delta   and   Volume Medians   to help you identify institutional activity, imbalances, and potential reversals. Key Features: Cumulative Delta Histogram   – Visualizes net buying vs. selling volume in real-time. Buy/Sell Volume Medians   – Horizontal lines showing average buy & sell volume levels. Smart Vo
Market Profile 3
Hussien Abdeltwab Hussien Ryad
3 (2)
Market Profile 3 MetaTrader 4 indicator  — is a classic Market Profile implementation that can show the price density over time, outlining the most important price levels, value area, and control value of a given trading session. This indicator can be attached to timeframes between M1 and D1 and will show the Market Profile for daily, weekly, monthly, or even intraday sessions. Lower timeframes offer higher precision. Higher timeframes are recommended for better visibility. It is also possible t
FREE
Dynamic Trend Sniper MT4
Vincent Georges David Ferrier
Trade Like an Institution. Protect Like a Professional. Early Sniper Access: Limited Launch Offer! Get ready to elevate your trading precision. We are offering an exclusive, highly limited launch price for the first Dynamic Trend Sniper users. Our Unbeatable Launch Offer: First 10 Snipers Only: $69 (Full lifetime access + all v1.x updates) Standard Retail Price (After 10 Purchases): $129 Why Act Now? This is not just a discount; it's a strategic entry point. We are committed to rewarding o
PZ Harmonacci Patterns
PZ TRADING SLU
3.17 (6)
Trade smarter, not harder: Empower your trading with Harmonacci Patterns This is arguably the most complete harmonic price formation auto-recognition indicator you can find for the MetaTrader Platform. It detects 19 different patterns, takes fibonacci projections as seriously as you do, displays the Potential Reversal Zone (PRZ) and finds suitable stop-loss and take-profit levels. [ Installation Guide | Update Guide | Troubleshooting | FAQ | All Products ] It detects 19 different harmonic pric
The "MR Volume Profile 4" indicator is a charting tool that displays trading volume at different price levels rather than time intervals. A key concept in volume profile is the point of control (POC)—the price level with the highest volume traded during the session or time range. While tools like VWAP or OBV provide volume trends, the "MR Volume Profile 4" indicator offers granular detail about where the most market activity occurs at specific price levels. This makes it a more precise tool for
VR Grid
Vladimir Pastushak
5 (3)
VR Izgara göstergesi, kullanıcı tanımlı ayarlarla grafiksel bir ızgara oluşturmak için tasarlanmıştır . Standart ızgaradan farklı olarak, VR Izgarası dairesel seviyeler oluşturmak için kullanılır. Kullanıcının seçimine bağlı olarak tur seviyeleri arasındaki adım isteğe bağlı olabilir. Ek olarak, diğer göstergeler ve yardımcı programlardan farklı olarak VR Grid, zaman dilimi değiştiğinde veya terminal yeniden başlatıldığında bile ızgaranın konumunu korur . Ayarlar, set dosyaları, demo versiyonlar
FREE
MT4 Sürümü: https://www.mql5.com/en/market/product/166784 MT5 Sürümü: https://www.mql5.com/en/market/product/166785 LİKİDİTE PROFİLİ LİKİDİTE PROFİLİ, dinamik bir ısı haritası tarzı profil kullanarak grafikte potansiyel likidite bölgelerini haritalayan görsel bir piyasa yapısı aracıdır. Bu gösterge, geçmiş fiyat hareketlerini ve işlem hacmini analiz eder ve ardından likiditenin muhtemelen yoğunlaştığı fiyat alanlarını vurgular. Şunları çizer: Likidite çizgileri (potansiyel tepki/süpürme sevi
UPD1 Profile Levels
Vitaliy Kuznetsov
5 (6)
Gösterge, belirtilen sayıda çubuk için çalışma histogramında maksimum ve minimum fiyat hacminin (piyasa profili) seviyelerini bulur.   Kompozit profil. Histogramın yüksekliği tamamen otomatiktir ve herhangi bir enstrümana ve zaman dilimine uyarlanabilir. Yazarın algoritması kullanılır ve bilinen analogları tekrarlamaz. İki histogramın yüksekliği yaklaşık olarak mumun ortalama yüksekliğine eşittir. Akıllı uyarı (akıllı uyarı), hacim seviyesine ilişkin fiyatı bildirmenize yardımcı olur. Konsept
It will be the best tool for you to make a profit! Through unique algorithms You're going to see an amazing amount of right trading signals Make huge profits every day and realize more possibilities!   Like the car no money to buy it, the love of the girls dare not to pursue?Or the credit card bill is not paid, the rent does not have the extra money to settle?Or are you fed up with being bossed around by your boss and Hope to get more people's respect?Can't afford to buy the things you want ? wa
AW Candle Patterns MT4
AW Trading Software Limited
AW Mum Kalıpları göstergesi, güçlü bir mum kalıbı tarayıcı ile birleştirilmiş gelişmiş bir trend göstergesinin birleşimidir. En güvenilir otuz mum kalıbını tanımak ve vurgulamak için kullanışlı bir araçtır. Ek olarak, renkli çubuklara dayalı güncel bir trend analizörüdür.       yeniden boyutlandırılabilen ve konumlandırılabilen eklenti çoklu zaman çerçevesi trend paneli. Trend filtrelemeye bağlı olarak kalıpların görünümünü ayarlamak için benzersiz bir yetenek. Avantajlar: Mum desenlerini kolayc
Advance Currency Meter is a currency meter that detects strong market trends. This indicator is good for scalping, intraday trading and swing trading. The indicator will detect short term to long term market trends. This will give you good insight which currencies are best to trade as of the moment. Note : Kindly contact me before you make any purchases. This won't work on your account without my permission. Note :   Works well with my MACD Currency Strength Meter
The Visual Volatility Clustering indicator clusters the market based on volatility. The indicator does not redraw and gives accurate data, does not use closing prices. Uses the opening prices or the highs or lows of the previous completed bar. Therefore, all information will be clear and unambiguous. The essence of the indicator is to divide the price market into certain areas according to a similar type of volatility. This can be done in any way. In this example, the indicator is configured fo
Simply The Best Pro
Szymon Palczynski
5 (1)
This indicator displays the histogram and arrows on chart. When Simple The Best Pro are placed on a chart, they identify the trend.  The color of may be blue or red. The blue color stands for upside moves and the red color stands for downside trends. The indicator offers to set Stop Loss (SL) and  Take Profit (TP)  setting. The default value is ATR. Indicator has automatic optimization. The STB is a unique indicator that shows the tendency (button Bars) of a particular signals. The STB tells us
VolumeProfile
Robert Hess
3.8 (5)
Descption: The Volume Profile displays detailed informations of historical trading activities at certain price levels (Market Profile). So you can locate the areas with the best prices in the market and get an advantage about other market participants. Features: Customizable Volume Profile / Market Profile Shows the "fair" Value Area with 70% of all Volume Shows critical low volume zones Shows VPOC, VAL and VAH Points Works on all timeframes Also available for MT5 ( https://www.mql5.com/en/mark
The indicator analyzes the change in the minimum and maximum prices of the previous bars fixing the entrance of the big players. If the change (delta) increases, a signal is displayed on the graph in the form of an arrow. At the same time, virtual trade on history is carried out. In case of a repeat of the signal, the positions are increased (refilling). Thus the lot of positions can differ. The results of virtual trading in the form of losses / losses, profitability, drawdown and transaction li
VR ATR Pro
Vladimir Pastushak
4.33 (6)
VR ATR Pro , önceki işlem dönemlerinin istatistiksel analizine dayalı olarak hedef seviyeleri belirlemek için tasarlanmış bir teknik göstergedir. Seçilen bir zaman dilimindeki ortalama fiyat hareketinin matematiksel hesaplamasına dayanır. İstatistiğe Dayalı Gösterge Çalışma Prensibi Göstergenin çalışması, fiyatın günlük davranışının gözlemlenmesine dayanır: her işlem dönemi belirli bir hareket genliği ile karakterize edilir — fiyat, açılış noktasından hem yukarı hem de aşağı yönde belirli bir pi
SX Supply Demand Zones accurately identifies and draws high-probability Supply and Demand zones using a sophisticated algorithm. Unlike traditional indicators that clutter your chart, this indicator is designed with a focus on performance and a clean user experience. New Unique Feature: Interactive Legend System What truly sets this indicator apart from everything else is the Interactive Control Legend. You have a professional dashboard directly on your chart that allows you to: Show/Hide: Ins
FREE
Ticks Size
Viktor Kolmakov
This indicator displays in a separate window the difference between the number of points which increased the price, and the number of points that decreased the price during the time interval specified in the settings. The time interval for calculation is expressed as the number of bars of the chart the indicator is attached to. This approach allows you to evaluate the movement direction (growth or fall) of the instrument's price, the strength of the movement and the size of the movement in point
Bu ürünün alıcıları ayrıca şunları da satın alıyor
Miraculous Göstergesi – Gann Dokuz Kareye Dayalı %100 Tekrarlamayan Forex ve İkili Araç Bu video, Forex ve İkili Opsiyon traderları için özel olarak geliştirilmiş son derece doğru ve güçlü bir ticaret aracı olan Miraculous Göstergesi 'ni tanıtıyor. Bu göstergeyi benzersiz kılan, efsanevi Gann Dokuz Karesi ve Gann Titreşim Yasası 'na dayanmasıdır; bu da onu modern ticarette mevcut en hassas tahmin araçlarından biri yapmaktadır. Miraculous Göstergesi tamamen tekrarlamaz ; yani mum kapandıktan son
Precautions for subscribing to indicator This indicator only supports the computer version of MT4 Does not support MT5, mobile phones, tablets The indicator only shows the day's entry arrow The previous history arrow will not be displayed (Live broadcast is for demonstration) The indicator is a trading aid Is not a EA automatic trading No copy trading function The indicator only indicates the entry position No exit (target profit)  The entry stop loss point is set at 30-50 PIPS Or the front hi
Pulse Scalping Line - an indicator for identifying potential pivot points. Based on this indicator, you can build an effective Martingale system. According to our statistics, the indicator gives a maximum of 4 erroneous pivot points in a series. On average, these are 2 pivot points. That is, the indicator shows a reversal, it is erroneous. This means that the second signal of the indicator will be highly accurate. Based on this information, you can build a trading system based on the Martingale
El indicador "MR BEAST ALERTAS DE LIQUIDEZ" es una herramienta avanzada diseñada para proporcionar señales y alertas sobre la liquidez del mercado basándose en una serie de indicadores técnicos y análisis de tendencias. Ideal para traders que buscan oportunidades de trading en función de la dinámica de precios y los niveles de volatilidad, este indicador ofrece una visualización clara y detallada en la ventana del gráfico de MetaTrader. Características Principales: Canal ATR Adaptativo: Calcula
F-16 Uçak Göstergesini tanıtıyoruz, ticaret deneyiminizi devrimleştirmek için tasarlanmış son teknoloji bir MT4 aracı. F-16 savaş uçağının eşsiz hızı ve hassasiyetinden ilham alan bu gösterge, finansal piyasalarda eşi benzeri olmayan performans sunmak için ileri algoritmalar ve son teknoloji teknolojileri bir araya getirir. F-16 Uçak Göstergesi ile gerçek zamanlı analiz sunarak yüksek doğruluklu ticaret sinyalleri üretirken rekabetin üzerine çıkacaksınız. Dinamik özellikleri, farklı varlık sınıf
PairMaster Buy Sell Arrow Indicator for MT4 Trade Reversals Like a Pro — Catch Every Swing Point with Precision The PairMaster Buy Sell Arrow Indicator is a powerful MetaTrader 4 tool built to identify high-probability swing trading opportunities . Designed for traders who value accuracy, clarity, and simplicity, PairMaster detects key market turning points and plots intuitive buy and sell arrows directly on your chart. Key Features Accurate Swing Point Detection – Automatically identifies ma
The Hurricane Indicator
Paul Nicholas Clevett
5 (1)
Currently switched to the 4 hour chart - but use other time frames for confirmation. :-)  I change my main time frame based on the market movement at the time. The Hurricane Forex Indicator is a multi time frame indicator that includes such things as Trade Notifications, Trade Calculator, Momentum Indicator, risk reward and much more. We have a free Trade room for our users as well. Please check out the video for full details of how this indicator works as it has over 15 years worth of developme
Everyone who purchases the Scalping signals M1 indicator receives a FREE BONUS — a fully automated Expert Advisor that trades based on the indicator’s signals. The indicator shows the arrows — the robot can execute the trades for you, following all signals and risk-management rules. Scalping signals M1 – a ready-made trend-following entry system for M1 Scalping signals M1 is an indicator that turns your chart into a clear action map: a colored trend channel shows the direction of the market, and
Bomb Bank Signal
Igor Pereira Calil
5 (1)
Bomb Bank Signal: Your Trusted Indicator for MetaTrader 4 The Bomb Bank Signal is a powerful indicator for MetaTrader 4, designed to identify the most relevant trends in the financial market. If you are looking for a tool that accurately anticipates movements, Bomb Bank is the ally you need. How it Works: This indicator combines three distinct methods – volume analysis, candle closes and symmetrical trend – to detect and signal buying and selling opportunities. Bomb Bank is like a "bomb" whe
BinaryIndicator is a highly accurate indicator for trading binary options. It shows excellent results in scalping. This indicator is based in multifactor analysis of trend indicators, as well as confirmation oscillators, which in the end gives an increased accuracy of signals. Advantages of the indicator Increased accuracy of signals. Excellent results when trading binary options with a short expiration time from M30 to M1 . It works on any timeframes. Works with any trade symbols. Parameters
Rtc ML Ai | Predictor CORE MACHINE LEARNING ENGINE Adaptive ML Market Predictor – Multi-Bar Trend & Candle Forecast What This Indicator Does This indicator is a  real-time market prediction engine  designed to analyze price behavior and estimate  future market tendencies . Unlike conventional indicators, this system  does not rely on static parameters or historical curve-fitting , but adapts its internal state dynamically during live market operation. Instead of using static rules, the indic
ConfluencePro v2.0 – Ultimate Confluence Indicator for Binary Options & Forex Professional Multi-Filter Signal System with Dashboard, News Filter & Real-Time Statistics ConfluencePro v2.0 is the most advanced confluence-based indicator ever released on the MQL5 Market. It combines 17+ professional filters (Trend, Smart Money Concepts, Market Structure, Divergence, MTF Confirmation, News Events, Volume, Regime Detection and more) into a single, easy-to-read confluence score (0–100%). Only the hi
FFx Engulfing Setup Alerter gives trade suggestions with Entry, Target 1, Target 2 and StopLoss. Below are the different options available: Entry suggestion - pips to be added over the break for the entry 3 different options to calculate the SL - by pips, by ATR multiplier or at the pattern High/Low 3 different options to calculate the 2 TPs - by pips, by ATR multiplier or at Risk/Reward Offset the dashboard - any place on the chart Remove the suggestion once the price reached the SL line Lines
FFx InsideBar Setup Alerter gives trade suggestions with Entry, Target 1, Target 2 and StopLoss. Below are the different options available: Entry suggestion - pips to be added over the break for the entry Minimum candle size - to avoid too close buy/sell entry suggestions 3 different options to calculate the SL - by pips, by ATR multiplier or at the pattern High/Low 3 different options to calculate the 2 TPs - by pips, by ATR multiplier or at Risk/Reward Offset the dashboard - any place on the c
FFx OutsideBar Setup Alerter gives trade suggestions with Entry, Target 1, Target 2 and StopLoss. Below are the different options available: Entry suggestion - pips to be added over the break for the entry. 3 different options to calculate the SL - by pips, by ATR multiplier or at the pattern High/Low. 3 different options to calculate the 2 TPs - by pips, by ATR multiplier or at Risk/Reward. Offset the dashboard - any place on the chart. Remove the suggestion once the price reached the SL line.
FFx PinBar Setup Alerter gives trade suggestions with Entry, Target 1, Target 2 and StopLoss. Below are the different options available: Entry suggestion - pips to be added over the break for the entry Minimum candle size - to avoid too small candles 3 different options to calculate the SL - by pips, by ATR multiplier or at the pattern High/Low 3 different options to calculate the 2 TPs - by pips, by ATR multiplier or at Risk/Reward Offset the dashboard - any place on the chart Remove the sugges
Automatic, live & interactive picture of all trendlines. Assign push, email and sound alerts to the lines of your choice and be informed about price rollback, breakout, rollback after breakout, number of rollbacks, line expiration by double breakout. Correct, drag or delete the lines and interactively tune the line system. https://youtu.be/EJUo9pYiHFA . Chart examples https: //www.mql5.com/en/users/efficientforex Price Interaction Events All events are effective immediately and only after one
The purpose of this new version of the MT4 standard indicator provided in your platform is to display in a sub-window multiple timeframes of the same indicator with its divergences. See the example shown in the picture below. But the display isn't like a simple MTF indicator. This is the real display of the indicator on its timeframe. Here's the options available in the FFx divergences indicator: Select the timeframes to be displayed (M1 to Monthly) Define the width (number of bars) for each tim
The purpose of this new version of the MT4 standard indicator provided in your platform is to display in a sub-window multiple timeframes of the same indicator with its divergences. See the example shown in the picture below. But the display isn't like a simple MTF indicator. This is the real display of the indicator on its timeframe. Here's the options available in the FFx divergences indicator: Select the timeframes to be displayed (M1 to Monthly). Define the width (number of bars) for each ti
The FFx Dashboard MTF alerter will show you on a single chart all the timeframes (M1 to Monthly) with their own status for the indicator. 2 Alert Options: Single timeframe: each selected timeframe alert separately when a signal occurs Multi timeframes: all selected timeframes must agree for an alert to be triggered Both options have an input to select the timeframes to be used for the alert(s). How to Understand the Status: Green/Red square: histogram above/below 0 line Green square + Red bord
The FFx Dashboard MTF alerter will show you on a single chart all the timeframes (M1 to Monthly) with their own status for the indicator. 2 Alert Options: Single timeframe: each selected timeframe alert separately when a signal occurs Multi timeframes: all selected timeframes must agree for an alert to be triggered Both options have an input to select the timeframes to be used for the alert(s). How to understand the status: Green/Red square: RSI above/below 50 line Green square + Red border: R
The FFx Dashboard MTF alerter will show you on a single chart all the timeframes (M1 to Monthly) with their own status for the indicator. 2 Alert Options: Single timeframe: each selected timeframe alert separately when a signal occurs Multi timeframes: all selected timeframes must agree for an alert to be triggered Both options have an input to select the timeframes to be used for the alert(s). How to understand the status: Green/Red square: Stoch above/below 50 line Green square + Red border:
The FFx Dashboard MTF alerter will show you on a single chart all the timeframes (M1 to Monthly) with their own status for the indicator. 2 Alert Options: Single timeframe: each selected timeframe alert separately when a signal occurs Multi timeframes: all selected timeframes must agree for an alert to be triggered Both options have an input to select the timeframes to be used for the alert(s). How to understand the status: Green/Red square: Price above/below Cloud (Kumo) Green square + Red bo
The FFx Dashboard MTF alerter will show you on a single chart all the timeframes (M1 to Monthly) with their own status for the indicator. 2 Alert Options: Single timeframe: each selected timeframe alert separately when a signal occurs Multi timeframes: all selected timeframes must agree for an alert to be triggered Both options have an input to select the timeframes to be used for the alert(s). How to understand the status: Green/Red square: MA pointing Up/Down Green square + Red border: MA po
The FFx Dashboard MTF alerter will show you on a single chart all the timeframes (M1 to Monthly) with their own status for the indicator. 2 Alert Options: Single timeframe: each selected timeframe alert separately when a signal occurs. Multi timeframes: all selected timeframes must agree for an alert to be triggered. Both options have an input to select the timeframes to be used for the alert(s). How to understand the status: Green square: Price above PSAR Red square: Price below PSAR Options
The FFx Dashboard MTF alerter will show you on a single chart all the timeframes (M1 to Monthly) with their own status for the indicator. 2 Alert Options: Single timeframe: each selected timeframe alert separately when a signal occurs Multi timeframes: all selected timeframes must agree for an alert to be triggered Both options have an input to select the timeframes to be used for the alert(s). How to understand the status: Green/Red square: CCI above/below levels (ie. 100/-100) Grey square: C
The FFx Dashboard MTF alerter will show you on a single chart all the timeframes (M1 to Monthly) with their own status for the indicator. 2 Alert Options: Single timeframe: each selected timeframe alert separately when a signal occurs Multi timeframes: all selected timeframes must agree for an alert to be triggered Both options have an input to select the timeframes to be used for the alert(s). How to understand the status: Green/Red square: ADX above level Grey square: ADX below level Red bor
Yazarın diğer ürünleri
Meravith MT5
Ivan Stefanov
5 (1)
Göstergе, herhangi bir noktadan hacmi analiz eder ve bu hacim için piyasanın tükeniş seviyelerini hesaplar. Meravith’in ana çizgileri: Boğa hacim tükeniş çizgisi – hedef olarak kullanılır. Ayı hacim tükeniş çizgisi – hedef olarak kullanılır. Trend çizgisi – piyasa trendini gösterir. Piyasanın boğa mı ayı mı olduğuna bağlı olarak rengi değişir ve trend desteği görevi görür. Nasıl kullanılır: Mor dikey çizgiye çift tıklayın ve istediğiniz konuma taşıyın. Her şeyi analiz edebilirsiniz – trendleri v
Meravith AUTO
Ivan Stefanov
5 (1)
Meravith Auto, Meravith ticaret sisteminin otomatik bir versiyonudur. Gösterge, rengini değiştiren bir trend çizgisinden oluşur. Yükseliş trendindeyken yeşil, düşüş trendindeyken kırmızıdır. Bu, trendin destek çizgisidir. Boğa hacminin ayı hacmine eşit olduğu bir likidite çizgisi. Üçlü boğa sapma çizgisi. Üçlü ayı sapma çizgisi. Yüksek hacmi gösteren mor ve mavi noktalar. Mor nokta, ortalama hacmin iki sapma üstünde hacmi gösterirken, mavi nokta iki sapmayı gösterir. Nasıl kullanılır? Trend çizg
Horizont
Ivan Stefanov
Horizont, giriş noktası, Hedef 1, Hedef 2 ve Stop Loss dahil olmak üzere eksiksiz bir işlem kurulumu sağlayan bir ticaret sistemidir ve tüm seviyeler otomatik olarak hesaplanır. Sistem, piyasanın zirve ve diplerini otomatik olarak tespit eder ve bunları mevcut trendi tanımlamak için birleştirir. Hangi trend üzerinde işlem yapmak istediğinizi seçersiniz ve Horizont buna uygun giriş, hedef ve stop seviyelerini oluşturur. Sistem, otomatik risk yönetimi içerir. Hesap bakiyenizi kontrol eder, riski
Meravith Scanner
Ivan Stefanov
5 (1)
MERAVITH SCANNER, MetaTrader 5 için profesyonel bir finansal piyasa göstergesidir ve birden fazla analiz aracını tek bir entegre sistemde birleştirir. Tüm hesaplamaları, özel hacim ağırlıklı ortalama fiyat (VWAP) metodolojisini kullanarak otomatik olarak gerçekleştirir ve subjektif yorumları tamamen ortadan kaldırır. Bu gösterge, tüm varlık sınıflarında (Forex, Hisseler, Endeksler, Emtialar, Kripto Paralar) ve M1’den Aylık’a kadar tüm zaman dilimlerinde çalışır. Temel prensip, fiyatın hacmi taki
RSI Divergence Pulse, diverjans algılama, çoklu zaman dilimi analizi ve görsel araçları tek bir hafif uygulamada birleştiren kapsamlı bir RSI göstergesidir. Otomatik olarak Düzenli ve Gizli diverjansları tanımlar, canlı Çoklu Zaman Dilimi RSI paneli gösterir, OB/OS bölgelerini görsel tanıma için doldurur, fiyat grafiğinde ve RSI alt penceresinde diverjans çizgileri çizer, Al/Sat okları yerleştirir ve gerçek zamanlı uyarılar sağlar. Özellikler Color-Coded RSI Line RSI çizgisi mevcut bölgesine gö
MACD divergency
Ivan Stefanov
4.5 (6)
Bu gösterge, fiyat hareketleri ile MACD histogramı arasındaki yükseliş ve düşüş uyumsuzluklarını (divergence) doğru bir şekilde tespit eder. Kullanılan üssel hareketli ortalamalar (EMA) periyotları 5 (hızlı) ve 34 (yavaş), sinyal hattı periyodu ise 5’tir. Gösterge, momentumin zayıfladığı noktaları vurgulayarak muhtemel trend dönüşlerine işaret eder. Doğru uyumsuzluk tespiti kuralları Yükseliş uyumsuzluğu, fiyat daha düşük dipler oluştururken MACD histogramı sıfır çizgisinin üzerinde aynı anda da
FREE
Göstergemiz, piyasada ilgi gösterilen bölgeleri vurgular ve ardından emir birikim bölgelerini gösterir. Büyük ölçekli bir emir defteri (order book) gibi çalışır. Bu, büyük sermaye için geliştirilmiş bir göstergedir. Performansı olağanüstüdür. Piyasada ne tür bir ilgi olursa olsun, onu görürsünüz . (Bu, tamamen yeniden yazılmış ve otomatikleştirilmiş bir versiyondur – artık manuel analiz gerekmez.) İşlem Hızı (Transaction Speed) , piyasada büyük emirlerin nerede ve ne zaman biriktiğini gösteren v
Bu gösterge, MetaTrader 4 ve 5 için etkileşimli bir Elliott Dalga etiketleme aracıdır. Kullanıcının, grafik üzerindeki menüden etiket boyutunu, rengini ve dalga türünü (ABC düzeltmeleri, 5 dalgalı impulslar veya WXY yapıları) seçerek dalga etiketlerini manuel olarak grafiğe yerleştirmesine olanak tanır. Grafikte tek bir tıklamayla, gösterge seçilen fiyat ve zaman noktasına uygun dalga etiketlerini sırasıyla yerleştirir ve yatırımcıların Elliott Dalga yapılarını görsel olarak haritalandırmasına v
FREE
MACD Divergence Pulse — 4 renkli histogram, uyarılar ve gösterge paneli ile akıllı diverjans tarayıcısı. KISA AÇIKLAMA  Otomatik normal & gizli diverjans algılama, 4 renkli dinamik histogram, Al/Sat okları, sinyal etiketleri, gerçek zamanlı panel ve çok kanallı uyarılar içeren profesyonel MACD indikatörü. Her sembol ve zaman diliminde çalışır. TAM AÇIKLAMA MACD Divergence Pul
Meravith Auto, Meravith ticaret sisteminin otomatik bir versiyonudur. Gösterge, rengini değiştiren bir trend çizgisinden oluşur. Yükseliş trendindeyken yeşil, düşüş trendindeyken kırmızıdır. Bu, trendin destek çizgisidir. Boğa hacminin ayı hacmine eşit olduğu bir likidite çizgisi. Üçlü boğa sapma çizgisi. Üçlü ayı sapma çizgisi. Yüksek hacmi gösteren mor ve mavi noktalar. Mor nokta, ortalama hacmin iki sapma üstünde hacmi gösterirken, mavi nokta iki sapmayı gösterir. Nasıl kullanılır? Trend çizg
Gelişmiş momentum osilatörü, daha doğru aşırı alım ve aşırı satım sinyalleri için periyodunu piyasa oynaklığına göre otomatik olarak ayarlar. Çalışma Prensibi: Gösterge, yüksek oynaklıkta kısalan ve düşük oynaklıkta uzayan uyarlanabilir bir periyot hesaplaması kullanır. Bu dinamik ayar, piyasa trend halindeyken daha hızlı sinyaller sağlar ve yatay piyasa koşullarında yanlış sinyalleri azaltır. RSI değeri, bu değişken periyoda göre hesaplanır, bu da onu mevcut piyasa koşullarına daha duyarlı hale
FREE
Bu gösterge, MetaTrader 4 ve 5 için etkileşimli bir Elliott Dalga etiketleme aracıdır. Kullanıcının, grafik üzerindeki menüden etiket boyutunu, rengini ve dalga türünü (ABC düzeltmeleri, 5 dalgalı impulslar veya WXY yapıları) seçerek dalga etiketlerini manuel olarak grafiğe yerleştirmesine olanak tanır. Grafikte tek bir tıklamayla, gösterge seçilen fiyat ve zaman noktasına uygun dalga etiketlerini sırasıyla yerleştirir ve yatırımcıların Elliott Dalga yapılarını görsel olarak haritalandırmasına v
FREE
Fiyatlara dayalı seviyeleri hesaplayan nadir göstergelerden biridir. Bu gösterge zaman dilimlerinden, trendlerden veya piyasa döngülerinden etkilenmez. Şimdiye kadar oluşturulmuş en mantıklı göstergelerden biridir. FIFTY göstergesi artık otomatik bir versiyonla sunuluyor; bu da seviyeleri manuel olarak çizme ihtiyacını ortadan kaldırıyor. Bu versiyon, grafik üzerine günlük, haftalık, aylık ve yıllık seviyeleri otomatik olarak çizer; böylece hem doğruluk sağlanır hem de zaman kazandırır. Ayrıca,
Imbalance Pro
Ivan Stefanov
5 (4)
Gösterge, seçilen bir dönem boyunca boğalar ve ayılar arasındaki dengesizliği ölçer ve iki nokta arasında düz bir çizgi gösterir. Boğalar ayılardan daha fazla hacme sahipse, çizgi yeşile döner.  Ayılar daha fazla hacme sahipse kırmızı olur. Çizgi ayrıca hacimdeki yüzde farkını da gösterir. Gösterge aynı verileri ayrı bir pencerede gösterir. Bölünmüş hacmi de görebilirsiniz. Göstergenin iki modu vardır. Bu amaçla, sol üstte bir düğme vardır,  - basılı değilse, piyasadaki rastgele bir nokta
Two Snakes
Ivan Stefanov
5 (1)
2 SNAKES birinci sınıf bir scalping sistemidir. Girişler oldukça hassas olduğundan, bu sisteme çok hızlı bir şekilde bağımlı hale gelmeniz muhtemeldir.  2 yılanınız var. Üstlerinde veya altlarında onlara dokunmayan bir mum gördüğünüzde - bu sizin scalping sinyalinizdir. Daha büyük bir zaman çerçevesi kullanırsanız, scalping takip eden trend haline gelebilir. Yılanlar, piyasanın mevcut durumuna göre tam olarak hesaplanır. Hareketli ortalamalar DEĞİLDİR.  Pozisyonunuzu ne kadar süre tutacağ
Separated Volume
Ivan Stefanov
5 (1)
Bu gösterge, forex piyasasındaki tik hacmini etkin bir şekilde yükseliş ve düşüş kategorilerine ayırır. Ek olarak, seçtiğiniz herhangi bir dönem için yükseliş ve düşüş kene hacimlerinin toplamını hesaplama ve görüntüleme işlevselliği sağlar. Grafikteki iki mavi çizgiyi hareket ettirerek dönemi kolayca ayarlayabilir, ticaret ihtiyaçlarınıza göre özelleştirilebilir ve hassas hacim analizine izin verebilirsiniz. Eğer faydalı bulursanız yorumlarınız takdir edilecektir! Mutlu ticaretler!
FREE
Enigmera
Ivan Stefanov
5 (8)
ENIGMERA: Pazarın Kalbi Önemli: MQL5.com demosu Strategy Tester'da çalışır ve Enigmera'nın tüm işlevlerini tam olarak yansıtmayabilir. Daha fazla bilgi için açıklamayı, ekran görüntülerini ve videoyu kontrol edin. Herhangi bir sorunuz varsa, bana mesaj göndermekten çekinmeyin! Göstergenin kodu tamamen yeniden yazılmıştır. 3.0 sürümü, yeni işlevler ekler ve göstergenin başlangıcından bu yana biriken hataları giderir. Giriş Bu gösterge ve ticaret sistemi, finansal piyasalara dikkat çekici bir ya
Levelss
Ivan Stefanov
5 (1)
LEVELSS göstergesi gösterir: - Günlük yükseliş ve düşüş bölgesi. Her gün 00:00 ile 23:59 arasında görülebilir.  - Haftalık yükseliş ve düşüş bölgesi. Her hafta Pazartesi 0:00'dan Cuma 23:59'a kadar görülebilir. - Diğer tüm zaman dilimlerinde görüntülenen belirli bir zaman diliminden özel olarak hesaplanan kanal. Varsayılan olarak, bu, işlem yapmak istediğiniz diğer zaman dilimine değiştirebileceğiniz 4 saatlik zaman dilimidir. Kesintisiz olarak hesaplanır. Ekranın sol üst köşesinde, bölgeleri
GANN Master
Ivan Stefanov
5 (1)
GANN’ın kesin hedefleri, yıllarca test edilmiş yöntemlerine dayanarak hesaplanır ve karşınızda sunulur. Bu araç, ticareti daha kolay ve sezgisel hale getirmek için tasarlanmıştır. Beyaz çizgiyi yukarı veya yeşil çizgiyi aşağı doğru hareket ettirdiğinizde, GANN'ın tekniklerinin ticaret dünyasında neden hala etkili olduğunu hemen anlayacaksınız. GANN’ın stratejileri, piyasa hareketlerini yüksek bir doğrulukla tahmin etmeye odaklanır ve bu araç bu gücü parmaklarınızın ucuna getirir. İster deneyimli
Sense
Ivan Stefanov
5 (2)
SENSE, seçilen GANN yöntemlerini fraktal hesaplamalarla birleştiren otomatik bir sistemdir. Sistem bize işlemlerin nerede açılacağını ve kapatılacağını söyler. Artık karmaşık hesaplamalarla zaman kaybetmenize gerek yok - SENSE sizin için her şeyi yapar. Sadece göstergeyi yükleyin. Temel ilkeler: Fiyat beyaz çizgilerin üzerinde olduğunda piyasa yükselişe geçer Beyaz çizgilerin üzerinde satın alın, altında durun Yeşil çizgiler yukarı yönlü hedeflerdir Fiyat beyaz çizgilerin altında olduğunda
Stefanov
Ivan Stefanov
The indicator displays support and resistance zones defined logically using the MACD. The entire concept is explained in the video, with specific examples shown. The indicator works on any instruments and timeframes. It does not repaint. After placing it on the chart, please go through all the timeframes sequentially, from monthly to 1-minute, so that all lines load correctly. After that, you can start using it. The concept is unique and has not been seen in other systems or indicators.
Fifty Pro
Ivan Stefanov
5 (1)
FIFTY göstergesi artık manuel seviye çizme ihtiyacını ortadan kaldıran otomatik bir versiyonla sunulmaktadır. Bu versiyon, günlük, haftalık, aylık ve yıllık seviyeleri otomatik olarak grafiğe çizer, böylece doğruluk sağlanır ve zaman tasarrufu yapılır. Ayrıca, bu seviyelerin görünürlüğünü açıp kapatmak için düğmeler mevcuttur, bu da tamamen özelleştirilebilir bir kullanım sunar. Manuel kullanımı tercih edenler için, göstergeyi ücretsiz versiyonu hâlâ mevcut olup tam işlevselliğe sahiptir. Böylec
“Naturu”, doğanın simetrisini algoritması olarak kullanan bir manuel indikatördür. Basit bir strateji ve gizli bilgelikle piyasayı fethedin! İndikatörü yüklediğinizde iki çizgi görürsünüz: Üst (Top) ve Alt (Bottom). Bir çizgiye tıklayarak aktifleştirin. Taşımak için, yerleştirmek istediğiniz mumun üzerine tıklayın. Bir tepe noktası ve bir dip noktası belirlersiniz, indikatör otomatik olarak hesaplar: Boğalar ve ayıların çıkarlarının en yakınlaştığı, destek veya direnç rolü oynaması en muhtemel b
MACD Divergence Pulse — 4 renkli histogram, uyarılar ve gösterge paneli ile akıllı diverjans tarayıcısı. KISA AÇIKLAMA Otomatik normal & gizli diverjans algılama, 4 renkli dinamik histogram, Al/Sat okları, sinyal etiketleri, gerçek zamanlı panel ve çok kanallı uyarılar içeren profesyonel MACD indikatörü. Her sembol ve zaman diliminde çalışır. TAM AÇIKLAMA MACD Divergence Puls
RSI Divergence Pulse — Smart Divergence Scanner with MTF Panel, Zone Fill, Alerts & Dashboard SHORT DESCRIPTION Professional RSI indicator with automatic Regular & Hidden divergence detection, color-coded RSI line, Multi-Timeframe panel, OB/OS zone fills, Buy/Sell arrows, signal labels, real-time dashboard, and multi-channel alerts. Works on any symbol and timeframe. FULL DESCRIPTION
Enigmera MT5
Ivan Stefanov
3.67 (3)
ENIGMERA: Piyasanın özü (Bu, manuel bir indikatördür ve bazı özellikler mevcut MetaTrader test ortamı tarafından desteklenmeyebilir) Giriş Bu indikatör ve ticaret sistemi, finansal piyasalara benzersiz bir yaklaşım sunar. ENIGMERA, destek ve direnç seviyelerini hassas bir şekilde hesaplamak için fraktal döngüler kullanır. Gerçek bir birikim (akümülasyon) aşamasını gösterir ve yön ile hedefleri belirtir. Hem trend hem de düzeltme dönemlerinde çalışan bir sistemdir. Nasıl çalışır İndikatörün çoğu
Efsanevi William Gann seviyelerini tam otomatik MT5 indikatöründe. GANN Master, günlük, haftalık ve aylık verilere dayanarak fiyatın en muhtemel dönüş veya trend devamı bölgelerini tespit eder. Temel Özellikler Tek tıkla zaman periyodu: “Daily”, “Weekly” veya “Monthly” düğmesine tıklayarak bugünün, bu haftanın veya bu ayın zonlarını anında çizin Otomatik ve Manuel Modlar Otomatik : GANN Master tüm seviyeleri sizin için hesaplar—manuel girdi gerekmez Manuel : “Top” ve “Bottom” çizgilerini sürükle
SPEKULATOR, önemli destek bölgelerini ve piyasa yönünü belirlemenize yardımcı olan manuel bir ticaret sistemi ve göstergesidir. Basit bir strateji ve gizli bilgiyle piyasayı ustaca yönetin. Grafikte herhangi bir zirve (TOP) ve dip (BOTTOM) seçiyorsunuz, ardından gösterge şunları çizer: Trendinize göre bir destek bölgesi. Yükseliş trendi için yeşil bir bölge, düşüş trendi için kırmızı bir bölge görünür. Destek bölgesinin hassasiyeti, göstergenin ayarlarında ayarlanabilir. Bu bölge, seçtiğiniz tre
Naturu
Ivan Stefanov
5 (1)
“Naturu”, doğanın simetrisini algoritması olarak kullanan bir manuel indikatördür. Basit bir strateji ve gizli bilgelikle piyasayı fethedin! İndikatörü yüklediğinizde iki çizgi görürsünüz: Üst (Top) ve Alt (Bottom). Bir çizgiye tıklayarak aktifleştirin. Taşımak için, yerleştirmek istediğiniz mumun üzerine tıklayın. Bir tepe noktası ve bir dip noktası belirlersiniz, indikatör otomatik olarak hesaplar: Boğalar ve ayıların çıkarlarının en yakınlaştığı, destek veya direnç rolü oynaması en muhtemel b
Filtrele:
igivaka
93
igivaka 2026.02.20 16:58 
 

A deep understanding of forex, the philosophy of forex and life, translated into an understandable, easily applicable, profitable, and underpriced Meravith indicator (in fact, a complete system). On top of that, you get a dedicated, friendly, knowledgeable, and always available author ready to help.

zeke21t2
421
zeke21t2 2026.02.14 18:32 
 

The Meravith and the Transaction Speed ​​are two of the three best indicators I know. They integrate three perspectives: ΔP (price change), ΔV (trading volume change), and ΔT (time change), accurately analyze the market, and are designed to be intuitively applicable to actual trading. It's fascinating to watch the price move exactly as the indicators suggest. Despite their intuitive interface, both indicators are incredibly deep, and your research can make them even more useful. Winning EAs are great, but winning through discretionary trading is even better, right? If that sounds like you, I highly recommend them. The author is a very honest and kind person, and I admire his dedication to market research.

Mase
1739
Mase 2025.10.24 05:51 
 

one of the best tools i have ever used, highly recommend it. Ivan spends a lot time improving it consistently and is highly supportive!

Değerlendirmeye yanıt