Matreshka

5
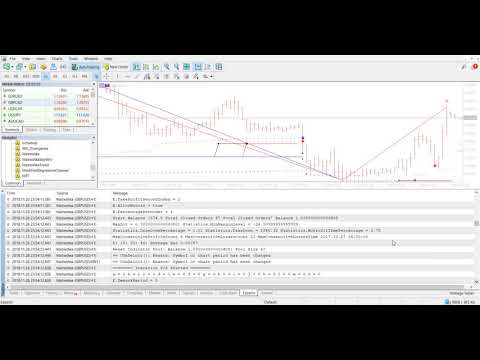
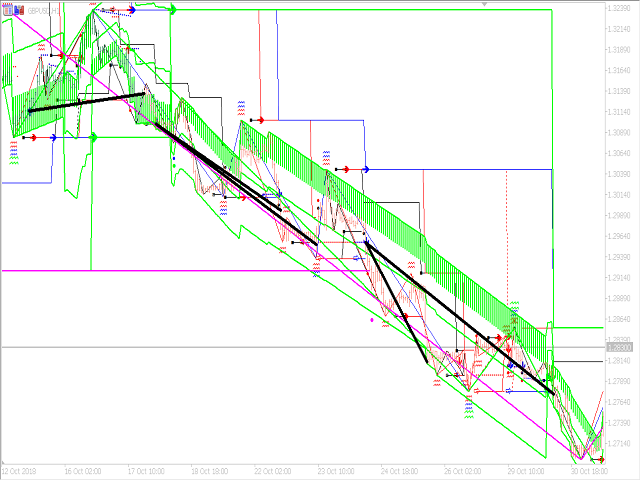
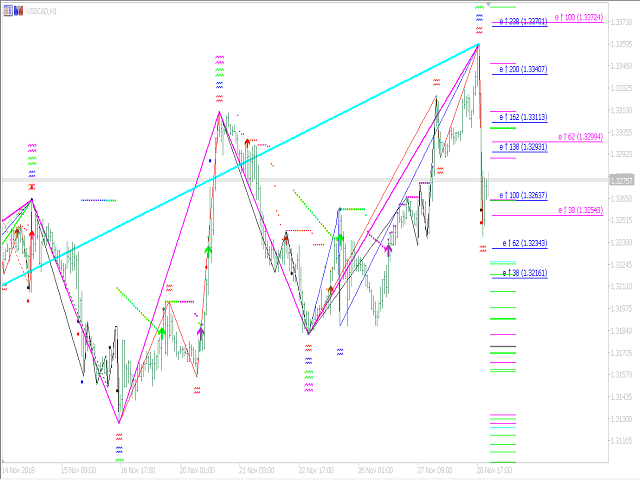
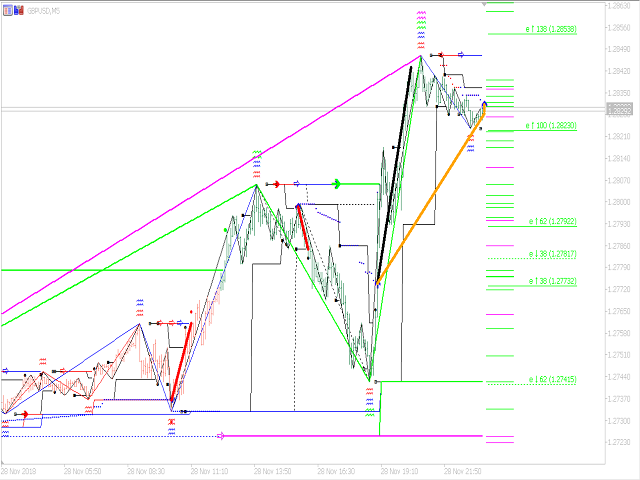
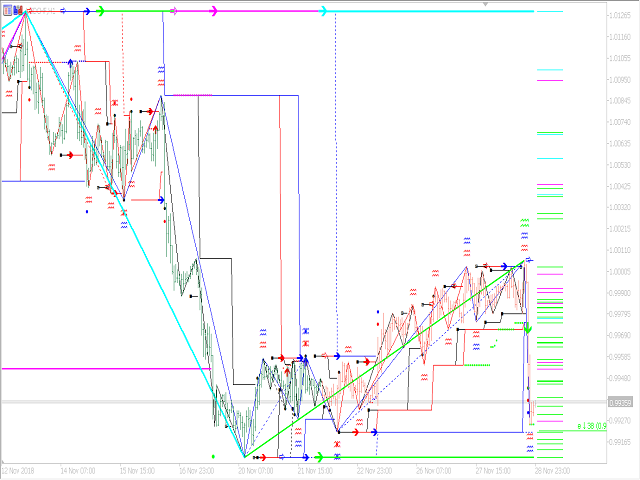
Matreshka self-testing and self-optimizing indicator:
1. Is an interpretation of the Elliott Wave Analysis Theory.
2. Based on the principle of the indicator type ZigZag, and the waves are based on the principle of interpretation of the theory of DeMark.
3. Filters waves in length and height.
4. Draws up to six levels of ZigZag at the same time, tracking waves of different orders.
5. Marks Pulsed and Recoil Waves.
6. Draws arrows to open positions
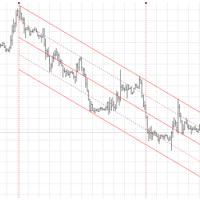
7. Draws three channels.
8. Notes support and resistance levels.
9. Draws three types of Fibonacci meshes.
10. Redraws only the cost on the newest bar, except for the Fibonacci Extension mesh.
11. Has the ability to simulate trade in test and operating modes, as well as has the ability to self-test and self-optimization.


Değerlendirmeler 2
24278
343
24278 2023.08.28 15:54 

perfect tool, with Matreshka you see well where the key pricing points are. Recommended for those who want a "PLUS" in trading.

adonis4ex
6375
adonis4ex 2021.05.30 15:10 

past present future all colliding in a chaotic symphony. i have settled now. i am now one with pi. 3.144 is the answer, i now know. the answer is everywhere it is here. i am now knowing where price goes at all times. there is no I anymore, i have an eye, but not an I. I left and became price, price is constant yet never solid, demanding the supply, with resistance supports the price. there is no more I, myeye sees. matreshka has given me clarity, understanding i had to come to my own

Önerilen ürünler
Introduction to X3 Chart Pattern Scanner X3 Cherart Pattern Scanner is the non-repainting and non-lagging indicator detecting X3 chart patterns including Harmonic pattern, Elliott Wave pattern, X3 patterns, and Japanese Candlestick patterns. Historical patterns match with signal patterns. Hence, you can readily develop the solid trading strategy in your chart. More importantly, this superb pattern scanner can detect the optimal pattern of its kind. In addition, you can switch on and off individu
Gartley Projections D
Oleksandr Medviediev
3 (2)
The indicator identifies the harmonic patterns (XABCD) according to developments of H.M.Gartley ( "Profits in the Stock Market" , 1935г). It projects D-point as a point in the perspective projection (specify ProjectionD_Mode = true in the settings). Does not redraw. When a bar of the working timeframe closes, if the identified pattern point has not moved during Patterns_Fractal_Bars bars, an arrow appears on the chart (in the direction of the expected price movement). From this moment on, the ar
Overview Harmonic Patterns MT5 is a technical analysis indicator designed for the MetaTrader 5 platform. It identifies and displays harmonic price patterns, such as Butterfly, Cypher, Crab, Bat, Shark, and Gartley, in both bullish and bearish directions. The indicator calculates key price levels, including entry, stop loss, and three take-profit levels, to assist traders in analyzing market movements. Visual elements and customizable alerts enhance usability on the chart. Features Detects six ha
Most Elliott Wave tools just draw lines. This one validates every pattern against the 3 cardinal rules — or rejects it. Elliott Wave analysis is one of the most powerful — and most difficult — methods in technical trading. Most indicators fake it. They draw zigzag lines and call them waves without checking a single Elliott Wave rule. Elliott Wave Detector Pro is different. It was built from the ground up to detect, validate, and project Elliott Wave patterns the way a professional analyst would
Harmonic Pattern Hunter
Shingidzano Lesetedi
5 (1)
Harmonic Pattern Hunter Harmonic Pattern Hunter is a technical indicator for MetaTrader 5 that automatically identifies and draws high-probability harmonic patterns directly on the chart. It is designed to assist traders who use harmonic analysis as part of their trading methodology. How It Works The indicator scans historical and live price data for completed XABCD harmonic structures using Fibonacci ratio validation. When a valid pattern is detected, it draws the full pattern geometry, marks t
Elliott Wave MT5
Sathit Sukhirun
5 (1)
Otomatik Elliott Dalga Teorisi 1. Otomatik Dalga Sayımı ve Objektiflik İtki Dalgaları (1-2-3-4-5): Teorik olarak doğru yapıyı göstermek için katı kurallar kullanır. Düzeltme Dalgaları (A-B-C): Trend yönünde işlem fırsatları bulmak için geri çekilmeleri yakalar. 2. Çok Dereceli Analiz (Multi-Degree) 3 seviyeyi aynı anda analiz eder: Minor (Kısa): Hızlı hareketler için. Intermediate (Orta): Ana trend için. Primary (Uzun): Büyük resim için. 3. Hedef Fiyat ve Giriş Fibonacci Projeksiyonu: Bir son
Trade smarter, not harder: Empower your trading with Harmonacci Patterns This is arguably the most complete harmonic price formation auto-recognition indicator you can find for the MetaTrader Platform. It detects 19 different patterns, takes fibonacci projections as seriously as you do, displays the Potential Reversal Zone (PRZ) and finds suitable stop-loss and take-profit levels. [ Installation Guide | Update Guide | Troubleshooting | FAQ | All Products  ] It detects 19 different harmonic pric
"Hunttern harmonic pattern finder" base on the dynamic zigzag with the notification and prediction mode This version of the indicator identifies 11 harmonic patterns and predicts them in real-time before they are completely formed. It offers the ability to calculate the error rate of Zigzag patterns depending on a risk threshold. It moreover sends out a notification once the pattern is complete. The supported patterns: ABCD BAT ALT BAT BUTTERFLY GARTLEY CRAB DEEP CRAB CYPHER SHARK THREE DRIV
The   Fibonacci Confluence Toolkit   is a technical analysis tool designed to help traders identify potential price reversal zones by combining key market signals and patterns. It highlights areas of interest where significant price action or reactions are anticipated, automatically applies Fibonacci retracement levels to outline potential pullback zones, and detects engulfing candle patterns. Its unique strength lies in its reliance solely on price patterns, eliminating the need for user-define
RSI Divergence Risk Target Signals RSI Divergence Risk Target Signals is a MetaTrader 5 indicator that detects confirmed bullish and bearish RSI divergence and combines the signals with optional trend filters, ATR-based Stop Loss levels, three Take Profit targets, alerts and an internal trade statistics dashboard. The indicator compares confirmed RSI pivot structure with corresponding price highs and lows. It is designed to help traders identify momentum divergence while providing a structure
RM Divergence Pro
Mohammadreza Mahdi Mavaddat
5 (1)
RM Divergence Pro - RSI Diverjans ve Yetersizlik Göstergesi: Piyasa yapısına dayalı, yeniden boyanmayan bir RSI sapma göstergesidir. Onaylanmış RSI dalgalanmalarını, fiyat davranışlarını ve yapısal filtreleri kullanarak Düzenli Sapma, Gizli Sapma, Yetersizlik ve Potansiyel Sapmayı tespit eder. Genel bakış: RM Divergence Pro, yapısal mantığa odaklanan RSI tabanlı bir sapma aracıdır. Sapmayı, tükenmeyi ve başarısız devam kalıplarını tespit etmek için fiyat yapısı davranışıyla birlikte onaylanmış R
VibeFox Wolfe Waves — hedef çizgisi ve giriş noktalarıyla 5 noktalı dönüş formasyonu VibeFox Wolfe Waves, MetaTrader 5 için gerçek zamanlı bir formasyon göstergesidir. Fiyat yapısını klasik Wolfe Waves formasyonu için tarar — yakınsayan bir kama oluşturan beş ardışık salınım noktası — formasyon çizgilerini ve EPA hedef çizgisini doğrudan fiyat grafiği üzerine çizer, 5. noktada giriş noktasını işaretler ve tüm kontrolleri tek bir modern etkileşimli panelde toplar. Şekli elle aramak yerine, tamaml
MercariaPattern1-2-3 відстежує рух ціни, знаходить трьоххвильові структури 1-2-3 та підсвічує момент, коли сценарій підтверджується пробоєм ключового рівня. MercariaPattern1-2-3 tracks price movement, detects three-leg 1-2-3 structures and highlights the moment when the scenario is confirmed by a key level breakout. Індикатор збирає локальні свінги в компактну фігуру 0–1–2–3 , чекає підтвердженого пробою та будує стрілку входу з готовими рівнями SL/TP. The indicator combines local swings into a
Overview  Market Structure Analysis Indicator MT5 Structure Analysis Indicator automatically identifies Market Structure based on Smart Money Concepts (SMC). It clearly displays Break of Structure (BoS), Change of Character (CHoCH), Higher Highs, Higher Lows, Lower Highs, and Lower Lows in real-time. Key Features Automatic Market Structure Detection Break of Structure (BoS) - Price breaks previous structure in trend direction Change of Character (CHoCH) - Trend reversal signals Hi
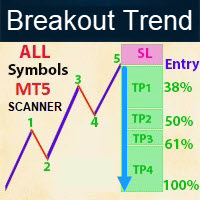
-  Real price is 70$ - 50% Discount (It is 35$ now) Contact me for instruction, any questions! - New Update - Lifetime update free - Non-repaint - I just sell my products in Elif Kaya Profile, any other websites are stolen old versions, So no any new updates or support. Introduction Breakout Trend Scanner indicator works based on the Elliott Wave in technical analysis describes price movements in the financial market that are related to changes in trader sentiment and psychology and finds end o
Monster Harmonics Indicator is a harmonic pattern indicator. It recognizes Gartley, Bat, Crab, Butterfly, Cypher, White Swan, Black Swan, Shark and AB=CD patterns. Projected patterns that are not yet completed are recognized, too. Monster even shows the PRZ (Potential Reversal Zone). Users can add their own user defined patterns to Monster. Besides the current pattern, Monster also shows all patterns in the symbols history. Monster will provide alerts for developing patterns. Introduced by H.M.
The indicator detects and displays М. Gartley's Butterfly pattern. The pattern is plotted by the extreme values of the ZigZag indicator (included in the resources, no need to install). After detecting the pattern, the indicator notifies of that by the pop-up window, a mobile notification and an email. The pattern and wave parameters are displayed on the screenshots. The default parameters are used for demonstration purposes only in order to increase the amount of detected patterns. Parameters z
The Expert Advisor and the video are attached in the Discussion tab . The robot applies only one order and strictly follows the signals to evaluate the indicator efficiency. Pan PrizMA CD Phase is an option based on the Pan PrizMA indicator. Details (in Russian). Averaging by a quadric-quartic polynomial increases the smoothness of lines, adds momentum and rhythm. Extrapolation by the sinusoid function near a constant allows adjusting the delay or lead of signals. The value of the phase - wave s
THV Harmonic Pattern MT5 – Automatic Pattern Detection & Trading Levels Overview THV Harmonic Pattern MT5 is a technical analysis indicator designed to automatically identify potential Harmonic Chart Patterns and display their structures directly on your MetaTrader 5 chart. Using swing high and swing low detection combined with Fibonacci ratio analysis, the indicator identifies potential harmonic formations such as Gartley, Bat, Butterfly, Crab, and AB=CD patterns. It also incorporates an RSI
Harmonic Pattern Scanner — Gartley, Bat, Butterfly, Crab (Auto XABCD Detection) Stop manually plotting Fibonacci retracements on every swing. This indicator scans your chart in real time, identifies X-A-B-C-D structures, and tells you exactly which harmonic pattern is forming — Gartley, Bat, Butterfly, or Crab — with entry, stop loss, and four take-profit targets calculated automatically. What it does Detects confirmed harmonic patterns the moment a D-point swing closes, and previews forming pat
QM Scanner Pro
Shaban Mir Fazlolah Oreynab
QUASIMODO PATTERN SCANNER - Professional Edition                 Automatic Detection of High-Probability Setups        WHAT IS THE QUASIMODO (QM) PATTERN? The Quasimodo Pattern is one of the most reliable and powerful  reversal patterns in technical analysis. Used by professional  traders
Primes Action, bir önceki günün, haftanın ve ayın yüksek ve düşük seviyelerini grafiğinize çizer ve fiyat bu seviyeleri kırdığında gösterir. Her zaman dilimi kendi rengine sahiptir, bu yüzden üç referans kolayca ayırt edilir. Seviyeler nasıl bulunur Bir dönemin tam yükseği veya düşüğü çoğu zaman kısa bir fitildir. Primes Action, tamamlanmış bir önceki dönemin üst sekizde birine ve alt sekizde birine bakar. Her birinde fiyatın en çok zaman geçirdiği seviyeyi çizer. Hesaplama, baktığınız grafiğin
This indicator automatically detects harmonic price patterns on your chart, both bullish and bearish, and shows them as soon as they form, including potential patterns that are still developing. For every pattern it draws the Potential Reversal Zone (PRZ), and for completed patterns it also draws two take-profit and two stop-loss levels. Supported Patterns: Gartley, Bat, Butterfly, Crab, Deep Crab, Shark and Cypher. Each pattern can be switched on or off individually. Key Features: Completed
FREE
Precision trading: leverage wolfe waves for accurate signals Wolfe Waves are naturally occurring trading patterns present in all financial markets and represent a fight towards an equilibrium price. These patterns can develop over short and long-term time frames and are one of the most reliable predictive reversal patterns in existence, normally preceding strong and long price movements. [ Installation Guide | Update Guide | Troubleshooting | FAQ | All Products ] Clear trading signals Amazingly
Smart Pattern AtrShield
Nuno Miguel Costa Tome
Self-learning core – scans the last 500 candles, extracts RSI + MA-slope patterns and builds its own database—no Python, DLLs or external files. Real-time adaptation – each bar updates accuracy scores and votes on the most similar patterns before opening a trade. Volatility-aware risk – every position starts with a stop-loss equal to ATR(14) × 1.5 , automatically wider in fast markets and tighter in calm ones. Ultra-light, 100 % MQL5 – minimal CPU load, works on any broker, any symbol. Full sou
Overview The Market Perspective Structure Indicator is a comprehensive MetaTrader indicator designed to provide traders with a detailed analysis of market structure across multiple timeframes. It identifies and visualizes key price action elements, including swing highs and lows, Break of Structure (BOS), Change of Character (CHOCH), internal structures, equal highs/lows, premium/discount levels, previous levels from higher timeframes, and trading session zones. With extensive customization opt
AutoTrend Pro
Aram Hussein Mohammed
TL Method — Automatic Trendline Detection & Strength Indicator Tired of drawing trendlines manually? TL Method does it for you — automatically detecting, drawing, and scoring trendlines in real time. What it does: Scans up to 1000 bars to find valid support and resistance trendlines Scores each trendline by counting confirmed anchor touches Generates buy/sell signal arrows when price approaches strong trendlines Alerts you via popup, push notification, or sound — with smart cooldown to avoid spa
Renko Plus
Eadvisors Software Inc.
With Renko Plus you can use the features in the Indicator functionality, just add it to the Metatrader5 chart.             The Renko chart is a type of chart, developed by the Japanese, that is constructed using price movement rather than standardized prices and time intervals like most charts. It is believed to be named after the Japanese word for bricks, "renga", as the graphic looks like a series of bricks.             A new brick is created when the price moves a specified pri
Basic Harmonic Pattern MT5
Mehran Sepah Mansoor
4.78 (98)
Bu gösterge, piyasanın tersine dönme noktalarını tahmin eden en popüler Harmonik Kalıpları tanımlar. Bu harmonik modeller, forex piyasasında sürekli tekrar eden ve gelecekteki olası fiyat hareketlerini öneren fiyat oluşumlarıdır /   Ücretsiz MT4 Sürümü Buna ek olarak, bu gösterge yerleşik bir piyasaya giriş sinyalinin yanı sıra çeşitli kar alma ve zararı durdurma sinyallerine de sahiptir. Harmonik formasyon göstergesi kendi başına al/sat sinyalleri sağlayabilse de, bu sinyallerin diğer teknik
FREE
-  Real price is 200$ - Discount (one purchase is 35$ now) Contact me for instruction, any questions! - Lifetime update free - Non-repaint - I just sell my products in Elif Kaya Profile, any other websites are stolen old versions, So no any new updates or support. DESCRIPTION Most supply and demand indicators just draw boxes. Supply and Demand Smart Trading tells you what to do with them. It grades every zone in real time and shows whether the setup is a bounce or a breakout. When everything l
Bu ürünün alıcıları ayrıca şunları da satın alıyor
Boba Analysis Suite
Trade Ready Solutions LLC
5 (2)
Boba Analysis Suite Boba Analysis Suite, MetaTrader 5 için geliştirilmiş bir analiz göstergesidir. Piyasa yapısını, önemli fiyat bölgelerini ve genel piyasa bağlamını tek bir grafik görünümünde bir araya getirir. Trader ve trading eğitmeni olarak edinilen uygulamalı deneyimden yola çıkarak geliştirilmiştir. Piyasanın yönünü değerlendirme, önemli seviyeleri belirleme ve birden fazla zaman dilimini birlikte inceleme gibi adımlardan oluşan sistematik bir analiz sürecini destekler. Piyasa Bağlamını
Zain Gold Scalping
Ahmed Gamal Abdel Nasser Mohamed
A complete price-action analysis tool built around dual independent entry logic, each confirmed against a volatility band, combined with a configurable set of nine optional confirmation filters that let you shape exactly how conservative or aggressive the tool's signals behave. Core Strategy Two independent entry setups, each triggering only when price moves outside a dynamic volatility band — giving two distinct ways to spot potential reversal points, which can be used together or separately.
Azimuth Pro
Ottaviano De Cicco
5 (7)
Azimuth Pro V2: Synthetic Fractal Structure and Confirmed Entries for MT5 Overview Azimuth Pro is a multi-level swing structure indicator by Merkava Labs . Four nested swing layers, swing-anchored VWAP, ABC pattern detection, three-timeframe structural filtering, and closed-bar confirmed entries — one chart, one workflow from micro-swings to macro-cycles. This is not a blind signal product. It is a structure-first workflow for traders who care about location, context, and timing. Halloween P
CGE Trading Suite
Carl Gustav Johan Ekstrom
5 (3)
Institutional-Grade Analytics for MT5 The full analytical edge of a professional trading desk, built into your MT5 chart. A full guided tour walks you through every feature step by step. Standard retail platforms lack the depth required for professional market analysis. The CGE Trading Suite bridges this gap, transforming MetaTrader 5 into a comprehensive workspace. By integrating 18 proprietary modules into a single, unified chart interface, the suite eliminates fragmented analysis. It provide
Merhaba yatırımcılar! Birçok bireysel yatırımcı yavaş web komut dosyaları kullanıyor. Kârlı işlem yapmak için sistematik bir yaklaşım şarttır. Astro AI göstergesi sadece bir grafik üzerindeki görselleştirme değildir. Doğrudan terminal içinde çalışan iki ajandan oluşan gelişmiş bir sinir ağıdır. Sistemin teknik detayları: 1. Ajan 1: Analist (Grafiksel Sinir Ağı – GNN) Piyasa, tek tek fiyat çubuklarından değil, birbirine bağlı verilerden oluşan bir ağdan oluşur. İşlev: Ajan 1, bu karmaşık, d
ARIPoint
Temirlan Kdyrkhan
1 (4)
ARIPoint is a powerful trading companion designed to generate high-probability entry signals with dynamic TP/SL/DP levels based on volatility. Built-in performance tracking shows win/loss stats, PP1/PP2 hits, and success rates all updated live. Key Features: Buy/Sell signals with adaptive volatility bands Real-time TP/SL/DP levels based on ATR Built-in MA Filter with optional ATR/StdDev volatility Performance stats panel (Success, Profit/Loss, PP1/PP2) Alerts via popup, sound, push, or email Cu
RelicusRoad Pro MT5
Relicus LLC
4.96 (25)
İşlemlerinizi tahminle yapmayı bırakın. Ne zaman gireceğinizi, nereden çıkacağınızı ve piyasanın hangi yöne eğildiğini, hepsini tek grafikte görün. RelicusRoad Pro, neredeyse yirmi aracı tek bir göstergede toplar; işlem tarzınıza uyan araçları açarsınız. Net girişler. Net çıkışlar. Her grafikte bir plan. Tanıdık geliyor mu? Alım yaparsınız, bir dakika sonra fiyat aleyhinize döner. Erken kapatırsınız, sonra hareketin sizsiz devam ettiğini izlersiniz. Grafikte beş gösterge, beş farklı cevap. Zarar
Spike Fakeout Detector
Brighton Mufaro Mudzingwa
PainX 400 FAKEOUT DETECTOR MT5 Custom Indicator  ·  Sell-Side Bias  ·  Scalping  ·  RSI(6) Filtered   OVERVIEW   The Spike Fakeout Detector is a non repaint precision technical indicator built exclusively for Crash / PainX synthetic indices on the platform. It is engineered around one of the most consistent and exploitable patterns on this instrument — the false breakout above resistance followed by a sharp price drop. Crash/PainX is a growing index that produces a significant price drop appr
The indicator is designed to close positions on the market in time. For example: to take profits ahead of schedule if the price has not reached TakeProfit, and the market is turning around. The indicator analyzes the momentum, not the trend. He does not give any information about the trend. The indicator is well suited for finding divergence. The Ershov 38 Parrots indicator dynamically adjusts to the market and detects price movement impulses of medium and high amplitude. It almost does not rea
Gem SIGNAL
Shengzu Zhong
5 (1)
GEM Signal Pro GEM Signal Pro, MetaTrader 5 için geliştirilmiş bir trend takip göstergesidir ve daha net sinyaller, daha düzenli işlem kurulumları ve daha pratik risk yönetimini doğrudan grafik üzerinde görmek isteyen yatırımcılar için tasarlanmıştır. Sadece basit bir ok göstermek yerine, GEM Signal Pro işlem fikrinin tamamını daha temiz ve daha okunabilir bir şekilde sunmaya yardımcı olur. Koşullar onaylandığında, gösterge giriş fiyatını, stop loss seviyesini ve take profit hedeflerini grafik ü
MetaTrader 5 için Chimera Volume Gelişmiş Hacim Analizi ve Piyasa Aktivitesi Görselleştirme Chimera Volume, normalleştirilmiş hacim aktivitesini analiz etmek ve dinamik bir görsel çerçeve aracılığıyla piyasa katılımındaki değişiklikleri göstermek için tasarlanmış, MetaTrader 5'e özel bir göstergedir. Gösterge, tick hacim verilerini adaptif normalleştirme algoritmaları kullanarak işler ve hacim yoğunluğu, birikim evreleri ve farklı piyasa koşullarındaki aktivite değişimlerinin yapılandırılmış bir
Meravith Scanner
Ivan Stefanov
5 (3)
MERAVITH SCANNER, MetaTrader 5 için profesyonel bir finansal piyasa göstergesidir ve birden fazla analiz aracını tek bir entegre sistemde birleştirir. Tüm hesaplamaları, özel hacim ağırlıklı ortalama fiyat (VWAP) metodolojisini kullanarak otomatik olarak gerçekleştirir ve subjektif yorumları tamamen ortadan kaldırır. Bu gösterge, tüm varlık sınıflarında (Forex, Hisseler, Endeksler, Emtialar, Kripto Paralar) ve M1’den Aylık’a kadar tüm zaman dilimlerinde çalışır. Temel prensip, fiyatın hacmi taki
TrendMaestro5
Stefano Frisetti
note: this indicator is for METATRADER4, if you want the version for METATRADER5 this is the link:  https://www.mql5.com/it/market/product/108106 TRENDMAESTRO ver 2.5 TRENDMAESTRO recognizes a new TREND from the start, he never makes mistakes. The certainty of identifying a new TREND is priceless. DESCRIPTION TRENDMAESTRO identifies a new TREND in the bud, this indicator examines the volatility, volumes and momentum to identify the moment in which there is an explosion of one or more of these da
Meravith MT5
Ivan Stefanov
5 (3)
MERAVITH, MetaTrader 5 için çok zaman dilimli bir hacim ve likidite göstergesidir; her zaman diliminde trendi, destek ve direnç bölgelerini, girişi, hedefleri ve stop loss seviyesini gösterir. Size piyasanın tam bir likidite haritasını, hedge fon tarzı bir likidite aracını verir ve tüm hesaplamaları kendine özgü bir hacim ağırlıklı ortalama fiyat yöntemiyle otomatik yapar, bu yüzden öznel yorum yoktur. Forex, altın (XAUUSD), endeksler ve kriptoda, her zaman diliminde çalışır. Satın alma sonrası
AriFocus
Temirlan Kdyrkhan
AriFocus - Non-Repainting Buy/Sell Signals AriFocus - one clear signal. AriFocus marks buy and sell signals directly on the chart and suggests a stop-loss level for each one. Every signal is confirmed on bar close and never repaints. - Buy/sell arrows, confirmed on bar close - Suggested stop-loss level for every signal - Trend band and candle coloring to show direction at a glance - 10 ready-made presets, or your own settings (14 calculation methods) - Pop-up, push and email alerts with entr
Cycles Plotter
Edoardo Centorame
Cycles Plotter Hareketli Ortalamalar ve Başlangıç Tarihi ile Özelleştirilebilir Döngüler Göstergesi Cycles Plotter, yalnızca kullanıcının inputuna bağlı olarak tamamen özelleştirilebilir iki sinüzoidal döngü çizen gelişmiş bir teknik göstergedir. Döngüleri otomatik olarak üretmez: tüm döngüler yalnızca kullanıcı tarafından ayarlanan parametrelere göre hesaplanır, traderlara fiyat salınımlarını ve potansiyel trend değişikliklerini incelemek için görsel bir araç sunar, otomatik sinyaller veya tahm
Quantum Momentum Guard (QMG) Breakout and Momentum Indicator for MetaTrader 5 Overview Quantum Momentum Guard (QMG) is a technical indicator for MetaTrader 5 designed to identify potential breakout opportunities by combining momentum analysis, breakout conditions, and mathematical validation. The indicator evaluates market conditions to generate directional signals when its configured criteria are met. It is designed primarily for XAUUSD (Gold) and can also be used on other financial instruments
AriX
Temirlan Kdyrkhan
1 (4)
AriX Indicator for MT5 A powerful trend-following and signal-evaluation tool AriX is a custom MT5 indicator that combines Moving Averages and ATR-based risk/reward logic to generate clear buy/sell signals. It visualizes dynamic SL/TP levels, evaluates past trade outcomes, and displays win/loss statistics in a clean on-chart panel. Key features include: Buy/Sell signals based on MA crossovers ATR-based SL/TP1/TP2/TP3 levels with visual lines and labels Signal outcome tracking with real-time stat
Title:FX-AIEA Supply and Demand Zone Indicator (MT5) — Technical Overview Version: 2.51 | Platform: MetaTrader 5 Introduction Supply and demand zones are considered a core manifestation of institutional order flow, providing a more direct reflection of buying and selling pressure than traditional support/resistance levels. This indicator attempts to automate the identification of high-probability supply and demand zones using an adaptive ZigZag algorithm, reducing the subjectivity and time asso
ORB Seeker MT5
Marcela Goncalves De Oliveira
Ürünün sınırlı sayıda bulunmasını ve kıtlığını korumak için özel fiyat! Sadece 599 dolar! Satın alma işleminden sonra, bonus ORB Seeker EA ve kişisel olarak optimize edilmiş set dosyalarını almak için benimle iletişime geçin. Temiz antrenman seanslarında güvenle mola verin! ORB Seeker MT5, doğruluk, sadelik, esneklik ve net grafik yapısı isteyen yatırımcılar için tasarlanmış profesyonel bir Açılış Aralığı Kırılımı (ORB) göstergesidir. Otomatik olarak herhangi bir enstrüman için piyasa öncesi v
Volume Arrow Signal Product Description Volume Arrow Signal is a smart trading indicator designed to help traders identify potential buy and sell opportunities using price action, volume behavior, and directional arrow signals. The indicator places clear arrows directly on the chart, making it easy to spot possible market reversals, trend continuations, and entry opportunities without spending hours analyzing charts manually. Whether you are trading Gold (XAUUSD) , Forex pairs, Indices, or Crypt
OrderFlow Absorption – MT5 için Profesyonel Delta ve Absorpsiyon Sinyal Göstergesi OrderFlow Absorption ile gerçek emir akışı analizinin gücünü keşfedin – MetaTrader 5 için nihai delta histogramı ve absorpsiyon sinyal göstergesi. Fiyat hareketlerinin arkasında gerçekte neler olduğunu görmek isteyen traderlar için tasarlanan bu araç, piyasayı hareket ettiren gizli alım/satım baskısını ve absorpsiyon olaylarını ortaya çıkarır. Özellikler Delta Histogramı Görselleştirme:   Alım ve satım baskısını a
Zain Gold ScalpingV5
Ahmed Gamal Abdel Nasser Mohamed
Zain Gold Scalping V5 is a technical analysis indicator for MetaTrader 5 designed for Forex and Gold markets. It provides chart-based market information, trend analysis, signal conditions, and an on-screen dashboard to help traders analyze price movement across multiple timeframes. Main Features The indicator supports multiple timeframes, including M1, M5, M15, M30, H1 and higher timeframes. It can be used with Gold (XAUUSD), Forex currency pairs, indices and other supported instruments. The in
IQ FX Gann Levels a precision trading indicator based on W.D. Gann’s square root methods . It plots real-time, non-repainting support and resistance levels to help traders confidently spot intraday and scalping opportunities with high accuracy. William Delbert Gann (W.D. Gann) was an exceptional market analyst, whose trading technique was based on a complex blend of mathematics, geometry, astrology, and ancient mathematics which proved to be extremely accurate. We don't offer free or bonus indic
KenKem Master Volume Profiler - Brief Introduction A Display-only volume-profile cockpit for XAUUSD, BTCUSD and other liquid symbols. Draws profile structure, multi-timeframe flow, EMA trend and study-only setup markers. Places no orders. Not a signal service.  It maps where the market has actually traded and reads recent order flow, so you can see structure and lean at a glance.  What it shows: Master and local volume profiles (POC and value-area high/low) - the price shelves that matter. A liv
First time on MetaTrader, introducing IQ Star Lines, an original Vedic Astrology Based Intraday Trading Indicator. We don't offer free or bonus indicators in exchange of reviews from you. You won't need any free products with this indicator to make it work. ;) Enjoy! Welcome to the new and updated  IQ Star Lines , the ultimate fusion of ancient planetary cycles and modern quantitative trading, published for the first time on Metatrader. This is an indicator built by the developer, who has spent
VTrende Pro
Andrii Diachenko
5 (1)
VTrende Pro - MTF indicator for trend trading with a display panel for MT5 *** Videos can be translated into any language using subtitles (video language - Russian) Although the signals of the VTrende Pro indicator can be used as signals of a full-fledged trading system, it is recommended to use them in conjunction with the Bill Williams TS. VTrende Pro is an extended version of the VTrende indicator. Difference between Pro version and VTrende: - Time zones - Signal V - signal 1-2 waves -    S
Navigator Equilibrium: tek pencerede piyasa fazı, momentum, zirveler ve uyumsuzluklar Momentum osilatörü, trend filtresi, volatilite göstergesi ve uyumsuzluk (divergence) tarayıcısı arasında gidip gelmeye son. Navigator Equilibrium hepsini renk kodlu tek bir pencerede toplar; böylece momentumun güçlenip güçlenmediğini, kontrolün kimde olduğunu, piyasanın trendde mi yoksa konsolidasyonda mı olduğunu ve fiyatla momentumun nerede ayrıştığını tek bakışta görürsünüz. Piyasayı net okumak isteyen manue
Boom & Crash & PainX & GainX Ultimate Spike Detector Trade Spikes With Confidence — Not Guesswork Catching spikes should be one of the most profitable strategies in synthetic markets. But for most traders, it becomes one of the most frustrating. You enter too early… price goes against you. You wait for a spike… it never comes. You finally catch one… but don’t know whether to hold or close. You make profit… then give it all back because there’s no exit plan. This is exactly the problem the Ultim
Yazarın diğer ürünleri
This is a free version and is forecasting only 5 bars The FourierExtrapolationMAFree indicator transforms and extrapolates the Moving Average function by the Fast Fourier Transformation method. 1. The transformation period is set by two vertical lines, by default the first blue line and the second pink. 2. By default, the Moving Average (MA) line is drawn in red. 3. By Fourier Transform, the indicator builds a model of N harmonics, which is as close as possible to the MA values. The model is
FREE
This is a free version of the indicator, the period between the vertical lines is always 30 bars. In the paid version the period can be set by user, so a configuration with many ThreePointsChannel indicators with different periods is possible. The principle of construction - on top of any number of bars set by the user, a channel is constructed with maximum and minimum lines so that the bars touch the maximum and minimum of the channel at exactly three points. The name of the indicator follows
FREE
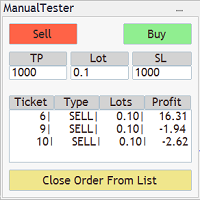
The Manual BackTester Panel utility allows to simulate the manual trading in the MetaTrader 4 strategy tester. The panel works only in the virtual mode of the MetaTrader 4 strategy tester. The demo version allows to open and close ten orders, then the program will automatically turn off. The utility has no parameters at initialization. Panel Description: The panel has Buy and Sell buttons for placing market orders. It is possible to set the Take Profit and the Stop Loss in the TP and SL fields,
ThreePointsChannel
Dimitr Trifonov
4 (3)
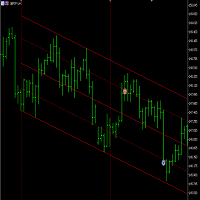
The principle of construction - on top of any number of bars set by the user, a channel is constructed with maximum and minimum lines so that the bars touch the maximum and minimum of the channel at exactly three points. The name of the indicator follows from this principle. Both vertical lines can be moved along the graph by the user, thus specifying the period on which the channel is built. After a specified period, channel rays are drawn that define a channel in which the price can move. In
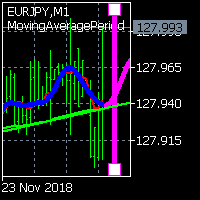
The FourierExtrapolationMA indicator transforms and extrapolates the Moving Average function by the Fast Fourier Transformation method. 1. The transformation period is set by two vertical lines, by default the first blue line and the second pink. 2. By default, the Moving Average (MA) line is drawn in red. 3. By Fourier Transform, the indicator builds a model of N harmonics, which is as close as possible to the MA values. The model is drawn by default in blue over the MA for the period betwee
Filtrele:
24278
343
24278 2023.08.28 15:54 

perfect tool, with Matreshka you see well where the key pricing points are. Recommended for those who want a "PLUS" in trading.

adonis4ex
6375
adonis4ex 2021.05.30 15:10 

past present future all colliding in a chaotic symphony. i have settled now. i am now one with pi. 3.144 is the answer, i now know. the answer is everywhere it is here. i am now knowing where price goes at all times. there is no I anymore, i have an eye, but not an I. I left and became price, price is constant yet never solid, demanding the supply, with resistance supports the price. there is no more I, myeye sees. matreshka has given me clarity, understanding i had to come to my own

Değerlendirmeye yanıt