Robots comerciales e indicadores para MetaTrader 5 - 170

Indicador Savage (XAUUSD)
S in Pintura. Funciona en PC y teléfono móvil.
Descripción general :
Savage Indicador está diseñado para los comerciantes que quieren señales limpias y precisas sin pasar horas analizando gráficos.
El indicador ofrece alertas en tiempo real, incluyendo notificaciones Push directamente a su teléfono móvil, por lo que mantenerse actualizado incluso cuando estás lejos de tu PC.
Funciona con múltiples brokers y símbolos, detectando automáticamente el gráfico XAUUSD
Analiza automáticamente todos los índices sintéticos Boom y Crash dentro de un rango horario definido por el usuario. El escáner identifica cada gap y genera un reporte en HTML con un diseño claro y visual para facilitar el análisis posterior.
Escaneo de múltiples símbolos en un solo clic. Definición flexible del rango de tiempo (ej. últimas 2 horas, 24 horas, etc.). Reporte en formato HTML con colores y tablas fáciles de interpretar. Compatible con cualquier temporalidad. Registros completos p
Identifica automáticamente los gaps en índices sintéticos como Boom y Crash.
La herramienta no solo marca los gaps en el gráfico con rectángulos visuales, sino que también envía alertas al celular, notificaciones en pantalla y guarda un registro completo en archivos para su posterior análisis.
Detección automática de gaps en tiempo real. Dibujos visuales en el gráfico (rectángulos y niveles). Alertas al celular y notificaciones emergentes. Reportes archivos de log .csv Configuración de zona hor

Presentamos el Gold Sniper EA . Es un Sistema de Breakout de Oro. Subida de precios en 1 día a $ 249 como Fundednext pasó con esta EA No Martingale, No Grid , No Averaging, No AI Señal en vivo https://www.mql5.com/en/signals/2333366 ******* CARACTERÍSTICAS ******* Ajustes de Sólo Compra y Sólo Venta Ajustes individuales de TSL y SL para Órdenes de Compra y Venta Operando en el Par XAUUSD Esta es una estrategia de ruptura diaria.
Cada orden está siempre protegida por Stop-Loss y Trailing SL.
F

AlgoMaster Gold — EA Inteligente de Reversiones para XAUUSD AlgoMaster Gold es un Asesor Experto profesional desarrollado exclusivamente para Oro (XAUUSD) .
Detecta los grandes giros del mercado con colocación estricta de stop y gestión progresiva de beneficios, garantizando un control disciplinado del riesgo y un crecimiento constante del capital. Características Optimizado solo para Oro (XAUUSD) Entradas en reversiones en puntos clave Salidas parciales progresivas (33% → BE, 33% → benefic

Tempest Alpha es un EA de trading multiestrategia que implementa algoritmos de rejilla inteligente con una completa gestión de posiciones y controles de riesgo. El EA evalúa las condiciones del mercado utilizando análisis de régimen de mercado y mediciones de volatilidad para determinar las posiciones óptimas de entrada y salida. Características principales Arquitectura Multi-Estrategia : Cada estrategia opera independientemente con parámetros y gestión de parrilla únicos.
Gestión dinámica de la

Trading de nivel institucional, automatizado para usted KORRECT GOLD EA es un algoritmo de trading de Smart Money Concepts + Fibonacci para MT5. Analiza la estructura del mercado, las zonas de liquidez, los bloques de órdenes, las brechas de valor razonable y los niveles de retroceso de Fibonacci para generar entradas de alta probabilidad, al igual que los operadores profesionales. Diseñado para los traders que quieren un trading consistente, basado en reglas y sin sesgos emocionales.
Caracterí

PriceActionToolKit - Indicador profesional de TIC y conceptos de dinero inteligente Transforme sus operaciones con análisis de nivel institucional PriceActionToolKit es un indicador completo que lleva el poder de la metodología Inner Circle Trader (ICT) y Smart Money Concepts directamente a su plataforma MetaTrader 5. Esta solución "todo en uno" elimina las conjeturas de sus decisiones de negociación mediante la identificación automática de las estructuras clave del mercado que los operadores in

EA Fibo Grid Hedge – Robot de Red Automática con Inteligencia Dinámica (GBP/JPY) Un Asesor Experto profesional para MetaTrader 5 desarrollado con lógica de operación en red ( grid trading ), que combina control de riesgo, inteligencia adaptativa y gestión automática de beneficios. Alto Rendimiento Comprobado Con más de 1800 operaciones simuladas y un Factor de Beneficio de 7.1 , EA_Fibo destaca por su excelente capacidad de adaptación al mercado y sus sólidas estrategias defensivas. Su sistema

GOM Custom EA es un constructor de estrategias EA personalizable. Usted puede diseñar su propio EA de este producto. Funciona en todos los instrumentos (divisas, oro, etc.) El producto está diseñado para tener opción altamente personalizable en los criterios de entrada, TP, SL, sistemas de comercio de cuadrícula y también una opción de salida de seguridad. Un ajuste de demostración dada con la EA tiene un retorno de 11x dentro de 20 meses ($ 1,000 a $ 11,000) (Probado desde Ene 2024 - Ago 2025 e

Aproveche la fuerza del impulso del mercado Deje de perseguir falsas rupturas. Trend Force identifica continuaciones de tendencia de alta probabilidad con precisión quirúrgica, dándole la ventaja que exigen los traders profesionales. Obtenga señales precisas de entrada/salida con stop loss dinámico inteligente, deje de adivinar y obtenga resultados ¡YA! Por qué los operadores eligen Trend Force Detección inteligente de rupturas Algoritmo avanzado ajustado a la volatilidad que capta movimient

Golden Phoenix Diamond está ahora en la versión 5.12, un EA 5 en 1 con estrategias que pueden activarse individualmente o todas juntas, trabajando en perfecta armonía. Si prefiere menos operaciones, puede optar por activar una o dos estrategias. Todas las estrategias estarán gestionadas por un sofisticado sistema de gestión de riesgo y rentabilidad, con trailing stop para proteger los beneficios parciales. También presenta una novedad para los que quieran dejar algunas órdenes en puntos concret

Double Top Bottom Pro Enhanced EA: Maestría de Patrones Múltiples con Precisión para FOREX, XAUUSD e Índices Desata el potencial de Double Top Bottom Pro Enhanced, un Asesor Experto (EA) diseñado para operar en los mercados de FOREX y XAUUSD. Este EA combina estrategias basadas en patrones —incluyendo doble techo/suelo, cabeza y hombros, pinzas y envolventes— con mecanismos de temporización, detección de liquidez y gestión dinámica de riesgos. ARCHIVO SET FILE: MQL5 CHAT LINK
Todos los archi
Primer indicador de señal de compra venta basado en SMC (funcionando)
Indicador sólo dibujar NUEVAS señales, Para volver a prueba, utilice probador de estrategia. MENSAJE mí para BONUS . Este indicador es uno de mis mejores desarrollos. Luché con la aplicación de mi método durante mucho tiempo, pero finalmente pude automatizar mis entradas. Todavía no estamos allí todavía como mi existe y sl son dinámicos. tan pronto como me imagino sls dinámicos y existe implementación, voy a empujar la actual

Siga la tendencia del oro con un sencillo EA de sólo compra
El EA es un Asesor Experto Buy-Only totalmente automatizado para MetaTrader 5.
Está diseñado para capturar oportunidades de mercado alcistas con una gestión segura del riesgo y una ejecución sin fisuras. Por qué lo eligen los traders: El mejor rendimiento en Oro (XAUUSD) - de gran liquidez y tendencia. Buy-Only EA - se centra puramente en posiciones largas. Plug & Play configuración - adjuntar y dejar que el comercio de forma

El indicador MOON SNIPER es una herramienta de detección de rupturas que combina análisis de acción del precio con matemáticas de Distribución Gaussiana para identificar puntos de entrada de alta probabilidad en el trading de forex. Mecanismo Principal: El indicador calcula niveles de soporte y resistencia utilizando distribución estadística de precios en lugar de puntos pivot tradicionales. Aplica principios de Distribución Gaussiana para determinar dónde es más probable que el precio encuentre

Trend Catcher - Filtro de Tendencias Multi-Timeframe MT5 con Alertas Móviles Trend Catcher es un indicador ligero de detección de tendencias en múltiples marcos temporales para MetaTrader 5. Ayuda a los operadores a sincronizar las señales a través de diferentes marcos de tiempo, filtrar el ruido, y permanecer alineados con el impulso de entradas más estructuradas. Diseñado con ejecución rápida y compatibilidad móvil, esta herramienta se adapta a scalpers, day traders y swing traders que necesit

TitanCore Fx es un Asesor Experto (EA) avanzado diseñado para operar en el mercado Forex de forma segura y eficiente. Utilizando múltiples estrategias integradas en modo multisímbolo, combinadas con filtros inteligentes de detección de tendencias, el robot es capaz de identificar configuraciones profesionales utilizadas con frecuencia por operadores experimentados de todo el mundo. A diferencia de otras soluciones, TitanCore Fx no utiliza martingala, rejilla o inteligencia artificial, priorizand

Deje de operar en exceso. Proteja su capital. ¿Cansado de las entradas impulsivas, las operaciones excesivas y las posiciones sin Stop Loss?
Este gestor de riesgos impone su disciplina automáticamente: límites de entrada diarios, Stop Loss obligatorios y un límite de riesgo del 1% por posición . Usted se concentra en las configuraciones, él aplica las reglas. Lo que obtiene Bloquea las operaciones excesivas : límite de entrada diario (por ejemplo, 2). La 3ª entrada se cierra - sólo esa . 1% de r

El indicador DS Gradiente de media móvil es una herramienta de análisis técnico que muestra el gradiente de una media móvil seleccionada en una subventana independiente. Los usuarios pueden seleccionar entre cuatro tipos de medias móviles: Simple (SMA), Exponencial (EMA), Suavizada (SMMA) y Lineal Ponderada (LWMA). Además, el indicador ofrece la opción de aplicar un suavizado de media móvil simple al gradiente calculado o mostrar los valores del gradiente sin suavizar. Este indicador cuantifica

Non-Farm Payrolls Sell Este Expert Advisor (EA) está desarrollado para operar en el par de divisas EURUSD en el momento de la publicación de noticias económicas importantes, como los Non-Farm Payrolls (NFP). Es parte de un sistema unificado que utiliza dos asesores para extraer beneficios de la alta volatilidad del mercado. Apertura de la operación: El asesor abre una operación de venta (SELL) en un momento estrictamente definido, sincronizándose con el momento de la publicación de la noticia.

Non-Farm Payrolls BUY Este Asesor Experto (EA) ha sido diseñado para operar el par de divisas EURUSD en el momento de la publicación de importantes noticias económicas, como las Non-Farm Payrolls (NFP). Es parte de un sistema unificado que utiliza dos asesores expertos para capitalizar la alta volatilidad del mercado. Apertura de la Operación: El Asesor Experto abre una operación de compra (BUY) en un momento estrictamente definido, sincronizado con la publicación de la noticia. Gestión del Lot

Oferta especial: Precio actual $150 Valkyrie XAUUSD M30 - Concepto de dinero inteligente Powered EA Utilice 0 en el desfase horario GMT si su zona horaria broker es +3. Modificar si su corredor está por encima o por debajo de +3. Asegúrese de utilizar el tamaño de lote correcto según el apalancamiento dado por su broker para ver las operaciones. El EA puede no funcionar con algunos brokers debido a diferencias de ejecución. Este Asesor Experto está diseñado específicamente para XAUUSD (Oro) en e

Incrementaremos el precio cada 10 compras de este EA. Próximo precio 250USD
GOLD Hybrid Analyzer Trend EA - Su socio inteligente para XAUUSD El GOLD Hybrid Analyzer Trend EA es un potente Asesor Experto basado en IA diseñado para capturar las tendencias más fuertes del mercado del oro con precisión. Combina la lógica de seguimiento de tendencias con filtros de volatilidad avanzados , asegurando que las operaciones sólo se realicen cuando aparezcan configuraciones de alta probabilidad. Caracte

Este Asesor Experto es un robusto sistema de seguimiento de tendencia que utiliza una confluencia de cinco indicadores diferentes para confirmar una fuerte tendencia alcista antes de entrar en una posición de compra. Su estrategia se basa en un proceso de validación de dos pasos: en primer lugar, confirma la tendencia general utilizando la EMA 200 y las Pendientes de Regresión Lineal para asegurarse de que el precio está en una clara dirección alcista. Una vez establecida una tendencia válida, b

Indicador básico SMC de zonas de bloques de interruptores inteligentes
Introducción: Los bloques rompedores son bloques de órdenes que han sido rotos una vez por el mercado . Cuando el precio vuelve a estas zonas, suelen desencadenar una fuerte reacción . En términos técnicos, los bloques de resistencia se convierten en zonas de soporte después de una ruptura, y los bloques de soporte se convierten en zonas de resistencia una vez rotos. Comprender los bloques de ruptura es muy valioso para iden

Sistema de trading Golden Snitch para XAU/USD (gráfico H1) El Golden Snitch es un sistema de trading revolucionario y altamente efectivo diseñado para el par XAU/USD en el gráfico H1. Este algoritmo de vanguardia emplea fórmulas avanzadas de distancia y velocidad, totalmente independientes de los indicadores técnicos tradicionales, para identificar puntos de entrada óptimos para estrategias de seguimiento de tendencias a corto/medio plazo. Analiza meticulosamente los retrocesos significativos y

Indicador que mostra níveis de variação do preço do ativo durante o dia. Possui alguns parâmetros para ajuste de cores e quantidade de níveis. Excelente como indicativo e utilização com outros indicadores para confirmar entradas e saídas.
Indicador que muestra niveles de variación del precio del activo durante el día. Posee algunos parámetros para el ajuste de colores y cantidad de niveles. Excelente como indicativo y para su uso con otros indicadores para confirmar entradas y salidas.
Indicat

Indicador VWAP anclado Siga el verdadero precio de consenso del mercado desde cualquier punto del gráfico.
Este indicador VWAP anclado (precio medio ponderado por volumen) le permite anclar el cálculo a cualquier vela - máximos, mínimos, rupturas o eventos clave - ofreciendo un control preciso para identificar los niveles de interés institucional. Siga la presión compradora o vendedora en tiempo real Añada múltiples anclajes para seguir simultáneamente varios puntos clave de interés Ideal pa

Inclinación del libro de órdenes con medidor de actividad de volumen Inclinación DOM en tiempo real - Sesgo de sesión - Momento de volumen Overview
Eleve su análisis de flujo de órdenes con este indicador limpio y ligero para MT5, diseñado para operadores que valoran la claridad y el contexto: Inclinación de la cartera de órdenes (en directo): Desequilibrio en tiempo real entre vendedores y compradores (Profundidad de Mercado), suavizado mediante EMA para una claridad procesable. Inclinación de

Lo que hace Caza los mismos niveles institucionales clave que mueven miles de millones diariamente. Tres algoritmos propietarios decodifican la verdadera estructura de mercado para exponer zonas de kill de alta probabilidad antes de que los traders minoristas sepan qué los golpeó. Elementos visuales Histograma verde : Presión de compra institucional detectada Histograma rojo : Distribución smart money en progreso Línea de señal : Verde = volumen alcista, Rojo = vendedores comprometidos Parámetro

Gold Dynamic Lot Trend EA es un Asesor Experto profesional diseñado para operar en XAUUSD.
Combina señales de entrada de tendencia con gestión dinámica de lotes y filtros de seguridad robustos. Características principales Cálculo dinámico de lotes con respaldo de lote fijo Señales inteligentes con filtros EMA + ADX Configuración segura: lote fijo de 0.01, sin SL/TP al abrir → evita stops inválidos Protección anti stop-out: verificación de margen antes de operar Filtro de horario y de spread para

### Domina los Mercados con Detección Profesional de Soporte y Resistencia
**Finalmente, un indicador que hace todo el trabajo pesado por ti.**
Deja de forzar la vista tratando de identificar manualmente los niveles de soporte y resistencia en los gráficos. Nuestro Indicador SNR Automático transforma tu trading al revelar instantáneamente los niveles de precios críticos que observan los traders profesionales.
#### Por Qué los Traders Están Cambiando a la Detección SNR Automatizada
El anális
Este EA negocia CFD de acciones, ETF e índices. Ofrece capacidad multisímbolo, 7 indicadores y algunas funcionalidades flexibles.
Indicadores
Medias móviles ADX Bollinger RSI Puntos pivote Fractales Puntos de oscilación de la acción del precio
Funcionalidad adicional Lote Dinámico Multiplicador de apalancamiento (1,0 = Sin apalancamiento)
Take Profit de grupo de cestas Take Profit y Stop Loss individuales Elección de la dirección de negociación (sólo compra, sólo venta, compra y venta)
Cierre
Darvas Box Long/Short EA - Versión 3.2 Visión general
El EA Darvas Box Long/Short es un robot de trading robusto y automatizado construido para MetaTrader 4 (MT4), inspirado en la legendaria estrategia de ruptura de Nicolas Darvas de los años 1950. Busca rupturas impulsadas por el impulso (largas) y rupturas (cortas) utilizando "cajas" dinámicas formadas a partir de los máximos y mínimos de precios recientes, mejoradas con un búfer basado en ATR para filtrar la volatilidad. Este EA es totalmen

Presentamos Friday Pro, el Asesor Experto definitivo que le permite liberar todo el potencial de los mercados de fin de semana. Libérese de los métodos tradicionales que se basan en arriesgadas estrategias de martingala, cuadrícula o scalping con ganancias mínimas y stops monumentales. Friday Pro adopta un nuevo enfoque, originado en la sabiduría de los operadores de piso institucionales, asegurando resultados precisos y consistentes. Visite la sección Comentarios para descargar los últimos arc

CalcWave EA: Una Solución de Trading Robusta y Sin Indicadores (Sólo para EURUSD diario y gráfico H1) CalcWave es un Asesor Experto de ingeniería profesional que se basa puramente en modelos matemáticos y reglas de gestión de dinero, no se utilizan indicadores gráficos para la ejecución de operaciones. Respaldado por más de 20 años de experiencia comercial, este EA trata el comercio como un negocio, no como un juego de azar, y se adapta a los mercados dinámicos de hoy. Características principale

1. Introducción: Un nuevo enfoque del trading mecánico
Bienvenido a DualSeriesEA , un sofisticado y potente sistema de trading automático para la plataforma MetaTrader 5. A diferencia de los EAs tradicionales que siguen un único conjunto de reglas, DualSeriesEA está construido sobre una arquitectura única de doble motor . Ejecuta simultáneamente dos estrategias de negociación independientes pero complementarias, proporcionando un nivel de control y profundidad estratégica que antes no estaba d
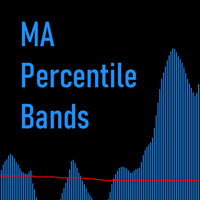
Bandas Percentiles de MA (MA Percentile Bands) Este indicador proporciona un enfoque matizado y estadístico para analizar la relación entre dos medias móviles. En lugar de centrarse únicamente en los cruces, las Bandas Percentiles de MA miden la distancia entre una media móvil rápida y una lenta, y la comparan con su propio historial reciente. Esto permite a los traders identificar cuándo la separación entre las MAs es estadísticamente significativa, proporcionando una perspectiva única sobre el

Filtro de Comercio es una herramienta diseñada principalmente para los comerciantes que utilizan muchos Asesores Expertos en el mismo par de divisas y / o sistemas de cuadrícula de la creación de muchas operaciones de comercio simultáneo. Al añadir el filtro (como un indicador) a un gráfico dado, debe seleccionar un número mágico de la EA y sólo sus operaciones permanecen visibles. Numerosos ajustes de colores, estilos de línea, tamaños de fuente y otros se han añadido, a través del cual se pued
Simple DCA EA - Asesor Experto Avanzado en Promedio del Coste en Dólares Visión general Simple DCA EA es un Asesor Experto diseñado para apoyar las estrategias de Dollar Cost Averaging (DCA) en la plataforma MetaTrader 5. Este EA puede trabajar tanto con órdenes manuales como automatizadas, ayudando a los operadores a optimizar la gestión de riesgos y maximizar los beneficios a través de un sistema inteligente de DCA. Características principales 1. Sistema DCA Inteligente El EA utiliza un algori

"Este indicador fue diseñado para que usted no opere en contra de la tendencia, la fuerza del precio le ayuda a tener más confianza en sus entradas. Nota: El indicador se puede utilizar en cualquier par de divisas, no te preocupes si no tienes instalados todos los indicadores que utiliza, se calculará a partir de los indicadores que ya tengas en la plataforma.Con una interfaz que cambia de color para compra (azul), venta (rojo) y neutral.

Ratio X — Sistema de Trading Impulsado por IA para MT5
Importante: Requiere una clave API de OpenAI para operar completamente. Antes de operar, habilite WebRequest de MT5 en la configuración de su terminal. La guía de configuración completa está disponible en la sección de Comentarios después de la compra. Precios Precio inicial: $37 USD El precio aumenta $10 cada 20 usuarios.
Qué hace diferente a Ratio X Ratio X integra OpenAI GPT-4o-mini para interpretar el contexto del mercado mientras un m
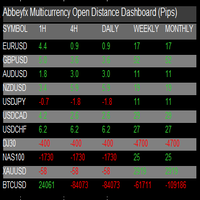
Desbloquea las Perspectivas del Mercado con el Cuadro de Mando de AbbeyFX Multidivisa Open Distance . Lleve sus operaciones al siguiente nivel con un indicador avanzado que muestra el movimiento del Precio de 1H, 4H, Diario, Semanal y Mensual Abierto a través de todos los instrumentos de negociación . Con un solo vistazo, verás:
Movimientos precisos de pips o porcentajes para pares de divisas, índices, metales y criptomonedas.
Análisis multi-marco de tiempo (1H → Mensual) para confirmac

Bullhouse MarketProfile Descripción
El indicador MarketProfile recoge y distribuye el volumen negociado en diferentes niveles de precios, creando un histograma horizontal que destaca las áreas de interés institucional. C ómo ayuda en la negociación
Ayuda a los operadores a identificar zonas de fuerte soporte y resistencia, zonas de equilibrio y puntos de control (POC), ofreciendo una visión de dónde están más activos los participantes en el mercado. ️ Cómo utilizarlo
Establezca el ran
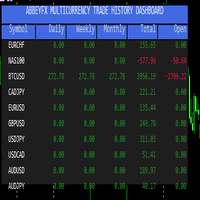
Abbeyfx Multicurrency Trade History Dashboard es un indicador que rastrea y analiza en un formato de tabla el rendimiento de las operaciones a través de múltiples pares de divisas, acciones, criptoactivos, u otros instrumentos. Esto extrae las operaciones directamente del historial de operaciones de MT5.
La tabla de comparación multidivisa muestra los resultados de todos los pares uno al lado del otro . Con un rápido vistazo, puedes ver los pares con mejor y peor rendimiento. Este indicador es

Gold Strike EA - Motor de Precisión para Mercados de Oro Gold Strike EA es un sistema de trading automatizado especializado construido exclusivamente para XAUUSD, diseñado para operar con disciplina y precisión en entornos de alta volatilidad. Aplica una lógica de ruptura refinada en torno a niveles de precios clave, combinada con una gestión inteligente del riesgo y del capital, para entrar en el mercado sólo cuando se dan las condiciones adecuadas. El sistema opera dentro de ventanas de negoc

Este EA cierra parcialmente cada orden abierta con un tamaño de lote superior al valor de cierre definido por el usuario.
Por ejemplo: Si abre una orden de 0,50 o inferior y el valor de cierre que ha establecido es de 0,50, no hará nada. Si abre una orden de 0,60, transformará instantáneamente su orden de 0,60 en una orden de 0,10. Esto es muy útil si usted tiene una cuenta pequeña y el tamaño mínimo de lote para un activo es demasiado alto para usted.
Hacer esto manualmente puede ser peligro

Vision 2.0- La herramienta definitiva para operar con confianza Vision es un indicador completo e intuitivo que combina precisión, seguridad y sencillez.
Ha sido diseñado para los traders que desean:
Identificar rápidamente las oportunidades más claras
Proteger su capital con una gestión del riesgo integrada
Operar con confianza gracias a una interfaz optimizada. Lo que Vision puede hacer por usted Señales claras y sin ambigüedades Flechas visibles directamente en el gráfico Entra

CratonGold
CratonGold no es sólo otro robot de trading. Es un Asesor Experto construido sobre el principio de la estabilidad geológica, diseñado para navegar por el volátil mercado del Oro (XAUUSD) con una sólida estrategia de seguimiento de tendencias. Al igual que un cratón, la parte más antigua y estable de la corteza terrestre, este EA está diseñado para soportar las turbulencias del mercado y capturar tendencias fuertes y persistentes. Deje de perseguir señales fugaces. Empiece a construir

TendencyView es un indicador/experto MQL5 diseñado para mostrar y analizar la tendencia de un activo financiero (el símbolo actual) a través de múltiples marcos temporales en paralelo: H1, H4 y D1. Calcula medias móviles rápidas y lentas para cada marco temporal, compara sus cruces y determina la tendencia: TENDENCIA_ALTA (alcista) -> MA rápida > MA lenta TREND_DOWN (bajista) -> MA rápida < MA lenta TREND_SIDEWAYS (lateral) -> Sin consenso claro En el gráfico, independientemente del marco tempo

DoIt EURO Maestro MT5 - Inteligente EURUSD Swing Trading EA (Verificado en vivo). Precio de lanzamiento: $147 (10 copias) → Siguiente: $399 → $599 → Final: $999 Prueba en vivo Resultados verificados disponibles:
Señal en vivo en Myfxbook . (Todos los resultados son de una cuenta de dinero real. El rendimiento pasado no garantiza resultados futuros). Acerca de DoIt GBP Master ha estado funcionando con éxito durante más de 8 meses con un crecimiento constante y 50+ usuarios activos. DoIt EURO
MACD profesional con 6 modos de negociación, detección de divergencias, periodos adaptativos, y completo sistema de gestión de riesgo /SL,TP/ para todos los niveles de trader. Muestra soportes y resistencias adaptables. Muestra el día anterior: ¡máximo, mínimo y nivel de precio de equilibrio! ¡Proporciona sugerencias de trading!
Elija su estilo de trading y deje que el indicador se configure automáticamente:
- ** MODO PRINCIPIANTE** - Señales simples y seguras con confirmaciones claras. - *

HydraCore Trader - Asesor XAUUSD con martingala controlada Objetivo. El EA negocia las fluctuaciones de precios intradía. La primera orden de una serie se abre por RSI; las entradas adicionales se colocan por una cuadrícula con aumento controlado del lote (martingala dentro de una sola serie virtual). La salida de la serie es por objetivo de BEP o por trailing stop. Todos los nombres de las entradas y los mensajes sobre el gráfico están en inglés. Características principales Optimizado para XAU

¡Solo quedan 5/10 copias al precio de lanzamiento de $99! Filosofía — “Disciplina dentro, beneficios fuera. Un motor limpio para acciones.”
MAM Gold está diseñado exclusivamente para acciones y funciona en cualquier marco temporal. Opera como un motor long siempre activo: entradas deliberadas con contexto EMA/ATR, gestión disciplinada del riesgo, trailing inteligente y adiciones solo cuando la tendencia realmente paga. Sin exageraciones—solo ejecución estructurada para acciones. Técnicos —

对内包线策略认真吗? 这个专业指标提供三个改变游戏规则的优势: 通过时区信号过滤进行高效回测 ,消除噪音并专注于 内包线模式 , 实时交易的即时警报 ,当您的注意力需要在别处时,以及 完整的时区定制 ,无论您的经纪商位置如何,都能在世界任何地方工作。 附加功能: 通过高级模式验证实现零误报 30多家主要经纪商的自动GMT检测,带手动选项 可自定义的视觉信号 警报 专业级可靠性,为认真的交易者而设 入门指南 快速设置(推荐初学者) 将指标应用到任何图表 最初使用默认设置 内包线将显示为黄色虚线矩形 如需要可启用警报 基本使用 黄色矩形标记已确认的内包线模式 矩形从母线延伸到内包线 应用时历史模式自动加载 新模式在形成时实时出现 参数设置 视觉设置 矩形颜色 默认:黄色 (clrYellow) 用途:内包线矩形的颜色 选项:任何MT5颜色(红色、蓝色、绿色等) 矩形样式 默认:虚线 (STYLE_DOT) 用途:矩形边框的线条样式 选项:实线、虚线、点线、点划线、双点划线 矩形宽度 默认:1 范围:1-10 用途:矩形线条的粗细 最大信号数 默认:50 范围:1-1000 用途:图表上显示

Su ventaja automatizada para un éxito comercial constante ¿Está cansado de las decisiones de trading emocionales y de los resultados inconsistentes? Domine el US500 (US S&P 500 Index) con un robot de trading profesional construido para la disciplina y consistencia requeridas para el éxito en el mercado a largo plazo. Comience por sólo $34/mes. Licencia: 20 dispositivos y cuentas ilimitadas.
US500 Pulse no es un EA más. Se trata de un completo sistema de negociación de seguimiento de tendencias

Lot Size Calculator – Calculadora de Tamaño de Lote Este indicador calcula el tamaño de lote según el porcentaje de riesgo seleccionado y la distancia del stop loss. Se puede usar en Forex, metales, índices, materias primas y criptomonedas.
Características principales Cálculo del tamaño de lote según el balance y el porcentaje de riesgo Modos de orden de mercado y orden pendiente Líneas visuales en el gráfico: entrada, stop loss y take profit Visualización de la relación riesgo/beneficio Ajust

ScalerPro EA
El último sistema de comercio de fusión VWAP y EMA. Visión general ScalerPro EA es un Asesor Experto de nueva generación que fusiona el poder institucional del Precio Medio Ponderado por Volumen (VWAP) con la fiabilidad de las Medias Móviles Exponenciales (EMA).
Con una arquitectura de estrategia dual, escalado inteligente de posiciones y controles de riesgo inteligentes, ScalerPro EA se adapta dinámicamente a las condiciones cambiantes del mercado mientras mantiene el riesgo baj

Visión general
GoldStrikeEA es un Asesor Experto totalmente automatizado para MetaTrader 5, diseñado principalmente para XAUUSD (Oro) pero capaz de adaptarse a otros símbolos. Construido con conceptos ICT/FVG, barridos de liquidez y retests fractales S/R , proporciona modos de trading tanto estrictos como flexibles para adaptarse a diferentes estrategias. Este EA combina la detección avanzada de la estructura del mercado con un motor de aprendizaje de modelos personalizable, lo que le proporcio

Descripción general
Asesor Experto basado en patrones de velas con confirmación opcional RSI, filtros multi–timeframe y gestión de riesgo integrada. Diseñado para entradas disciplinadas, parámetros claros y alta repetibilidad en pruebas históricas. Cómo funciona
La dirección operativa se define a partir de la vela diaria para identificar contexto alcista, bajista o lateral. Las señales de entrada se activan dentro de una ventana horaria establecida y solo si se cumplen los filtros de día y mes

INVI Hunting Gold es una de las herramientas más sencillas para analizar el volátil mercado del oro con precisión, análisis en profundidad, una sólida gestión del riesgo y eliminando la necesidad de una supervisión constante del mercado. INVI Hunting Gold buscará una buena posición comercial con una gestión precisa del riesgo en todas las condiciones del mercado del oro. La funcionalidad plug-and-play de Hunting Gold significa que puede empezar con el mínimo esfuerzo, simplemente instáleme y de

Ameers Gann Toolbox – By Ameer Sobre W.D. Gann W.D. Gann (1878–1955) fue uno de los traders más legendarios de la historia.
Desarrolló una metodología única basada en la relación entre el precio y el tiempo, utilizando ángulos, geometría, ciclos y proporciones. Gann creía que los mercados se mueven en patrones matemáticos predecibles y que el tiempo es tan importante como el precio para pronosticar los movimientos futuros. Por qué esta herramienta es especial Ameer’s Gann Toolbox es la primera

Intelligent Grid Pro - 6 meses Resultados en vivo de XAUUSD
En mi biografía se puede encontrar enlace a myfxbook resultados
Visión general Intelligent Grid Pro es un sofisticado Asesor Experto de MetaTrader 5 diseñado para traders experimentados que entienden las estrategias de trading grid. Este avanzado sistema algorítmico combina la metodología tradicional de grid con una gestión inteligente del riesgo y un manejo automatizado de las posiciones.
Características principales Sistema de entra

Indicador del detector de BIAS (MT5) Descripción El indicador BIAS Detector es una herramienta personalizada para MetaTrader 5 diseñada para proporcionar a los operadores un sesgo visual rápido del mercado basado en la relación entre: Detector simplificado AI Casco y Media Móvil cálculo basado en múltiples Promedio confluencia para la tendencia del mercado. Simplifica el análisis de la dirección de la tendencia mostrando una Señal BIAS (Compra/Venta) directamente en el gráfico en un pequeñ

AP London Breakout PRO negocia el primer impulso cuando Europa cede y llega la liquidez de Londres. Construye un rango pre-Londres (servidor 02:00-07:00), comprueba la altura de la caja y el diferencial, y luego publica una ruptura limpia con riesgo fijo. Sin martingala, sin rejilla, sin persecución; una vez llenado, cancela el otro lado y se detiene para el día. Diseñado para las principales divisas y el oro en M5-M15, con una colocación segura para el broker (Stops/Freeze aware), redondeo de l

AntiSwapCleaner es un Asesor Experto (EA) diseñado para proteger una cuenta de trading contra pérdidas causadas por swaps negativos (comisiones nocturnas cobradas por mantener una posición abierta). Se ejecuta en segundo plano y supervisa las posiciones abiertas que coinciden con un Número Mágico determinado (o las operaciones manuales si están activadas).
Calcula el swap aplicable a cada posición (larga o corta) y compara el beneficio actual de la posición con el swap estimado.
Si el beneficio

Un gráfico. Control total. Deje de perder tiempo administrando objetos, colores y configuraciones en cada gráfico por separado. Con Administrador de sincronización de gráficos , puede Sincroniza, copia y controla todos tus gráficos de MetaTrader al instante, utilizando solo un panel y unos pocos atajos. Dibuja una vez, actualiza en todas partes. Abre y cierra gráficos con un solo clic. Mantén tu espacio de trabajo ordenado con Gestión de objetos basada en símbolos . Y

Deposite sus ganancias y asegure sus operaciones con un solo clic La última herramienta de "Scale Out" para Traders Profesionales. Cerrar Parcial (MT5 Utilidad) está diseñado para los comerciantes que quieren bloquear en los beneficios sin matar a la tendencia. Con un solo clic, puede depositar un porcentaje de sus ganancias al instante. Nueva Característica (Auto-Secure): Deje de perder tiempo arrastrando su Stop Loss después de tomar beneficios. Este gestor ahora puede mover automáticamente

Esta estrategia EA mostró un rendimiento muy favorable en las pruebas con BTC desde junio de 2016 hasta junio de 2017. Esta estrategia EA no es una estrategia única, sino que ha sido desarrollada de forma independiente mediante un prolongado proceso de ajuste y depuración personal. El capital inicial para esta estrategia EA puede oscilar entre 3000 y 10000 USD. Cuenta con un excelente control de riesgos y puede generarte buenos beneficios en el mercado cuando las condiciones sean adecuadas.
MetaTrader Market - robots comerciales e indicadores técnicos para los trádres, disponibles directamente en el terminal.
El sistema de pago MQL5.community ha sido desarrollado para los Servicios de la plataforma MetaTrader y está disponible automáticamente para todos los usuarios registrados en el sitio web MQL5.com. Puede depositar y retirar el dinero a través de WebMoney, PayPal y tarjetas bancarias.
Está perdiendo oportunidades comerciales:
- Aplicaciones de trading gratuitas
- 8 000+ señales para copiar
- Noticias económicas para analizar los mercados financieros
Registro
Entrada
Si no tiene cuenta de usuario, regístrese
Para iniciar sesión y usar el sitio web MQL5.com es necesario permitir el uso de Сookies.
Por favor, active este ajuste en su navegador, de lo contrario, no podrá iniciar sesión.