Conheça o Mercado MQL5 no YouTube, assista aos vídeos tutoriais
Como comprar um robô de negociação ou indicador?
Execute seu EA na
hospedagem virtual
hospedagem virtual
Teste indicadores/robôs de negociação antes de comprá-los
Quer ganhar dinheiro no Mercado?
Como apresentar um produto para o consumidor final?
Expert Advisors e Indicadores para MetaTrader 5 - 170

ELITE REVERSE TRADER (MT5)
Instantly hedge or invert any trade opened on your account—manual or EA. Reverse Mirror EA monitors your live positions and opens an opposite trade using your chosen lot mode (Fixed or Multiplier). When the original position is closed (manual close, SL/TP hit, EA exit—any method), the mirrored position closes automatically. Because it runs in the same terminal, it reacts faster than third-party copy tools. WHY THIS MATTERS
It is widely cited that a large majority of

If you optimize your EA with backtest+forward, this is the script you need.
Imagine this: you have 10k simulations in the Optimization step (the back test), and you get another 10k in the Forward step. Each pair of simulation is done with a set of input parameters for your EA. Then the question are: Which set of parameters should you select for live trading? What criteria should I use to select such set? How much weight should I put to profit versus draw down or versus recovery factor? OPS help
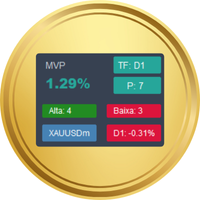
O Market Variation Pro (MVP) é um indicador único no mercado, fácil de usar e configurar, e que funciona em qualquer time frame e em qualquer ativo .
Ele calcula a variação percentual média de qualquer ativo, em um período definido. Diferente dos indicadores que analisam apenas o preço de fechamento, o MVP considera toda a amplitude, fornecendo uma leitura mais completa do comportamento do mercado. Principais funcionalidades Medição de volatilidade Quantifica a volatilidade média em termos perc
Brief Description Professional trading expert advisor utilizing an innovative adaptive grid strategy with intelligent hedging. The system automatically adapts to market conditions and ensures stable trading on any currency pairs and timeframes. Key Features Adaptive Hedging Intelligent counter-position system Automatic hedge addition when reaching specified level count Customizable hedge size and step parameters Flexible Grid System Customizable grid step in points Progressive lot size increas
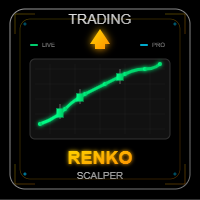
RENKO SCALPER - PROFESSIONAL TRADING INDICATOR OVERVIEW RENKO SCALPER is an advanced technical indicator designed specifically for professional traders looking to maximize accuracy in their scalping and intraday trading. Based on the adaptive Renko brick methodology, this indicator combines dynamic volatility algorithms with automatic buy/sell signals to provide a superior trading experience.
MAIN TECHNICAL FEATURES Adaptive Renko Analysis Dynamic brick calculation based on ATR (Average

Close All Trades - MT5 UI Tool Features - Trading Executions Simplified! One-Click Buy/Sell Buttons : Instantly place buy or sell orders for trades with a single click, streamlining order execution from the desktop. Customizable Lot Size & Parameters : Enter desired lot size, stop-loss (in decimal places e.g. 7 SL Units for 0.7 below or above for buy or sell), take-profit ( in decimal places ), and the number of trades before submitting (1,2,3,4,5 etc.), allowing precise control over each trade

Pair Timeframes XAUUSD M5-H1 How it works:
The EA detects bullish/bearish divergence signals. Close trades when the TP is reached → No long-term orders will be held.
️ Input Parameters
Lot Size – Set the trade size.
Good stance: Grid exit distance when the trend is reversed.
Pip limit to close profit.
Who is it suitable for?
Traders who enjoy scalping during periods of strong market movements.
Those who want an automated divergence system.
Those who want a ready-to-use EA without c
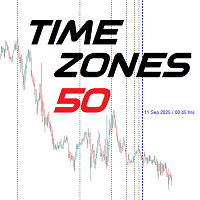
Time Zones Fifty O indicador resolve um problema fundamental:
Como devemos contar o tempo? Quais zonas usar, como e por quê?
Ele é totalmente baseado em lógica. Aplicação das zonas de tempo Para aplicar zonas de tempo precisamos de um ponto inicial. Esse ponto deve ser logicamente definido, não escolhido ao acaso.
Alguns escolhem começar a partir de: o primeiro dia do ano, o primeiro dia do mês, o início de um trimestre ou de uma semana. Mas isso pressupõe que a atividade do mercado se repete ex

Inverse Fair Value Gaps (FVG) Indicator Overview The Inverse Fair Value Gaps (FVG) indicator is an advanced technical analysis tool that identifies and tracks Fair Value Gaps and their subsequent inversions on your trading charts. This powerful indicator helps traders spot potential reversal opportunities by monitoring when price action invalidates existing Fair Value Gaps and creates inverse trading signals. What are Fair Value Gaps? Fair Value Gaps (FVGs) are price inefficiencies that occur wh

CRT Master Theory - Multi-Pattern Trading System Professional multi-strategy EA designed for H1 timeframe across all symbols. Combines 5 proven price action patterns with advanced filtering and risk management. Trading Strategies: False Breakout - Trades failed breakouts with optional candle range TP Inside Bar - Breakout strategy from consolidation patterns Pin Bar - Reversal signals from rejection wicks Engulfing - Momentum continuation patterns Support/Resistance - Bounce trades from key lev

Unlock the full potential of your trading account with LifeHack Prime EA , a professionally coded Expert Advisor that combines two powerful and distinct trading strategies into one robust automated system. This EA is designed to find opportunities, manage trades, and protect your capital in any market condition. Built to pass the rigorous standards of the MQL5 Market, this EA is perfect for both novice traders looking for a reliable solution and experienced traders who want to customize and opt

TradeMetrics – Advanced Trading Analytics Exporter Turn your trading history into a professional, shareable report in seconds. Get a full breakdown of performance with balance, profit/loss, win rate, equity curve, detailed statistics, streaks, money management, and risk/reward analysis. Includes performance by day, hour, session, and instrument. Perfect for traders, signal/EA providers, and mentors who need a clear and reliable performance dashboard . Turn your trading history into profession

The Line Electron EA - Advanced Multi-Currency Trading System Precision trading in the dynamic forex market requires sophisticated algorithms, adaptive strategies, and robust risk management. The Line Electron EA seamlessly integrates these critical elements into an intelligent system designed for optimal multi-currency trading performance. With five years of proven market experience and cutting-edge signal line technology, The Line Electron EA represents the evolution of algorithmic trading, he
Chart Scalper v1.01 Professional Trading Indicator for MetaTrader 5 OVERVIEW Chart Scalper is an advanced technical indicator designed to accurately identify optimal market entry and exit points. Using a sophisticated price reversal analysis algorithm, the indicator automatically detects significant trend changes and generates clear visual signals for buy and sell trades.
KEY FEATURES Accurate Trading Signals
Automatically detects trend reversals based on configurable parameters Generates

Discover the Strongest Support and Resistance Areas. This indicator is an advanced tool for identifying and plotting support and resistance levels on a chart. Instead of using a simple method, it follows a dynamic approach to identifying the most important levels. Its goal: to find important highs and lows that represent potential price reversal points.
The indicator analyzes three different time frames that you specify in the inputs: TF1, TF2, and TF3. Support and Resistance is the profession

PulseTrader Pro is a next-generation Expert Advisor built for traders who want a reliable, flexible, and adaptive trading system. Designed with a balance of scalping precision and swing-trading strength , it reads the “pulse” of the market and adapts to changing conditions. Unlike rigid EAs that fail in dynamic markets, PulseTrader Pro combines advanced technical filters, robust risk management, and intelligent trade execution to provide consistency across different symbols and timeframes. Whet
Mean Reversion Adaptive EA is a professional Expert Advisor designed for trading volatile markets using a combination of mean reversion strategy and an adaptive risk management system ( Safe Recovery Compounding ). The EA enters trades when price significantly deviates from its statistical averages and filters signals using ADX and trend direction to avoid entering against strong moves. Core feature : Adaptive compounding. After each losing trade, risk increases step by step following a prede

Talents ATR Scalper Utility (MT5) The Talents ATR Scalper Utility is a professional-grade trade execution and management tool built for MetaTrader 5. Inspired by the Biblical Parable of the Talents , this utility is designed to help traders multiply their potential with precision risk control, one-click simplicity, and advanced automation. Whether you’re scalping forex, gold, or indices, this tool delivers speed, consistency, and confidence. Key Features One-Click Trade Preview Click below price

Local MT5 Trade Copier EA – Copiador de ordens seguro, rápido e flexível de conta para conta Local MT5 Trade Copier EA foi desenvolvido para ajudar traders a copiar ordens de uma conta Mestre para uma conta Escrava de forma segura, rápida e automática. Esta ferramenta é ideal para: Gestores de contas: Copiar ordens da sua conta principal para várias contas pessoais ou de clientes. Traders com múltiplas contas: Executar ordens em várias contas ao mesmo tempo sem esforço adicional. Gestão de risc

NOTE : I CONSIDER THIS AS A FAILED PRODUCT THATS WHY I MADE IT CHEAP, TSK. TSK. A DISAPOINTMENT PROJECT.
Hello Everyone,
As much as we don’t want to share this AE, however, we dont have capital.
ABOUT US
In 2018, I founded Zrsmyley (Zero Risk, Smile) . I am a trader not by financial stuff, but rather by trading multiple game accounts to a higher one, then selling them when the time was right. Though it only lasted for 2 years as gamers were facing reality and don't have the golden time to p
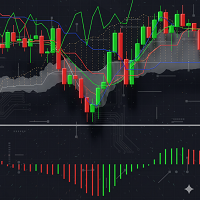
Do you want trading robots? Read this: Before investing in a trading robot, take a moment to understand what it entails. Trading is a game of probabilities. No one can guarantee a profit on every trade or every month. What truly matters is long-term profitability. If you can't accept that, there's no point in buying my robot. Go find another job. Don’t buy a robot based solely on its price or popularity on a platform. An expensive bot isn’t necessarily profitable. Even with a profitable robot,

Reflex Panel - Uma Revolução na Negociação Semiautomática! Cansado da interface padrão desajeitada do MT5? Esqueça a constante troca entre janelas e cálculos complexos! Chart Revolution EA é um painel de negociação profissional de nova geração que transformará seu gráfico em um centro de comando completo para o trader! PORQUÊ ESCOLHER O CHART REVOLUTION? Tudo num só ecrã - sem mais janelas extras
Execução instantânea - abra ordens com um clique
Cálculo de risco inteligente - cálculo a

BluePrint Adaptive Trader - Professional Trading System Advanced Channel Trading System based on our proprietary TrenderFlex PRO algorithm Learn more about TrenderFlex PRO KEY FEATURES • TrenderFlex PRO Channel Technology - Advanced channel calculation based on our proven algorithm
• Adaptive Risk Management - Automatic TP/SL calculation based on channel width
• Win Rate Statistics - Real-time tracking of TP1, TP2, TP3 success rates
• Multi-Timeframe Analysis - Monitor 7 timeframes simultaneou
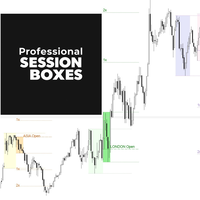
Professional Session Boxes – Multi-Market Trading Sessions Indicator Transform your trading charts from confusing price action to clear, actionable market sessions. Join hundreds of successful traders already using Professional Session Boxes , the ultimate MT5 session indicator , to time their entries perfectly. Transform Your Trading with Color-Coded Market Sessions Never miss a trading opportunity again! This professional-grade Forex volatility tool automatically highlights the most important

XRP 5 MIN SCALPER - Sistema Avançado de Seguimento de Tendência O XRP 5 MIN SCALPER é um indicador tudo-em-um de seguimento de tendência, com múltiplos filtros, projetado para scalping e negociação de curto prazo. Desenvolvido através de um processo iterativo, esta ferramenta visa resolver os desafios centrais que os traders enfrentam: identificar uma tendência válida, evitar mercados laterais instáveis e encontrar entradas precisas e de alta probabilidade. Em vez de apenas prever quando uma ten
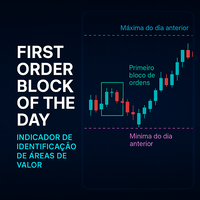
Indicador First Order Block of the Day - Identificação de Áreas de Valor Descrição
O indicador First Order Block of the Day é uma ferramenta essencial para traders que operam com base no conceito de blocos de ordens e análise de perfil de mercado. Este indicador identifica automaticamente o primeiro bloco de ordens formado na primeira hora de negociação de cada dia, uma área de extrema importância para a tomada de decisões estratégicas. Características Principais Identificação Automática :

Force Index MTF – Power of Volume and Price (Inspired by Elder Concepts) Multi-Timeframe (MTF) Force Index indicator independently developed by the author.
Inspired by the concepts in The New Trading for a Living by Dr. Alexander Elder, this indicator measures the power of volume and price across multiple timeframes, providing traders with a tool to analyze market trends.
This is an original implementation with MTF functionality and is not an official product of Dr. Elder . The Triple Screen Sys

Impulse System MTF – Smarter Multi-Timeframe Trading Trend & Momentum Signals (Inspired by Triple Screen Ideas) Multi-Timeframe (MTF) Impulse System indicator independently developed by the author.
Inspired by the Triple Screen methodology described in The New Trading for a Living by Dr. Alexander Elder, this indicator combines trend and momentum signals to help traders identify potential entry and exit points.
This is an original implementation with MTF functionality and is not an official prod

Features Broadcasts new trades , SL/TP modifications , partial closes , and full closes . Supports up to 3 Discord channels and 3 Telegram bots simultaneously. Includes direction (LONG/SHORT) , entry, SL, TP, Risk : Reward, ticket ID, and close reason. Time zone: default UTC+5:30 (IST). Users can select their own time zone via input parameters.
How to Configure Allow Web Request in Meta Trader: Go to Tools → Options → Expert Advisors . Tick Allow Web Request for listed URL . Add https://discor

Special OptiTrade Offer Hello! Want to simplify your trading? Get the OptiTrade EA for MetaTrader 5 at just $99, Price will increase in every 5 sales. What is OptiTrade? OptiTrade is a tool that automates trading on MetaTrader 5, designed specifically for XAUUSD on a 5-minute chart. It monitors the market, identifies good trading opportunities, and includes features to protect your funds. Note: This tool is for people with enough money to trade carefully. It’s not about making fast profits—it’s
Welcome to the Pair Spread Oscillator by Xignal Coding!
Ever wondered if you could monitor one asset against another—typically correlated—and spot opportunities? That’s exactly what you can do with the Pair Spread Oscillator! The Pair Spread Oscillator calculates the distance between your selected instruments and provides the mean distance and the standard deviation of your choice. This way, you can easily identify when these two instruments are moving in different directions and act before the

The EMA Multi-Entry Expert Advisor is a sophisticated, trend-following trading system designed to identify high-probability entry points using a combination of exponential moving averages (EMAs). It supports both single-entry and multi-entry grid-based recovery logic for enhanced flexibility and drawdown management. Using four EMAs for trend confirmation and retracement logic, the EA enters trades when price pulls back into short-term trend support/resistance, allowing for precise re-entry oppor
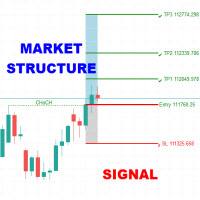
The Market Structure Signal indicator is designed to detect Change of Character (CHoCH) and Break of Structure (BOS) in price action, helping traders identify potential trend reversals or continuations. It combines market structure analysis with volatility (ATR) to highlight possible risk/reward zones, while also supporting multi-channel alerts so that no trading signal is missed. Interpretation Trend Analysis : The indicator’s trend coloring, combined with BOS and CHoCH detection, provides an i

The Automated Market Launcher is a straightforward Expert Advisor meticulously crafted for the MetaTrader 5 platform. This bot provides a simple yet powerful solution for traders who require a direct, automatic market entry. Configured to initiate a single trade immediately upon being attached to a chart, it's an ideal tool for strategies that demand rapid initial position placement without manual intervention. Key features of this expert advisor include a fully customizable lot size, which allo

**Laguerre RSI MTF — Indicador para MetaTrader 5** Desenvolvedor: Aleshin AlgoTrade | Versão: 1.06
Descrição curta: Laguerre RSI MTF é um indicador multi-timeframe avançado baseado no método Laguerre RSI (inspirado por John Ehlers). Proporciona avaliação rápida do momentum em múltiplos prazos para apoiar decisões de trading.
Principais recursos: - Cálculo multi-timeframe (até 5 TF) com barras adaptativas. - Parâmetro Alpha para afinar o filtro Laguerre. - Esquemas de cores dinâmicos (2 e

NosTraderMus LinearRegressionBands MT5 — Canal de Regressão Linear + RSI e Setas de Sinal NosTraderMus LinearRegressionBands MT5 é um indicador profissional para MetaTrader 5 que constrói uma linha de regressão linear sobre uma janela móvel de preços e forma um canal dinâmico a partir do desvio-padrão dos resíduos do ajuste. Sobre esse canal estatístico, integra um filtro RSI (com período/gráfico selecionável) e setas de compra/venda quando a condição de “ extremo + confirmação ” é atendida. O i
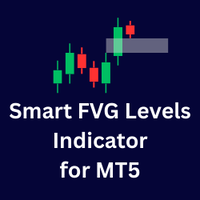
Smart FVG Levels Indicator for MT5 Category Platform Level Type Time frames trader style market ICT
SMC Indicator
Meta Trader 5
Level Indicator
Level Indicator
All Time frames
Scalpers
Day Traders
Swing Traders
Position Traders
All Type of Markets
Introduction The Smart FVG Levels Indicator for MT5 is a powerful trading tool designed to help you identify Fair Value Gaps (FVGs) automatically on your charts. Whether you are a beginner or an experienced trader, this ind

Eleve sua Análise Técnica com o Stats Summary . O Stats Summary é uma ferramenta analítica robusta, desenvolvida para o MetaTrader 5 (MT5), que fornece uma visão estatística detalhada do comportamento de preço. Diferente de indicadores tradicionais, ele utiliza conceitos de estatística descritiva para mapear a distribuição dos preços ao longo de um período amostral customizável. Ao definir o tamanho da amostragem, o indicador calcula e exibe no gráfico os seguintes valores: Mínima e Máxima (Min/

Empowering MQL5 with an AI Brain in Python
Use *** Grok 4 and Chatgpt 5 *** Try Our AI System with 10 Free Daily Analyses Experience the power of AI for free: Every 24 hours, receive 10 free analyses directly in your terminal. Our system, by default, is configured to offer you high-precision signals on the 1-hour timeframe, every 3 hours. These analyses have a real cost in tokens from cutting-edge AI APIs like GPT-5 and Grok . We appreciate you valuing this access and considering our premiu
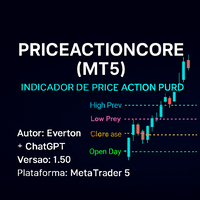
PriceActionCore (MT5) – Indicador de Price Action Puro - ( PREÇO MÍNIMO DE VENDA $30 USD. Pague uma vez e possua o indicador para sempre. ) Autor: Everton
Versão: 1.50
Plataforma: MetaTrader 5 "Lembre-se de ativar a visualização de descrição na plataforma!"
Perfil Price Action Puro
Gráficos limpos, apenas candles (sem indicadores).
Linhas horizontais: suporte, resistência, fechamento diário, máxima e mínima do dia anterior.
Usado por traders que operam pullbacks, rompimentos e reversões.

Stacking King EA – Precisão e Poder, Botão Simples
Descrição: O Stacking King EA é uma poderosa ferramenta de negociação que permite abrir várias negociações instantaneamente com um único clique ou acumular negociações automaticamente a cada minuto por um período definido — diretamente no seu terminal MT5 ativo. Seja você um scalper, um investidor de tendências ou um acumulador de rompimentos, este EA oferece controle total com o mínimo de esforço. Desenvolvido para traders reais, em mercados

DoctorEdge Daily Levels Entry SL And TP Descrição curta:
Indicador avançado para MetaTrader 5 que calcula automaticamente os níveis de entrada, stop loss e take profit com base nos dados do Mercado, facilitando a análise técnica e o planejamento de operações. Descrição longa:
O DoctorEdge Daily Levels Entry SL And TP é um indicador técnico desenvolvido para traders que buscam precisão na definição de pontos de entrada, stop loss e take profit. Ele utiliza os dados do dia para calcular: Entrada

Position EA – User Manual 1. Overview The Position EA is a semi-automatic trade manager for MT4.
It helps you: · Calculate lot size based on risk and stop loss. · Place market, limit, or stop orders quickly. · Manage risk with auto break-even and trailing stop . · Take profits in tiers (TP1, TP2, TP3) with partial closes. · Manually close half or all with a button. 2. Panel Layout 2.1 Top Bar · Type [MARKET/LIMIT/STOP] o Switches order type. o MARKET

Smart Stochastic Divergence Detector Description:
The Smart Stochastic Divergence Detector is a professional tool that automatically identifies Bullish & Bearish Divergences on your chart using the Stochastic Oscillator .
It helps traders detect early reversals , hidden momentum changes , and trend continuation signals without the need for manual analysis. Whether you trade Forex, Indices, Stocks, or Crypto , this tool provides clear divergence signals with arrows and trendlines – allowin

This MQL5 indicator, named BoS_ChoCh_Indicator, detects Break of Structure (BoS) and Change of Character (ChoCh) in trading charts. It identifies pivot highs and lows using a user-defined period (default 5), monitors price breakouts above highs or below lows, classifies them as bullish/bearish BoS or ChoCh based on the prevailing trend, draws colored lines and labels on the chart for visualization, and populates buffers with signals, structure levels, and trend direction (1 for up, -1 for down)

BlackBox XAU — Expert Advisor Avançado para Ouro Visão Geral O BlackBox XAU é um sistema de trading cuidadosamente desenvolvido para gerar lucros no mercado de ouro, mantendo um controle rigoroso sobre o drawdown. Em vez de perseguir todos os movimentos do mercado, aplica uma abordagem disciplinada e baseada em regras, que se adapta à volatilidade e seleciona apenas as oportunidades de maior probabilidade . O EA avalia constantemente as condições de mercado em tempo real, filtrando sinais fracos

London Open Session Breakout Expert Advisor Overview Grok EA is a sophisticated Expert Advisor (EA) designed for MetaTrader, optimized for trading breakouts during the London session. It identifies high-probability trading opportunities by analyzing price ranges at the session's start and executes trades with precise risk management. The EA offers customizable settings, visual charting tools, and advanced features like break-even and partial close options, making it suitable for both novice and

Unlock the Market's Hidden Blueprint with Advanced Pattern Recognizer Tired of staring at charts, struggling to spot high-probability trading opportunities? What if you had a professional analyst scanning the markets 24/7, drawing perfect trendlines, and calculating precise profit targets for you? Introducing Advanced Pattern Recognizer for MetaTrader 5 – Your Automated Technical Analysis Powerhouse. This isn't just another indicator. It's a sophisticated algorithmic engine designed to do the he
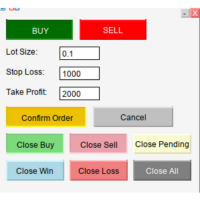
MQL5 SmartLevel Panel with Auto-Update Level Lines Description This SmartLevel Panel is a powerful and intuitive trading tool for MetaTrader 5, designed to help traders place orders with precision and efficiency. The panel features intelligent Level Lines that automatically update with price movements and are automatically removed if not confirmed within 1 minutes, preventing forgotten pending orders. Key Features Smart Level Line Management Auto-Update Functionality : The BuyLevelLine and Sell
Nexus 6.1 (MT5) - Neural Network Binary Options Indicator Nexus 6.1 (MT5) Neural Network-Powered Binary Options Indicator for MetaTrader 5 What is Nexus 6.1? Nexus 6.1 is a neural network–driven signal indicator specifically built for binary-options style trading. It generates accurate CALL/PUT decisions exactly at candle open, allowing you to set your expiry to the candle duration (or a small multiple) and act immediately—without guessing mid-bar. Why Traders Choose Nexus 6.1 Candle-start sign

Product Title: Multi-Timeframe Currency Strength Dashboard EA Short Description: A powerful and fully automated trading panel that identifies the strongest and weakest currencies in real-time across multiple timeframes to execute high-probability trades with advanced risk management. Overview The Multi-Timeframe Currency Strength Dashboard is your ultimate tool for dominating the forex market. It moves beyond single-chart analysis by scanning the entire market to find genuine strength and weakn
Hi traders, I am An expert advisor called "Trend Tracker EA" born specifically for low-cap traders to examine market trends along a lower timeframe with higher timeframe confirmation . In order to assess trend conditions and control trade entry and exits, it uses moving average crossover techniques in combination with customizable filters. The EA has trade management features such as limiting profits and losses, maintaining proper risk reward , trailing stop loss and so on.. Promotional Offer

CHART REVOLUTION EA - Uma Revolução na Negociação Semiautomática! Cansado da interface padrão desajeitada do MT5? Esqueça a constante troca entre janelas e cálculos complexos! Chart Revolution EA é um painel de negociação profissional de nova geração que transformará seu gráfico em um centro de comando completo para o trader! PORQUÊ ESCOLHER O CHART REVOLUTION? Tudo num só ecrã - sem mais janelas extras
Execução instantânea - abra ordens com um clique
Cálculo de risco inteligente - cá

This is an automated program (EA) designed specifically for frequent trading, which deeply integrates the market prediction ability of neural networks with the fund management method of Martingale strategy. It can dynamically adjust trading frequency and position in market fluctuations, with the core goal of obtaining commission returns and spread income. This program suggests operating with low initial capital and high leverage to improve the efficiency of fund utilization in the short term and

Professional-Grade Chart Analysis – AI-Powered & Visually Enhanced The AInalyzer is an Expert Advisor for MetaTrader 5 that leverages artificial intelligence to analyze market structures and automatically places visual objects directly on your charts. Instead of spending hours manually examining charts, you'll get a clear overview of support levels, resistance zones, trend structures, and potential trading opportunities in no time – all logically presented, visually marked, and available at you
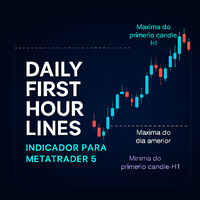
Daily First Hour Lines - Indicador para MetaTrader 5 Descrição O Daily First Hour Lines é um indicador técnico inovador para MetaTrader 5 que traça automaticamente os níveis de suporte e resistência com base no primeiro candle de 1 hora de cada sessão de trading. Desenvolvido para traders que operam no mercado financeiro, este indicador fornece referências visuais cruciais para identificar potenciais pontos de reversão e continuidade de tendência. Características Principais Linhas do Primeir

Surfing Team is a day trading EA relying on a few chosen forex pairs
It is all ready to go and can be simply put on any forex pair (I recommend EURCHF, but it does not really matter). Chart's timeframe is not used (I recommend M15, but you're free to change that) It will enter trades according to a mean reversion approach on a set of chosen forex pairs. On trade max per asset. No hard SL is used in this strategy, the EA will automatically close trades at a loss if needed. That being said, there

VIX Momentum Pro EA - Descrição do produto Visão geral VIX Momentum Pro é um sistema de negociação algorítmica sofisticado projetado exclusivamente para Índices Sintéticos VIX75. O algoritmo emprega análise avançada de múltiplos prazos combinada com técnicas proprietárias de detecção de momentum para identificar oportunidades de negociação de alta probabilidade no mercado de volatilidade sintética. Estratégia de negociação O Expert Advisor opera com uma abordagem abrangente baseada em momentum
PortfolioVaR Multi-Label Indicator: Your Ultimate Risk Manager Are you a serious trader who holds multiple positions across different symbols and currencies? If so, you need a clear, objective measure of your total portfolio risk. The PortfolioVaR Multi-Label indicator is the essential tool you've been waiting for, providing real-time, consolidated risk data directly on your MT5 chart. What is Value at Risk (VaR)? Value at Risk (VaR) is a fundamental concept in finance that measures the potentia

Legion of Soldiers – Manual do Usuário Foco Principal O Legion of Soldiers foi projetado como um indicador de reentradas dentro de estratégias de tendência já estabelecidas . Este indicador não define a tendência por si só, mas é usado para acompanhar e reforçar um sistema de tendência previamente identificado. A direção da tendência deve ser confirmada previamente usando ferramentas como: MarketCrack – Whale Detector (recomendado). Ou qualquer outra estratégia de detecção de tendência em tempor
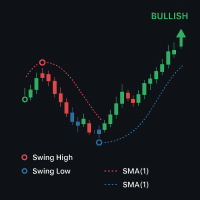
HighLow Swing — Indicador de Detecção de Tendências e Swing
Descrição: HighLow Swing é um poderoso indicador de detecção de tendências e swing, projetado para ajudar os traders a identificar facilmente os principais pontos de virada do mercado e as direções das tendências em qualquer período gráfico. Ele destaca máximas e mínimas significativas de swing, desenha círculos de tendência com base na estrutura do swing e ajuda você a se antecipar ao momentum do mercado com sinais visuais claros.
P

Desbloqueie Lucros Consistentes com o Slick Guru - Seu Companheiro Especialista em Trading!
Cansado de resultados inconsistentes em trading? Não procure mais! Sou o Slick Guru, um robô de trading de ponta, projetado para maximizar seus lucros com precisão e confiabilidade. Aproveitando análises avançadas de ação de preço, detecção de tendências e detecção de stop-loss, navego habilmente pelos mercados para identificar negociações de alta probabilidade.
Eu negocio pares de moedas como EURUSD,

Schemes 2.0 - Transforme seus gráficos do MT5 instantaneamente Aprimore sua experiência de negociação com o Schemes 2.0, a ferramenta definitiva de aprimoramento visual para o Meta Trader 5.
Com 9 temas de cores projetados profissionalmente e uma interface de alternância inteligente, você pode alternar o estilo do gráfico instantaneamente - do minimalismo limpo a configurações vibrantes de alto contraste - tudo com um único clique.
Quando os Traders Amam o Schemes 2.0 1. 9 Temas Premium - Do
Strategy Overview This robot is built on a simple and consistent logic:trade only in the direction of market structure, by combining Ichimoku cloud analysis with Alligator indicator crossovers. The goal is to identify momentum phases when a trend is established, while avoiding random entries during ranging conditions. The robot does not use martingale, does not use grid systems, and does not open multiple positions aggressively. It follows a disciplined and structured approach. Buy Conditions Th

Clear Candle Countdown for Every Chart Knowing the exact time left until the current candle closes helps in making timely trading decisions. Candle Timer Essential MT5 offers a visible countdown for all available MT5 timeframes directly on your chart. This tool is reliable, efficient, and easy to configure. Features Real-time candle countdown for all standard MT5 timeframes Customizable color scheme for header, timer, and description Auto-adaptive layout for optimal visibility on any chart Effic

This MQL5 indicator, detects candlestick patterns for BUY/SELL/NEUTRAL signals using dynamic tolerance and volume analysis. It features a minimizable GUI displaying the symbol and detected pattern, updating on new bars. Scans candles from current to 6 (six bars back), covering single-candle (Doji, Hammer, Marubozu), two-candle (Engulfing, Harami), three-candle (Morning Star, Three Soldiers), and up to six-candle patterns (Mat Hold). Part of Trader Menu Info v5 suite for enhanced trading insights

Trader Menu Info v5 is a powerful trading tool designed to enhance decision-making for traders by providing a comprehensive suite of analytical features. This advanced platform integrates multiple technical analysis components, delivering real-time insights directly within the trading environment. The first key feature is the detection of candlestick patterns, offering clear buy, sell, or neutral signals based on recognized formations such as Doji, Hammer, Engulfing, and more. This allows trader

UScalper30 – Expert Advisor de Negociação Automatizada ATR-RSI Resumo
O UScalper30 EA utiliza os indicadores ATR e RSI para identificar oportunidades de negociação próximas aos níveis de suporte e resistência, oferecendo entradas estruturadas e ferramentas automatizadas de gestão de risco. Principais funcionalidades Entradas com dupla confirmação Vendas quando RSI está sobrecomprado e preço próximo da resistência. Compras quando RSI está sobrevendido e preço próximo do suporte. Confirmação de m

Forex Genius EA – Gold Scalper (XAUUSD, M1–M5) Hello, traders! I am Forex Genius EA , a professional Expert Advisor crafted exclusively for Gold (XAUUSD) .
Optimized for scalping on 1-minute (HFT Mode) and 5-minute (Safe Mode) charts, I deliver fast, precise, and disciplined trades on Gold with strict risk management. No Martingale, no Grid – just a clean and systematic approach tailored for intraday Gold scalping. Key Benefits Works only on Gold (XAUUSD)
Optimized for M1 (High-Fre

SmartWay EA (formerly SmartTrade EA) is a professional Expert Advisor created specifically for trading XAUUSD (Gold) on MT5.
With the release of V2.0 , SmartWay introduces a powerful new feature: Smart Step Size Boost with Spike Detection . This upgrade makes the EA more adaptive in volatile markets and especially effective in one-way markets (bullish or bearish trends). It combines cycle-based money management , drawdown protection , and profit control to deliver stable an
O Mercado MetaTrader é um site simples e prático, onde os desenvolvedores podem vender seus aplicativos de negociação.
Nós iremos ajudá-lo a postar e explicar como descrever o seu produto para o mercado. Todos os aplicativos no Mercado são protegidos por criptografia e somente podem ser executados no computador de um comprador. Cópia ilegal é impossível.
Você está perdendo oportunidades de negociação:
- Aplicativos de negociação gratuitos
- 8 000+ sinais para cópia
- Notícias econômicas para análise dos mercados financeiros
Registro
Login
Se você não tem uma conta, por favor registre-se
Para login e uso do site MQL5.com, você deve ativar o uso de cookies.
Ative esta opção no seu navegador, caso contrário você não poderá fazer login.