YouTubeにあるマーケットチュートリアルビデオをご覧ください
ロボットや指標を購入する
仮想ホスティングで
EAを実行
EAを実行
ロボットや指標を購入前にテストする
マーケットで収入を得る
販売のためにプロダクトをプレゼンテーションする方法
MetaTrader 5のためのエキスパートアドバイザーとインディケータ - 157

COMPLETE DESCRIPTION OF EXPERT ADVISOR - Eurusd Trend Pro Quantum GENERAL PURPOSE
Professional EA that combines trend strategies with momentum, managing risk in an advanced way and protecting capital through multiple safety systems. MAIN TRADING STRATEGY
Indicators Used: EMA Fast (14) and EMA Slow (28) - To identify the trend Stochastic (8,3,6) - To identify momentum and overbought/oversold levels Entry Signals: BUY SIGNAL: EMA Fast > EMA Slow (Uptrend) AND Stochastic: Bullish crossover (%K >
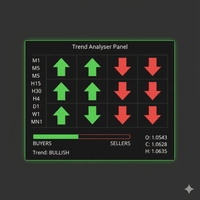
The Trend Analysis Dashboard is a powerful, all-in-one technical analysis tool designed for traders who need a clear, consolidated view of market momentum across multiple timeframes. Instead of cluttering your chart with numerous separate indicators, this tool aggregates signals from four key oscillators (Stochastic, RSI, and dual CCI) into a single, easy-to-read panel. It calculates the directional bias (Buy, Sell, or Neutral) for each enabled timeframe and provides a visual summary of over

BVCandleView は、数値の丸め処理によって裁量トレードを視覚的にサポートする新感覚インジケーターです。 無料のカスタムシンボル発行サービスを組み合わせれば、ボブ・ボルマン流(BV流)のティックチャートを MetaTrader 5 で再現できます。
価格の丸みと色分けで、1ティックの動きまで直感的に把握できます。 クイックマニュアル 導入方法 BVCandleView.mq5 を MQL5/Indicators フォルダに配置。 MetaTrader 5 を再起動し、任意のチャートへインジケーターを適用。
主な設定項目 Rounding Settings : 丸め種別(四捨五入・切り上げ・切り捨て・丸めなし)、小数桁数、ステップ幅、ティックサイズ強制。 Display Settings : インフォラベル表示と位置・色。 Grid Line Settings / Current Price Line Settings : グリッドラインと現在値ラインの表示調整。 Candle Colors : 基準・上昇・下降キャンドルの色指定。
活用ポイント 丸め設定により、レンジ感やテ

ChrisFX AUTOBOT – Smart Semi-Automatic Control ChrisFX AUTOBOT is a semi-automatic Expert Advisor designed for active traders who want to stay in control while benefiting from automated risk management.
It features an automatic BreakEven system and smart partial close management , offering the perfect balance between manual decision and algorithmic precision. Main Features BUY / SELL buttons directly on the chart Automatic BreakEven after X points (fully configurable) Automatic partial close (50

THV Smart Limit Manager MT5 — Intelligent Pending Order Controller THV Smart Limit Manager MT5 is an advanced Expert Advisor designed to intelligently manage Buy/Sell Limit orders using either manual horizontal lines or automatic logic .
It provides full control over pending order placement, spacing, lot scaling, recovery, and risk management — all in a simple and visual way. Key Features : 1. Smart Buy/Sell Limit Management Automatically places Buy or Sell Limit orders below/above your defined

ASM Scalper is a combo of three fully automated Expert Advisors which works on XAUUSD & BTCUSD. Those work together in real time to make, evaluate, and continuously optimize trading decisions.
EA 1. This takes two trades per day one buy side and another one sell side on XAUUSD. We may keep 3-6% per trade risk as it have good accuracy record and quick trailing. It have very good continuous winning streak and less loosing streaks. EA 2. This EA takes trades as momentum comes having 1-3% per

" Stern " is a cutting-edge Forex trading bot designed for advanced traders. This high-tech tool is an indispensable assistant for anyone who wants to automate their trading processes as much as possible. The bot's algorithm is based on pending orders, which are placed at a certain distance from the current price and are triggered only when the price reaches a specified level. The bot also uses trailing pending orders, which is activated when the price moves. As soon as the order becomes a mark

" Nibelung " is an advanced trading bot created for modern Forex traders. This innovative tool is a reliable assistant for anyone seeking efficient and automated trading.
The bot uses pending orders as one of the main elements of its algorithm. Pending orders are placed at a certain distance from the current price and are triggered only when the price reaches a specified level. In addition, when the price moves, trailing pending orders is activated. Once the order becomes market, the bot autom

Expert Forex Market Analysis Using Elliott Wave Theory Introduction Forex market analysis using Elliott Wave Theory offers new opportunities for accurately forecasting currency pair movements. Herodotus, an expert in technical analysis, applies this method to study the dynamics of key currency pairs: EUR/USD GBP/USD USD/JPY AUD/USD USD/CHF EUR/GBP EUR/JPY NZD/USD USD/CAD EUR/CHF AUD/JPY CAD/JPY Elliott Wave Theory This technical analysis method describes price fluctuations as recurring wave stru

Sliding Block — Intelligent Trading Expert Advisor for Forex Sliding Block is a powerful and reliable trading bot developed for traders seeking stable and fully automated trading. This Expert Advisor (EA) is built on intelligent market analysis and operates using pending orders with advanced position management and multi-layered protection mechanisms. Thanks to its flexible settings and robust architecture, Sliding Block adapts to various market conditions, delivering high efficiency in bo

Dynamic Dollar Value Indicator - Know Your Risk Before You Trade! Stop guessing and start knowing exactly what every price move means in real dollar terms! The Dynamic Dollar Value Indicator is an essential tool for professional traders who want instant visibility into the monetary value of price movements for any trading instrument. KEY FEATURES: REAL-TIME DOLLAR CALCULATIONS: Instantly displays the dollar value of 1% price moves for any symbol Automatically adapts to Forex, Stocks, In

期間限定の発売価格: 現在の 800 価格は割引されています!最終価格は 1024 に上昇します。 高度なリスク管理EA
Nova Stem は、スマートなリスクマネージャーとプロップファームトレーダー向けに特別に設計された堅牢なエキスパートアドバイザーです。それは GBPJPY で完全に自動化され、 M15 をベースチャートとして使用します。EAを 1つのチャートのみに ロードし、精密なロジックにすべてを任せてください。
ボーナスを含む: 購入後にメッセージを送信して、あなたの 無料 エキスパートアドバイザーを請求してください。 有効な バックテスト 結果については、私に連絡して、ガイダンスと セットアップファイル を共有します。 ご連絡いただければ、 デモ専用の試用版をお送りします。
“厳格なドローダウン管理とニュースフィルターを備えた — Nova Stem は生存と成長のために構築されています。”
主な機能 ベースに基づく機能: モメンタム加速パターンを使用して衝動的な市場フェーズを特定し、マイナーな引き戻しの終わりに取引を開始し、私がゼロから設計したボラティリテ

DUAL-ENGINE ANALYSIS SYSTEM: Average Tick Size Indicator : Measures bid movement strength across 6 customizable lookback periods (36, 96, 369, 500, 1000, 2000 ticks) Multi Timeframe Tick Analyzer : Calculates buy/sell pressure percentages across 6 different timeframes (100.200,300,400,500,600 ticks) REAL-TIME SIGNAL GENERATION: Combined Buy/Sell Alerts : Only triggers when BOTH analytical engines confirm the same direction Visual Arrow Signals : Clear green up arrows for buy signals, red down

外国為替市場におけるあなたの究極のパートナー。 EURCAD 取引ペアに専念しているChase the Emberは、最適な時間枠 M30 の力を利用して、市場の複雑さを乗り越えます。市場の動きやパターンの intricacies に深く掘り下げ、レンジトレードに取り組むように綿密に設計されています。 Chase the Ember戦略: 正確な詳細を共有することはできませんが、基本的な内容は以下の通りです: Chase the Emberは、リアルタイムで膨大なデータセットを分析し、継続的に学習し新しい市場条件に適応する最先端の機械学習アルゴリズムを活用しています。このシステムは、視覚的には見えない市場データ内の隠れたパターンを特定するためにニューラルネットワークを適用します。このアプローチにより、EAは過去のトレンドと現在の市場条件に基づいて予測的なエントリーとイグジットを行うことができます。20年分の歴史的データを活用し、常に自らをトレーニングすることで、市場の一歩先を行きます。
Link to instructions Manual blog: https://www.mql

Forex EA Manager - Professional Position Management Tool Overview Forex EA Manager is a sophisticated MetaTrader 5 Expert Advisor designed to provide professional position management capabilities for forex traders. This EA focuses on risk management and trade optimization through advanced order management features. Key Features ️ Risk Management Automated Stop Loss & Take Profit : Configurable SL/TP levels with pip-based calculation Flexible TP/SL Control : Enable/disable functionality b

この EA は主に XAUUSD のスキャルピング用です。
目的 トレード管理から感情を排除 ― ポジションを自動で保護し、利益を確定させ、プレッシャーの下で難しい判断をする必要をなくします。
機能 ️ 自動ストップロス 直近の高値/安値+バッファに基づいて SL を設定 手動配置のストレスなし 自動部分利益確定 2モード: 固定移動:価格が X 動いた後 50% をクローズ R 比率:1.2R の利益目標で 50% をクローズ 勝者を走らせながら利益を確保。
️ ワンクリックボタン すべてクローズ 売り/買い/利益/全て オプション:時間でフィルター(直近 60分) よくある問題を解決 早すぎる利益確定 神経質なストップ移動 感情的な判断 一貫性のないリスク管理 ️ キー設定 振り返り:20分(SL 設定用) バッファ:0.2 ピップ 追加の安全 部分 %:50%(利益確定サイズ) R 比率:1.2R(利益トリガー) 最適対象 感情的な干渉なし
Swing Master Auto Pro – Adaptive Swing High/Low Detector Turn Market Swings Into Smart Entries!
No more manual tuning — Swing Master Auto Pro automatically adjusts its sensitivity based on your timeframe . Whether you trade fast M1 scalps or long-term D1 setups, this indicator intelligently adapts to deliver accurate swing highs and lows , perfectly balanced for each chart. Key Features Automatic Timeframe Optimization – Forget manual tweaking! The indicator automatically sets the ideal Swing

このインジケーターは主に XAUUSD のスキャルピングに使用されます。 以下の期間における始値、安値、高値を表示します: 当日 前日 今週 先週 今月 先月 これらの価格レベルに基づいて、価格が反応しやすいレベルを特定することができます。 ご質問やご要望がありましたら、チャットでお気軽にご連絡ください。 ありがとうございます。良い一日をお過ごしください!
-------- This indicator is primarily used for scalping XAUUSD. It marks the Open, Low, and High prices for: the current day the previous day the current week the previous week the current month the previous month Based on these price levels, you can identify which levels the price is likely to react to. If you have an

️ Power Moving Average Signals 概要: Power Moving Average Signals は、2本の移動平均線(MA)—高速と低速—の交差に基づいたトレンドフォロー型のトレーディング戦略です。モメンタムの変化を捉え、明確な 買い・売りシグナル を生成します: 買いシグナル :高速MAが低速MAを上抜けしたとき 売りシグナル :高速MAが低速MAを下抜けしたとき 通貨ペアに最適化: この戦略は、特に 外国為替市場(FX) において優れたパフォーマンスを発揮します。トレンドが明確な相場で効果的に機能し、早期のエントリーと効率的なトレンド追従を可能にします。 ️ 推奨タイムフレーム: 5分足以上のチャート (M5、M15、H1など)での使用が推奨されます。ノイズが少なく、シグナルの信頼性が高まります。 主なメリット: シンプルで直感的なロジック 初心者から上級者まで幅広く対応 MetaTrader 5 プラットフォームに対応 複数の銘柄とタイムフレームで使用可能 ️ プロのヒント: ボラティリティフィルターや他の確認インジ

Comprehensive Multi-Timeframe Volume-Based Support and Resistance Indicator Overview VolumePoint Pro is a complete analytical tool built around the concept of Point of Control (POC) — the price level where the highest traded volume occurred during a specific session or period.
By tracking and displaying these price nodes over multiple timeframes, the indicator allows traders to clearly identify zones of high market participation, which often act as powerful support and resistance levels. The ind

BlockLongTimeFlexible - 時間ブロックビューアー
市場の時間分析をマスター
BlockLongTimeFlexibleは、プロフェッショナルで直感的に時間枠を視覚化・分析する必要があるトレーダーやアナリストのための究極のツールです。チャート上に直接、サイクル、季節性、時間パターンを強調するカスタマイズ可能な視覚的長方形を作成します。 BlockLongTimeFlexibleインジケーター簡易マニュアル
このインジケーターの機能
特定の期間をマークするために、チャート上に色付きの長方形を作成します。季節パターン、市場サイクルの分析、期間比較に最適です。 3ステップの基本設定
1. 期間タイプの選択
年/月/週:時間単位を選択
ブロックあたりの単位数:各長方形が表す単位数(例:2週間)
ブロック数:作成する長方形の数 2. 日付の定義(オプション)
固定日付を使用:特定の期間にチェック
開始/終了日:最初の長方形を定義
次の長方形は自動的に作成されます 3. 色のカスタマイズ
メインカラー:すべてのブロック用
カラーグループ:特定のブロック

OptiBot 日足終値 MT5
パーセンタイル、ATR%、リスク管理による終値の統計分析 日足終値の統計分析:視覚的な分布、5段階のパーセンタイル、ATR%、市場効率。プロフェッショナルな仏/英インターフェース。 OptiBot Trading によって開発されたこのインジケーターは、日足終値に基づいた10以上の統計的メトリクスを組み合わせ、客観的かつ定量的なトレーディングの意思決定を支援します。 このインジケーターで可能な戦略 OptiBot 日足終値は、独自の戦略を開発するために必要な統計データを提供します。 統計的ストップロス: 95%パーセンタイルを使用して、実際の銘柄の挙動に基づき、わずか2.5%の確率でしかヒットしないストップを設定します。 ATR ポジションサイジング: ATR%で測定された実際のボラティリティに従ってポジションサイズを調整し、一定のリスクを維持します。 極端値の取引: 90%パーセンタイルを超える例外的な動きを特定し、統計的な平均への回帰を予測します。 市場レジームへの適応: 効率比率を使用して、市場がトレンド状態(>60%)にあるか、ノイズ(<40

=== Attention ===== before stating to use this project please watch the video.
this is the first step of all-in-one project which will be updated day by day. This version (1.01) will be for Trade - Entry. you can have Market and pending orders - lot size - take profit and stop loss. Take profit and stop loss have 4 different type which is point - money - percent - price and we have RR for take profit. You can calculate lot size based on points and money. you can have visual stoploss and takepr

ExtaGold Robot: A Rule-Based Trading Algorithm
Description: The ExtaGold Robot is an automated trading system that executes trades based on a predefined set of technical analysis rules. The strategy prioritizes transparency in its logic over the use of artificial intelligence or machine learning.
Key Features:
Methodology: The algorithm's decisions are based on technical analysis concepts, including price action analysis and the identification of support and resistance levels.
Strategy Tran

Overview If you trade using Smart Money Concepts or market structure strategies, this tool instantly makes your charts cleaner and your structure reading much easier. Smart Leg Structure PRO automatically identifies the most recent market leg, marks the high, low, and equilibrium, and shows every Fair Value Gap (FVG) and swing point in seconds. No more guessing or manually redrawing lines — this indicator gives you a full view of how price moves between premium and discount zones. It uses profes

GoldenPulse PRO – High Winrate is a fully automated Expert Advisor designed to trade Gold (XAUUSD) with precision and consistency. It uses a proprietary momentum/volatility framework that adapts to changing conditions, focusing on high win rate and controlled drawdown —without grid, martingale, or risky averaging. Key Features 100% automated — plug & play Optimized for XAUUSD , compatible with other symbols Smart logic — no martingale, no grid, no averaging Minimal interface — only Lot Size
# Lean ORB Pro V1 "The Phoenix" - Product Description (English)
**Product Name:** Lean ORB Pro V1
**Short Description:** Expert Advisor for MetaTrader 5 that combines Opening Range Breakout with Fair Value Gap detection. Designed for US indices, works with various trading instruments.
---
## Full Product Description
### Overview
Lean ORB Pro V1 is an Expert Advisor for MetaTrader 5 that combines Opening Range Breakout strategies with price action concepts.
The Expert Advisor has been de

Smaf (Smooth AF) Ride the market trend without the hassle of analyzing the chart. Simply attach Smaf on the symbol you want to trade and let it do it's thing.
Works well on volatile and trending markets.
Auto calculate lot sizes base on risk percent and risk distance Trailing stops implemented base on current volatility Auto closes positions if risky (buy and sell managed) Risk:Reward Ratio 1:3 ensures that profit and recovery factors are healthy Healthy metrics backtest all you want.
*Thank y

ライブ結果:
期間限定オファー: 価格が上がる前に最高の取引を手に入れよう! 最終価格: 990$ ゲームチェンジャーと出会う: Dream Reactor トレードを行うだけでなく、リスク管理をより良くするために各オーダーを戦略的に管理するEAを想像してみてください。 Dream Reactor は、価格変動にすぐに適応し、変動の激しい市場で優れたパフォーマンスを発揮するように構築されています。すべてのポジションを複数の小さなオーダーに分割し、それぞれにカスタマイズされたテイクプロフィットレベルを設定する独自のアプローチを特徴としており、利益とリスクの精密な管理を可能にします。 特別な理由は何ですか? カスタマイズ可能な分割システム: オーダーの分割方法を管理し、リスク管理を調整できます。それぞれのセグメントは異なる市場状況に合わせて調整可能です。 モメンタムパルスエントリー: 価格モメンタムの急激な変化を追跡し、急な買いまたは売りの活動を検出する独自のアプローチを使用します。 適応型ポジショニング: 市場のモメンタムの変化に応じて自動的に取引サイズを調整し、強いトレンドと統合フ

Haven Breakout Channels - ブレイクアウト取引の鍵 ご紹介します Haven Breakout Channels – これは、コンソリデーションゾーン(価格チャネル)を自動的に検出し、そのブレイクアウトの瞬間を正確に特定するために設計されたインテリジェントなインジケーターです。ボラティリティ分析に基づいており、手動でフラットな領域を探す手間を省き、最も重要なこと、つまり新しい動きの始まりに取引を開始することに集中できます。 私の他の製品 -> こちら . 「コンソリデーションからエクスパンションへ」という市場サイクルを理解することは、多くの成功した戦略の基礎です。Haven Breakout Channelsはこれらのフェーズを視覚化し、「嵐の前の静けさ」をハイライトし、価格がレンジから抜け出す準備ができたときにシグナルを発します。 インジケーターの主要シグナル チャネルの形成 – インジケーターは低ボラティリティの期間を自動的に検出し、チャート上に価格チャネルを描画します。これは、将来の動きのポテンシャルが蓄積される監視ゾーンです。 ブレイクアウトシグナル

Friendly Bot is a multi-currency, multi-functional advisor that works on any time frame and in any market conditions. - The robot’s operation is based on an averaging system with a non-geometric progression of constructing a trading grid. - Built-in protection systems: special filters, spread control, internal trading time limitation. - Construction of a trading network taking into account important internal levels. - Ability to customize the aggressiveness of trading.
The Expert Advisor com

Exotic Bot is a multi -cream multifunctional adviser working on any time frame and in any market conditions. The robot’s work is taken as a system of averaging with the non -geometric progression of the construction of a trading grid. Built -in protection systems: special filters, spreading, internal restriction of trading time. Building a trading grid, taking into account important internal levels. The ability to configure trading aggressiveness. Work postponed orders with trailing orders. T

Trinitron Bot : A Multifunctional and Multi-Currency Trading Advisor
Trinitron Bot is a sophisticated and versatile trading advisor designed to operate seamlessly across various timeframes and market conditions.
Key Features: Averaging System with Non-Geometric Progression: Trinitron Bot utilizes an advanced averaging system that constructs a trading grid based on non-geometric progression, enhancing its adaptability and efficiency. Built-in Protection Systems: The advisor includes specialize

Exorcist Bot is a multi-currency, multi-functional advisor that works on any time frame and in any market conditions. - The robot’s operation is based on an averaging system with a non-geometric progression of constructing a trading grid. - Built-in protection systems: special filters, spread control, internal trading time limitation. - Construction of a trading network taking into account important internal levels. - Ability to customize the aggressiveness of trading. - Working with pending

Ultima Trader is a multi-currency advisor that can effectively operate on different time frames and in a variety of market scenarios thanks to its advanced non-geometric progression averaging system. This feature allows him to build trading grids and determine the moments of entry into the market with high accuracy.
Main characteristics of Ultima Trader: Security systems: The advisor is equipped with special filters, spread control and trading time limits to ensure safety and reliability. Ac

RiskShield Dragon — Automated Multi-Currency Advisor
Combining intelligent algorithms, robust protection mechanisms, and flexible configuration, **RiskShield Dragon** delivers consistent profits with minimal risk.
---
## Key Advantages
* **Multi-Currency & Multi-Threaded**: Supports over 20 currency pairs (EURUSD, GBPUSD, USDJPY, AUDUSD, NZDJPY, and more) simultaneously on any timeframe. * **Minimum Deposit from 10,000**: Optimized for trading with a starting balance of 10,000 account uni

Correct Approach is a multi-currency multi-functional Expert Advisor that works on any time frame and in any market conditions. The robot is based on an averaging system with a non-geometric progression of building a trading grid. Built-in protection systems: special filters, spread control, internal trading time limit. Building a trading grid taking into account important internal levels. Possibility to adjust trading aggressiveness.
The Expert Advisor comes with proven templates for variou

GoldDigger AI — Expert Advisor for XAUUSD GoldDigger AI is an automated Expert Advisor designed for the XAUUSD instrument. The EA evaluates breakout and trend conditions using adaptive price channels and volatility-based filters, and manages positions through its internal exposure-control logic. Strategy Overview Price-channel calculations are used to define dynamic upper and lower ranges based on market volatility. The EA evaluates breakout and retracement conditions around these ranges and man

Super Trend Entry Signal Indicator is a powerful trading tool designed to identify precise entry points based on market volatility. Using the Average True Range (ATR) as its core, this indicator dynamically adjusts to current market conditions — helping traders spot potential breakout or reversal opportunities with confidence. Key Features: - Volatility-Based Entries: Calculates entry zones using real-time ATR values for adaptive precision. - Multi-Timeframe Support: Works seamlessly on any time

Introducing Dzidula : Your Ultimate Trading Companion Unlock the full potential of your trading strategy with Dzidula, a cutting-edge trading robot powered by advanced Q-learning algorithms. Designed to adapt and thrive in dynamic market conditions, this innovative tool is your key to smarter, more profitable trading. Key Features: Advanced Q-Learning Algorithm : Harness the power of machine learning to make informed trading decisions. Continuously improve and adapt strategies based on real-tim

SMC Indicator for MT5 – Trade Like Institutions Unlock the power of institutional trading with the Smart Money Concepts (SMC) Indicator for MetaTrader 5 . Designed for traders who want to go beyond retail strategies, this advanced tool helps you identify market structure shifts, order blocks, liquidity zones, and fair value gaps with precision and clarity. Key Features: Automatic Market Structure Detection : Instantly spot Breaks of Structure (BOS), CHoCH, and trend shifts. Multi-Timeframe

RangeZone Indicator General Overview: Global Exchange Trading from East to West World financial markets operate on the principle of continuous trading sessions, where activity moves with the sun from one financial center to another. Understanding this dynamic is key to successful trading! How Trading Moves Around the World: Asian Session (Sydney, Tokyo): Opens first, sets the tone for daily volatility Japanese yen, Australian dollar, Asian indices Often forms key support/resistance level

NextStep EA: Advanced Algorithmic Trading for Deriv Step Indices & More. NextStep EA is a premium MT5 Expert Advisor, uniquely optimized for Step Index. It combines dual strategies, multi-timeframe analysis, and advanced risk management for automated synthetic indices trading. This EA works with any broker and operates on any pair, including GOLD (XAUUSD). Contact me for recommended setups and the best configurations. Limited Time Offer: Buy NextStep EA The special price of $350 is available f
The Trend Force indicator is a professional analytical tool designed to accurately measure the strength of the overall market trend . It works on all currency pairs and timeframes , and is especially effective in highlighting strong and stable trends that traders can confidently act upon. Trend Force utilizes an advanced algorithm to gauge market momentum, clearly indicating the strength of bullish or bearish trends. This makes it easy to make informed trading decisions, either by relying on it

M-Sync EA Description Stop guessing on news days. M-Sync News Trader is a semi-automated tool built for traders who want control and clarity during high-impact events like NFP, CPI, and rate decisions. It helps you plan, execute, and manage a professional news straddle — automatically placing Buy/Sell Stop orders before the event, triggering one as the news hits, and instantly cancelling the other. You define your rules, and M-Sync handles the rest.
Key Features Smart Straddle Setup: Automatica
Super Entry Signals MT5 — Trend Entries That Make Sense
Trade with structure, not guesses. Super Entry Signals MT5 finds clear, rule‑based breakout opportunities in the direction of the prevailing move and presents them with clean arrows and an optional horizontal guideline from the signal candle. It’s built for practical, trend‑based execution: spot the pullback, confirm strength, and enter on a decisive breach — with alerts ready the moment a bar opens.
Recommended use: H1 and H4 on Metals

HedgeGold v3.8 – Smart Hedge Chain Strategy by eilyaz zenza HedgeGold is a robust, trend-following Expert Advisor that employs a dynamic hedge-chain mechanism to manage risk and capture market movements across major forex pairs and gold (XAUUSD). Using an EMA50 filter, the EA only opens trades in the direction of the trend. When a position is open, it automatically places counter-directional hedge orders at predefined intervals, creating a resilient grid that adapts to price volatility. All ord

Turbo Next is a high-performance trading bot for the Forex market, designed to automate trading strategies and adapt to the ever-changing market conditions. This tool utilizes advanced algorithms to process market data, allowing it to automatically identify optimal entry and exit points, minimizing human error and improving trading results. Key Features of Turbo Next : Support for Multiple Currency Pairs : Turbo Next works with a wide range of currency pairs such as EURUSD, GBPUSD, USDJPY, A

If you're tired of trying to keep up with the unpredictable market, then it's time to let the Gipo Trex bot work its magic. This bot is designed to catch big price swings up or down, allowing you to perform at your best when the market moves in your favor.
Gipo Trex is a unique tool that helps traders make the most of a volatile market. With two different bot modes, you can find the perfect setup for your individual needs and trading style. Whether you are a beginner or an experienced trad

Professional robot Star Boticum, which implements a trading strategy with different indicators and at different time intervals. It goes through the whole history and many currency pairs with a single setting. Unique trading system! You can work on any hourly period, any currency pair and on the server of any broker. It is recommended to work on liquid forex pairs, with a low spread. The smaller the commission and spread, the greater the profit. You can start using it with 10000$ and 0.01 lot. T

Forex Workstation is a powerful and efficient Forex trading bot designed to use patterns, price hold levels, volatility analysis and market scaling. This bot offers unique capabilities for automated trading and optimization of strategies on various currency pairs. Let's look at the main functions and settings of Forex Workstation: Main functions: • Multicurrency: Forex Workstation supports a wide range of currency pairs, which allows you to diversify your portfolio and distribute risks. • Usin

The Cyberosaurus bot is an innovative next-generation bot that serves as a powerful tool for trading in the classic Forex market and with cryptocurrencies (for corresponding brokers). It operates with the majority of pairs, so it is advisable to test it before using it on a specific pair. It is specifically designed to work with these markets, without the ability to trade other assets such as stocks or indices.
The main control parameters of the bot are presented in a convenient and conci

Description of Simo : an innovative robot with a unique trading system
Simo is a revolutionary trading robot that changes the rules of the game with its unique trading system. Using sentiment analysis and machine learning, Simo takes trading to a new level. This robot can work on any time frame, with any currency pair, and on the server of any broker.
Simo uses its own algorithm to make trading decisions. Various approaches to analyzing input data allow the robot to make more informed decis

Form Designer : Advanced Trading Bot for Forex and Cryptocurrency Markets
Form Designer represents the latest advancement in automated trading technology designed to perform optimally in both the Forex and Cryptocurrency markets (with supported brokers). This highly effective tool has unique capabilities, making it an indispensable assistant for traders.
Key features and benefits: Multi-currency: Form Designer supports a wide range of currency pairs, providing flexibility and versatility in t
**Quantum Signal** is a professional Expert Advisor engineered for fully automated trading on Forex and cryptocurrency markets. Crafted to meet MQL5 Market standards, it combines cutting-edge algorithms, flexible risk controls and an intuitive settings interface to deliver consistent profits and minimal drawdown. A minimum deposit of **10 000 USD** unlocks trading on most major and minor currency pairs as well as crypto symbols.
---
## Overview & Purpose
* Automates trade entries and exits u

OPTIMUS PRIME - Professional Gold Trading System with Real-Time Economic Calendar Protection
Transform Your Gold Trading with Military-Grade Precision
OPTIMUS PRIME is a complete trading ecosystem combining cutting-edge technical analysis with real-time economic calendar protection. Built for serious traders who demand both performance and safety.
KEY FEATURES
Battle-Tested Strategy - Multi-Timeframe Trend Analysis (M5 + M30) ensures trades only with strongest market momentum - Smart Engulfi

ROSSI CAMPOS TRAILING STOP AUTO EA - あなたの利益を守るインテリジェントガーディアン! なぜ作られたのか?
効率的なトレーリングストップがないために利益が失われることが何度もありました。既存のソリューションは複雑すぎたり、重かったり、信頼性に欠けていました。そこで、軽量で正確、そして信頼できるアシスタントを作ることにしました — 手間なく自動で利益を守ってくれるものを。 使い方は?(プログラマー以外向け) 設定項目: 初期ストップロスとテイクプロフィット — 基本的な保護として トリガー — いくつ利益が出たらトレーリングストップを開始するか ステップ — 価格に合わせてストップロスが動く幅 市場がトリガーに達すると、EA が自動的にストップロスを調整し、利益を確保しつつリスクを低減します。まるで 24 時間 365 日そばにいるプロのようです! ユニークな特徴: 軽量 & 安定 — フリーズや衝突なし 直感的な設定 — フィールドを入力するだけ! 高精度 — リアルタイムのティックに基づく計算 汎用性 — どんな資産・時間足にも対応 完全自動 —

Shadow Pulse 概要 Shadow Pulseは、平均回帰法に基づいて反転ポイントを特定するプロフェッショナルなインジケーターです。インテリジェントなマルチレベルフィルタリングシステムを使用して、高精度の売買シグナルを生成します。 トレーディング戦略 このインジケーターはM1からH4までのあらゆる時間軸で動作するように設計されており、ゴールド(XAUUSD)のスキャルピングで卓越した結果を示します。低時間軸でのアグレッシブな取引から、高時間軸での中期ポジションまで効果的に適用できます。 価格の勢いが枯渇する瞬間を特定し、その後リバウンドでポジションに入るという原理で機能します。システムは主要レベルに対する価格の過剰な伸びの臨界ゾーンを特定し、反転の動きを確認した時のみシグナルを形成します。 矢印は閉じた足でのみ表示され、決して再描画されません。これはシグナルの絶対的な安定性を保証し、あらゆる期間におけるインジケーターの過去のパフォーマンスを客観的に評価できます。 • 足の下の青い矢印 — ロングポジション(買い)を開くシグナル
• 足の上の赤い矢印 — ショートポジション(売

HighLow Fury EA は、リスク管理と資本管理を統合したブレイクアウト型の自動売買ロボットです。
口座リスク率(%)または固定ロットに基づき、ポジションサイズを動的に調整し、常に安定したリスクコントロールを実現します。 日次の損益制限機能により、口座残高を保護し、過度な取引や感情的な判断を防ぎます。 設定された利益目標または損失に達した際には、自動的に資金リスクを減少させ、利益を確保します。 複数のトレーリングストップオプション(高値/安値、過去のローソク足基準)を備え、柔軟なリスク調整が可能です。 取引時間や曜日を指定できるカスタムフィルターと、ポジションの最大保有時間を制御する機能を搭載。 MetaTrader 5上で安定動作し、すべてのシンボルとタイムフレームに対応しています。 初期設定はXAUUSD(2025)向けに最適化されており、ユーザーは自身の取引スタイルや市場環境に合わせて自由に調整可能です。
短期および中期の戦略に対応し、高ボラティリティ市場でも安定したパフォーマンスを発揮します。

Indicator Name: BreakingConfirmedLevel
Type: Professional indicator for detecting confirmed breakouts of strong price levels Description:
The BreakingConfirmedLevel indicator is an advanced tool designed to detect confirmed breakouts of strong price levels in the market. It relies on precise price action analysis and multi-layer confirmation logic before generating any signal. This ensures highly accurate entry points after a real breakout, minimizing false signals and increasing consistency in

MultiDivBot
MultiDivBot
- 高度なマルチ通貨システム
2020-2025年のバックテスト成功による実証済み戦略!
概要
MultiDivBotは、現代のアルゴリズム取引の進化を体現するものです:高度なテクニカル分析、比例的なリスク管理、高精度の執行を組み合わせた智能的なマルチ通貨システムです。主要7通貨ペアでの取引のために設計されたこのボットは、5年間にわたる厳格なテストで一貫したパフォーマンスを実証しました。
---
独占的特長
智能マルチ通貨システム
· EURUSD、GBPUSD、USDJPY、USDCAD、AUDUSD、NZDUSD、USDCHFのリアルタイム監視 · 機会スコアに基づく最適通貨ペアの動的選択 · 収益性を最大化するための5分毎の継続的再評価
マルチタイムフレーム戦略
· マルチタイムフレーム確認(M15、M30、H1、H4) · 取引には最低3/4のタイムフレーム一致が必要 · 複数EMAを用いた統合トレンド分析
複数エントリーシステム
1. 感度フィルターを備えた高度なEMA

THV Sniper Pro is a multi-functional, precision trading system designed for both manual and automated scalping strategies . It delivers complete flexibility by combining advanced technical filters, equity management, DCA logic, and fully interactive chart controls — giving traders full control in any market condition. - Works with all symbols and timeframes . Key Features : Smart Trade Control: Manual or automatic trade entries (Buy/Sell toggles). Multiple trading modes for full customization a
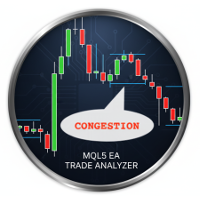
Accumulation zone indicator that identifies congestion caused by a large initial candle containing, between its high and low, the close of at least four subsequent candles. This indicator allows you to identify accumulation zones that can generate market price accelerations. Useful for analyzing historical data (you can freely configure the number of historical candles to analyze and the number of candles forming the congestion) and building your own trading strategy.

DARE Institutional Scalper (MT5)
An Automated Capital-Protected Scalping System This is an institutional-grade scalping bot with adaptive risk sizing, automated drawdown control, and compliance-level dashboards.
Developed by DARE Investments for professional traders and asset managers. DARE Institutional Scalper V1 is a high-performance trading algorithm built for MetaTrader 5 , designed to execute disciplined, data-driven scalping strategies under strict institutional risk limits. It combine

A decision-support indicator for MetaTrader 5 that visualizes market structure using two complementary elements: adaptive Support/Resistance zones and a best-fit Trend Channel computed by regression. Zones scale with volatility (ATR and smoothed ATR) and update only after a pivot is validated, which helps filter noise. The channel shows prevailing slope and parallel boundaries based on average deviation; optional dotted alternatives provide additional confluence. The tool works on any symbol a

Exclusive Prime MT5 — MetaTrader 5 向けプロフェッショナル取引アドバイザー Exclusive Prime MT5 は次世代のエキスパートアドバイザーであり、自動化・安定性・厳格なリスク管理を重視するトレーダーのために設計されています。アルゴリズムは市場の知的分析と資金管理システムを組み合わせ、正確な取引執行と多様な市場環境への適応を実現します。 注意!購入後すぐにご連絡ください 。設定手順をお渡しします。 重要: すべての例、スクリーンショット、テストはデモ目的のみです。あるブローカーで特定の通貨ペアが良好な結果を示しても、他のブローカーでも同様になるとは限りません。各ブローカーには独自のレート、スプレッド、取引条件があります。したがって、 各通貨ペアはユーザー自身が最適化する必要があります 。実際の口座では 必ず単一通貨モード で運用してください。マルチ通貨モードのスクリーンショットは例示のみです。市場環境は変化するため、最適化は少なくとも 年に一度 行うことを推奨します。 重要情報: デモ版アドバイザーは試用目的のみです。最適化を行わないテスト結

Volume Equilibrium(ボリューム・エクイリブリウム)インジケーターは、買いの出来高と売りの出来高が等しくなる水準を表示します。日、週、月、年ごとにこれらのレベルを計算することができます。 価格がラインの上にある場合、買いの出来高が優勢で、相場は強気(ブル)です。価格がラインの下にある場合、売りの出来高が優勢で、相場は弱気(ベア)です。 このインジケーターは、「Meravith」インジケーターのアルゴリズムを使用してレベルを算出します。出来高レベルは非常に精密に計算されます。インジケーターは自動で動作し、どのタイムフレームでも使用できます。 各ラインにはボタンがあり、表示したい出来高バランスレベルを選択することができます。また、インジケーター全体を表示/非表示にするためのボタンもあります。 より正確な結果を得るために、多くの顧客を持つ大手ブローカーを使用することをお勧めします。なぜなら、ブローカーは自社の顧客の出来高のみを表示するためです。

️ ProRiskManager: Professional Trade Management for MT5 Stop guessing lot sizes. Start trading like a professional. ProRiskManager is a visual trade management tool that calculates perfect position sizes and manages your trades automatically. Set your risk percentage once, focus on your strategy, and let the EA handle the math. New to ProRiskManager?
Read the Complete User Guide (5 min read) Core Features Smart Position Sizing Automatic Lot Calculation: Set your risk % (e.g., 1%) a

ブログ: https://www.mql5.com/en/blogs/post/765148 MT4 バージョン: https://www.mql5.com/en/market/product/154458 MT5 バージョン: https://www.mql5.com/en/market/product/154459
Telegram Order – MT4 向けスマートトレードマネージャー&Telegram 通知ツール
Telegram Order は、MetaTrader 4 向けのスマートトレードマネージャー&通知ツールです。 すべての注文(成行注文と未決済注文)を自動的に監視し、詳細な通知を Telegram に送信します(スクリーンショットの添付も可能)。また、チャートから直接、TP、SL、BE、トレーリング、Close All を管理できる直感的なパネルを提供します。
最適なユーザー: Telegramに自動シグナルを送信したいシグナルプロバイダー/FXコーチ 視覚的なTP/SLパネル、トレーリング、BEが必要な手動トレーダー すべての注文活動をTelegramに

ICT BANKER SOE PROP EA:機関グレードのスマートマネー取引システム ICT BANKER SOE PROP EAを紹介します。これは機関プレーヤーのように取引を行うために設計された高度なエキスパートアドバイザーで、Inner Circle Trader(ICT)コンセプトとスマートオーダー実行(SOE)を組み合わせています。この最先端システムは、市場構造のブレーク、流動性の操作、オーダーブロック、公正価値ギャップ(FVG)を活用し、複数の時間枠で高確率セットアップをキャプチャします。プロップファームトレーダー、小売投資家、アルゴリズム愛好家が、リスクの高い戦略なしで機関レベルのパフォーマンスを目指すために設計されています。 セットファイル:MQL5チャットリンク セール価格:$199.00のみ — 次の10販売に有効 | 次価格 $359.00 | お急ぎください 主要パラメーター、コンポーネントおよび機能 入力パラメーター:
– 取引設定:マジックナンバー、ロットサイズ、リスク%、最大スプレッド、日次損失制限、最大オープンポジション数。
– ストラテジー選択:6
MetaTraderマーケットは、他に類のない自動売買ロボットやテクニカル指標の販売場所です。
MQL5.community ユーザーメモを読んで、取引シグナルのコピー、フリーランサーによるカスタムアプリの開発、支払いシステムを経由した自動支払い、MQL5Cloud Networkなど、当社がトレーダーに対して提供するユニークなサービスについて詳しくご覧ください。
取引の機会を逃しています。
- 無料取引アプリ
- 8千を超えるシグナルをコピー
- 金融ニュースで金融マーケットを探索
新規登録
ログイン