YouTube'dan Mağaza ile ilgili eğitici videoları izleyin
Bir alım-satım robotu veya gösterge nasıl satın alınır?
Uzman Danışmanınızı
sanal sunucuda çalıştırın
sanal sunucuda çalıştırın
Satın almadan önce göstergeyi/alım-satım robotunu test edin
Mağazada kazanç sağlamak ister misiniz?
Satış için bir ürün nasıl sunulur?
MetaTrader 5 için Uzman Danışmanlar ve göstergeler - 150
ControleProfit – Painel de Operações para MetaTrader 5 O ControleProfit é um painel simples e objetivo desenvolvido para facilitar a execução manual de operações no MetaTrader 5.
Foi criado para traders que desejam praticidade, rapidez e organização, mantendo o gráfico limpo e livre de elementos desnecessários. Funcionalidades Execução rápida de ordens
Botões BUY e SELL com tamanhos de lote pré-definidos (1, 5, 10 e 15).
Ideal para operações rápidas sem abrir janelas adicionais. Encerramento im

ARM Gold Session Breakout PRO Asian Session Breakout for XAUUSD with Smart Trend & Volatility Filters
No Martingale · No Grid · Fixed Risk · Real Long-Term Logic Strategy Concept ARM Gold Session Breakout PRO is a professional automated trading system for MetaTrader 5 , designed specifically for XAUUSD (Gold) .
The EA trades a well-known institutional concept — the Asian Session Range Breakout , enhanced with trend filtering, ATR volatility control, spread protection, and margin validatio

Breakeven + Close All Manager (MT5) — Smart Trade Protection Panel Breakeven + Close All Manager is a lightweight but powerful MT5 trade-management tool designed for manual traders who want fast, precise, and automated risk control.
This utility adds movable on-chart buttons for instantly moving positions to breakeven or closing all trades at once — plus a fully automated Auto Breakeven engine that protects profits without you needing to monitor the charts. Perfect for scalpers, day traders,

Fulcrum Trading EA - Professional Trading EA with 4 different trading modes, Advanced AI & ML Logic The Fulcrum EA trades via Grid, Ladder, Hedging, Auto and Smart recovery modes. The EA is fully customizable. You can set the trading signals, indicators, lot sizes, profit points, stop losses and much more. It uses an ATR based dynamic stop loss, that you can configure to your preferences or a set stop loss in points. it uses a Martingale multipliers that is customizable to preference. It has bu
Harmonic based indicator. Recognizes several patterns: ABCD, 3 Drives, Gartley, Butterfly, Bat, Atlternative Bat, Deep Bat, Crab, Deep Crab, Cypher and Shark. Able to set SL and three levels of TP based on Fibonacci Levels. Three types of alerts are available: PopUp, Email and Push. Trade advices on chart and stats also printed for visual estimation. All patterns are formed by not repainting ZigZiag. Parameters for it are classic: InpDepth, InpDeviation,InpBackstep. MinComplete means the level

This system accepts a comma-separated list of symbols and iterates through them, creating a neural network with training for each symbol. These neural networks take values from price action, Bollinger Bands, MACD, and RSI indicators. The number of neurons for each of the three layers of each network can be configured, and genetic training for the indicator parameters can be set up at specific intervals. Confidence levels for the neurons can be adjusted, and market trend analysis filters can be

Stochastic RSI Pro : Professional-Grade Momentum Confluence Indicator for MT5
Enhance Your Trading Edge with Precision Momentum Analysis The Stochastic RSI indicator, originally developed by quantitative analysts Tushar S. Chande and Stanley Kroll in 1994, was specifically engineered to solve a critical limitation in traditional RSI analysis: the extended periods where RSI remains trapped between oversold and overbought levels without generating actionable signals. This MT5 implementation deli

HASH EA - Estrategia Profesional con Heiken Ashi Smoothed y Gestión de Riesgo Avanzada ¡Domina el mercado con precisión y control! El HASH EA es un Expert Advisor (EA) totalmente automatizado y listo para el mercado real, diseñado para traders exigentes que buscan señales claras, filtros robustos y una gestión de riesgo impecable. Basado en la potente combinación de Heiken Ashi Smoothed (descargable gratis desde el Mercado MQL5), EMA de tendencia, ADX opcional y ATR dinámico, este EA opera en cu

Hybrid Coco EA is a modern, tropical-themed automated trading system that blends simplicity with high-performance market technology. Inspired by the balance and clarity of a fresh young coconut, this EA delivers smooth and powerful trading using momentum-based indicators instead of traditional candle engines.
Built for gold and major forex pairs, Hybrid Coco uses multi-layered momentum analysis to detect early trend bursts, continuation waves, and exhaustion points—giving traders strong, cle
RSI Nexus Multi-timeframe (RSI-Nexus-MTF) RSI-Nexus-MTF is a multi-timeframe RSI engine designed to help algorithmic traders identify structure, context and trigger signals simultaneously. Inspired by Fractal Market Rhythm analysis, the indicator extracts the RSI trend from three layers of market flow: Long-Term Structure (HTF) Mid-Term Context (MTF) Short-Term Trigger (current timeframe) This makes the indicator especially powerful for robot developers , allowing EAs to read market conditions

Gold Trend Follower is a fully automated Expert Advisor designed specifically for trading XAUUSD (Gold).
It follows the higher timeframe trend and looks for trading opportunities on lower timeframes using price action confluence with bullish and bearish engulfing candlestick patterns . Strategy Overview The EA determines the dominant market trend from a higher timeframe (e.g. H1 or H4). Once the higher timeframe direction is confirmed, it shifts to a lower timeframe (M5 or M15) to identify en

Sasa XAUUSD H1 — Premium Expert Advisor for Gold Trading Sasa XAUUSD H1 is a fully automated Expert Advisor designed exclusively for the XAUUSD (Gold) market on the H1 timeframe . Built for traders who value long-term stability , controlled risk , and professional performance , the system uses an optimized Long-Only breakout structure , eliminating unnecessary Sell signals and focusing strictly on the statistically stronger bullish direction of Gold. With over 3 years of verified backtesting

AUTO RISK MANAGER PRO: Forex ticaretindeki ortağınız! AUTO RISK MANAGER PRO_MT4 — MT4 için sürüm Demo sürümü + detaylı açıklama Duygular yüzünden para kaybetmeyi bırakın!
Risk yönetimini profesyonel bir algoritmaya emanet etmenin zamanı geldi. Şu durumu hayal edin: piyasa pozisyonunuza karşı hızla hareket ediyor ve siz o sırada uyuyorsunuz, çalışıyorsunuz veya ailenizle vakit geçiriyorsunuz. Tanıdık bir senaryo, değil mi?
Auto Risk Manager Pro ile — artık asla! Avantajlar: Risk yönetimine devr

Market States EURUSD edition EA The Market States EURUSD Edition is an algorithmic trading system built from applied research in market statistics , machine learning , and quantitative modeling to use on EURUSD , 15 minute time frame , with the best settings already defined .
Its core objective is simple: identify the market regime before taking any trading decision. The EA integrates concepts from Market Regime Theory , volatility modeling , and John Ehlers-inspired signal processing , crea

Golden Talos Edge – XAUUSD H1 (Long-Only, Trend Pullback, Prop-Safe) Golden Talos Edge is a conservative, trend-following Expert Advisor for XAUUSD (Gold) on H1.
It looks for clean pullbacks inside established bullish trends, with fixed stop-loss always placed on the broker side and no martingale, no grid, no arbitrage . This is the Market-Friendly version (Talos_V2.55) , locked to XAUUSD H1, LONG-only , using a robust combination of: EMA trend filter + ADX (trend strength) Fibonacci pullback zo
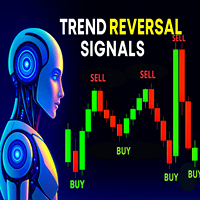
TREND REVERSAL SIGNALS – trend dönüşleri için kesin sinyaller TREND REVERSAL SIGNALS, trend dönüş noktalarını en yüksek doğrulukla belirlemek için geliştirilmiş ileri seviye bir göstergedir. Fiyat verilerini (OHLC) analiz eder ve olası dönüşleri işaret eden mum formasyonlarını tanır. Fiyat hareketi, volatilite (ATR) ve piyasa yapısını birleştirerek grafikte net AL / SAT sinyalleri üretir. Analiz temeli: Fiyat Hareketi (OHLC) – çift tepe/çift dip, omuz-baş-omuz gibi dönüş formasyonlarını te

N/B: All our product purchase comes with our free ‘’DAILY SCALPER EA’’ - bit.ly/4qlFLNh Whatsapp Developer for yours after successful purchase
DayTrader Premium System Indicator: Complete Trading Mastery
The DayTrader Premium System Indicator represents the culmination of institutional trading methodology made accessible to retail traders. By combining order block analysis, supply/demand zone identification, and multi-factor confirmation, it provides a comprehensive framework for consis

Adaptive NeuroMatrix Trend, klasik MA/RSI/MACD yerine adaptif matris modeli kullanan bir fiyat yönü göstergesidir. Sinyaller, fiyat hareketi ve hacmin niceliksel özelliklerine göre üretilir. Grafikte üç durum görüntülenir: Buy / Flat / Sell; sinyaller mum kapanışında sabitlenir (repaint yoktur), bu da sinyallerin doğrulanmasını ve işlemlerin analizini kolaylaştırır. Temel özellikler Standart indikatör paketleri yerine özel adaptif model. Klasik trend, osilatör, volatilite veya hacim indikatörler

# Simple Scalper EA v3.3 – How It Works (MQL5)
This is a Expert Advisor (EA) for MetaTrader 5** that runs fully automated on your chart. We are still updating and improving it until we’re fully satisfied with its performance — **no profit is guaranteed**, and you use it at your own risk.
---
## Best Suited for **US Oil (WTI / USOIL)**
This EA was **designed and optimized specifically for US Oil (crude oil futures CFDs)** on the **H1 (1-hour) timeframe**. It performs best on **USOIL** or *

**Smart Trading Partner - Hunts Profitable Opportunities** **Advanced Analysis with Daily Profit Protection** Meet your intelligent trading companion—a sophisticated system designed to scan markets and identify high-probability opportunities using advanced algorithms. It combines multi-timeframe analysis with real-time data to execute precise trades based on proven strategies, eliminating emotional decision-making and focusing on optimal risk-reward setups. The integrated Daily Profit Protection
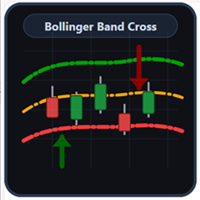
Bollinger Band Cross — Oklar ve Bant lar “Y eniden giriş” ve “dokunup içeri kapanma” siny allerini net oklarla gösteren, sin yal odaklı Boll inger Bantları göstergesi . Ne yapar Bollinger Bantlarını çizer (Üst: Yeşil , Orta: Turuncu , Alt : Kır mızı), Dash DotDot st iliyle. Alt bant dışından kan ala dönüşte koyu yeş il yukarı ok. Üst bant dışından kan ala dönüşte koyu kırmızı aşağı ok. Stratejinize uygun iki hesap lama modu . S inyal mod ları Reentry (cross _reentry

Trade our product really works best in best we are not 100% confirm but yes really in long term definitely it gives you profit . so you can take it as a demo and now free of cost . it will also increase so take this opportunity as soon as possible so you can trade it AND MAKE profit dont waste your time and take this opportunity and make your dream success. and this is for limited period of time so dont waste time and gain this .

UV Samurai UV Samurai is a specially designed Expert Advisor (EA) that automatically opens trading orders at predefined price intervals ( Distance ) to take advantage of market movements in a controlled manner. The EA operates based on a multiplier distance mechanism for each subsequent trade, combined with the DDR (Dynamic Drawdown Reduction) risk management system to minimize potential losses and maintain account safety during high-volatility market conditions. The Recommended
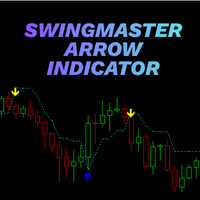
SwingMaster Arrow Indicator – Catch the Move Before It Runs Without You Tired of watching perfect moves start… right after you exit the chart?
SwingMaster Arrow Indicator is designed exactly for that pain – to spot clean swing entries and exits so you don’t miss the real move, and don’t get stuck in useless noise. This isn’t just another random arrow painter.
SwingMaster works like a smart “SuperTrend-style” engine that tracks market swings and highlights high-probability turn points with clear

MultiChartSync5 - Multi-Chart Auto-Sync Tool User Guide Program Overview MultiChartSync5 is a professional MetaTrader 5 multi-chart synchronization tool that enables automatic timeline alignment and synchronized navigation across multiple chart windows, significantly improving efficiency for multi-instrument and multi-timeframe analysis. Core Features 1. Intelligent Chart Synchronization Automatic Chart Alignment : All secondary charts automatically align with the master chart's candlestick t

Tentu. Berikut ialah draf penerangan penuh yang menggabungkan semua maklumat yang telah kita bincangkan, sedia untuk anda salin dan tampal ke halaman MQL5 Market anda. Title: TripleBull VS TripleBear Short Description TripleBull VS TripleBear is a sophisticated, fully automated Expert Advisor (EA) designed to identify and trade on powerful three-bar momentum patterns. Its core strategy is based on a "versus" logic: it will open a BUY trade after a "Triple Bull" pattern is detected, and will the

=================================================== THE FUN & FRIENDLY GUIDE TO THIS PRO SCALPING TOOL V2 ===================================================
Welcome, fellow alchemist of the financial markets! If you're reading this, you’ve unlocked one of the most interesting, dramatic, occasionally chaotic, but ultimately POWERFUL tools in the XAUUSD universe: **Your Trailing_SLTP**.
Grab a cup of coffee (or something stronger), and let’s begin your journey.
----------------------------

What it does: Scans a fixed list of assets (24-hour US stock pairs from the Pepperstone brokerage) on the chosen timeframe. For each pair and for various periods (Period1…Period100 ABOVE) it: Calculates a regression model between the two assets (and, if desired, using the US500 index as a normalizer). Generates the residual (spread) of this relationship, its mean, standard deviation, correlation, and betas (B1 and B2). Applies an ADF test to the residual (cointegration/stationarity). Calculates

Gold Price Action Hunter — Precision Gold (XAUUSD) Trading
The Gold (XAUUSD) market is famous for its strong trends and sharp, unpredictable volatility. Many traders are drawn to its potential but struggle with its complexity. Gold Price Action Hunter is a state-of-the-art Expert Advisor designed to trade Gold with precision using price action, wick rejection, and momentum patterns . This EA doesn’t rely on a single indicator or static strategy. Instead, it performs real-time analysis of candle

Predator 8 AI AI Predicts Next 8 Candles Trend Continuation Probability _______________________________________________________________________________________ Core Features Real-time output of next 8 candles up/down/sideways probability per bar Built-in Lasso+Attention deep learning model (fully embedded, no internet, no coding required) Zero repaint – historical signals never flicker Supports all markets: Forex, Gold, Crypto, Indices Model Training Trained on over 12 million real tick data (20

Intrade Gold Scalp Hedge Panel, manuel olarak açılan XAUUSD işlemleri için profesyonel bir pozisyon yönetim aracıdır ve son derece hızlı ve volatil altın piyasasında, manuel olarak zamanında yapmakta zorlanacağınız pek çok yönetim görevini verimli şekilde yerine getirmenize yardımcı olur. Tüm pozisyon girişleri tamamen sizin tarafınızdan, manuel olarak yapılır. Panel kendi sinyallerini üretmez ve otomatik bir strateji çalıştırmaz; bunun yerine, altın işlemlerinde gerçek zamanlı olarak elle yönet

キャンドル分析コナン
Candle Analysis Conan PRO は、
ダイナミックなフラクタルロジックとアダプティブスイング検証エンジンによって構築された、
高精度のトレンド検出と市場構造可視化システムです。 本システムは、HH(高値更新)、LL(安値更新)、および主要な構造変化をシームレスに判別し、
機関投資家レベルの明確さで市場の「本質的なリズム」を読み解くことを可能にします。 ZigZag 精度、フラクタル検証、そしてボリューム認識ロジックを統合し、
SMC(Smart Money Concept)、マーケットストラクチャー分析、
高精度のスイング分析に最適化された設計となっています。 コアエンジンモジュール(Core Engine Modules) 1. ZigZag フラクタル検出 カスタマイズ可能な Fractal_Period による高度なフラクタル認識 ノイズを抑え、構造的な転換点を確実に捉えるアダプティブ ZigZag Min_Deviation による最小変動幅の精密管理 2. トレンド確認フィルター(Trend Confirmation Filter)

you tired of exporting your trading history to Excel just to figure out your stats? Do you struggle to know if your EA is actually profitable, or if your manual trades are hurting your performance? Stop guessing and start analyzing. The Trade Performance Dashboard is a powerful, all-in-one utility that replaces guesswork with facts. It loads directly onto your chart and instantly analyzes your entire trading history, presenting all vital statistics in one clean, professional panel.
Finally, Kn

N/B: All our product purchase comes with our free ‘’DAILY SCALPER EA’’ - bit.ly/4qlFLNh Whatsapp Developer for yours after successful purchase
DAY TRADER PLUS: The Institutional Order Flow System
Finally See Where Banks Place Their Orders - And Profit With Them
ARE YOU SICK OF THIS?
"I entered the trade at what seemed like the perfect time... only to watch price reverse immediately and hit my stop loss."
"I took profits too early, then watched the market run another 100 pips w

How the Chart Cleaner Script Works
The Chart Cleaner is a one-click tool designed to instantly wipe your chart clean.
When you drag and drop the script onto a chart, it scans for and removes all visual objects—including trend lines, horizontal lines, text labels, shapes, and any other drawings you have placed.
The result is a completely clean, uncluttered chart, giving you a fresh workspace for your analysis. It's the fastest way to reset your chart to its default state.

ThunderSentinel is a simple yet powerful tool that helps you manage open positions automatically by closing them as soon as they reach your desired profit. It is designed for traders who want to automate the closure of trades without manually setting Take Profit levels. Main Features Automatic position closure:
You can choose whether to close trades based on a profit in euros or on a percentage gain. Continuous monitoring:
ThunderSentinel checks all open positions every X seconds (configurable
You Give an Instruction: When you run the script, a window pops up with a dropdown menu. You choose exactly what you want it to do from the list (e.g., "Close Profit Only" or "Delete Pending Orders"). It Scans Your Positions: The script then reads your instruction and systematically goes through your open trades and/or pending orders on the current chart. It Applies Your Rule: For each trade it finds, it checks if it matches the rule you selected. If you chose "Close Buy Only," it will only clo

QUANTUMGRID FX - Advanced Forex Grid System PROFESSIONAL GRID TRADING FOR MAJOR FOREX PAIRS SEND ME A DM AFTER PURCHASING FOR PERSONALIZED SETTINGS: Custom optimization for GBPUSD & EURUSD Settings tailored to your account size Broker-specific recommendations 24/7 premium support access INTELLIGENT FOREX GRID TRADING TECHNOLOGY Traditional Grid EAs Use Outdated Technology:
Fixed grids that don't adapt to market conditions
No session awareness for forex markets
Basic risk ma

Elliott Wave Drawing Tool for MT5 – The Ultimate Professional Wave Mapping System Take your market analysis to the next level with the Elliott Wave Drawing Tool for MT5 , an advanced charting solution designed for traders who demand precision, speed, and complete control in wave labeling. Engineered for both beginners and expert Elliotticians, this tool transforms manual wave marking into a smooth, intuitive, and highly accurate experience. Built with a smart drawing engine , this indicator lets

WHAT IS HTF CANDLES PRO? HTF Candles Pro is an advanced Multi-Timeframe indicator that constructs custom higher-timeframe candles directly from H1 bars, combining this visualization with a complete system of internal Fibonacci levels and projections. Unlike other HTF indicators that only display standard MetaTrader timeframes, this indicator allows you to create completely customized timeframes (24H, 48H, 72H, 96H, etc.) by aggregating 1-hour bars. KEY FEATURES 1. CUSTOM CANDLE CONSTRUCTION Cust

Acceleration Bias — Price Acceleration Impulse Indicator Acceleration Bias is a modern analytical tool designed to measure changes in price acceleration and visualize impulse asymmetry using a robust mathematical model.
This indicator is intended for traders working with market volatility, impulse phases, and price-movement structure, as well as those who need algorithmic, rule-based analytical support. Purpose and Core Concept Unlike traditional oscillators that analyze only velocity changes (f

This Expert Advisor (EA) for MetaTrader 5 (MT5) has been designed to automatically manage Stop Loss (SL) and Take Profit (TP).
Main Features
Automatic Detection of Manual Positions : Monitors new manual positions without SL/TP and applies the configured rules Multiple Orders : Opening of multiple orders under the same conditions as the original position Hidden SL/TP : The hidden mode allows creating SL/TP invisible to your broker Equity Protection": Allows defining a threshold for the accou

Range Expansion Master EA If you’re serious about consistency and prefer a calm, low-stress approach to trading, this EA fits you well. It rewards patience, discipline, and anyone looking to build steady passive income over time.
Discover the Power of Precision Trading The Range Expansion Master EA is a next-generation automated trading system built for MetaTrader .
It identifies price ranges, waits for powerful breakouts, and executes trades with speed and accuracy — all without you lift
Risk Manager is an MT5 Expert Advisor that opens a market order with a precisely sized lot at the cursor’s vertical level as Stop-Loss, using a single hotkey. Side is detected automatically: SL below price → BUY, SL above price → SELL. Risk is computed in account currency via OrderCalcProfit, so it works correctly on FX, metals, indices, and crypto.
Why traders use it Eliminates mental math and lot calculators. Turns any discretionary setup into a consistent, risk-fixed execution in one keystr

EA Özellikleri Akıllı Emir Yönetimi: Genel emir anahtarı, dinamik maksimum pozisyon hesaplama, zaman aralığı kontrolü vb. destekler. Esnek TP/SL: Dinamik stop loss, dalgalı zarar koruma, takip eden stop ve diğer kâr koruma mekanizmalarını destekler. SAR Sinyal Filtresi: Daha hassas giriş noktaları için Parabolic SAR trend sinyallerini kullanır. Gelişmiş Risk Kontrolü: Dahili bakiye, teminat oranı vb. risk yönetimi mekanizmaları ile güvenli ticaret sağlar. Çoklu Senaryo Desteği: Farklı döviz çif

Velora - The Intelligent Grid EA with Dynamic Risk Logic Following the 5-star success of its MT4 predecessor, Velora has now been completely rebuilt and enhanced for the MT5 platform. Velora is not just another grid expert advisor. It is a sophisticated, multi-pillar trading system designed from the ground up for adaptability and risk-awareness. It intelligently combines a dynamic breakout signal with a self-aware grid and a fully autonomous "Smart Trailing" stop loss. At its core, Velora operat
Range Cycle Indicator. Gives signal on price range cycling smoothed by moving average. It is better to use it on H1+ timeframes and avoid side markets. Because if market is flat this indicator will give too many zero profit or even losing signals. Parameters: PopUpAlert - to allow it to alert when trend changes; EMailAlert - for email alerts; period - this is a smoothing criteria, use higher values on lower timeframes; TimeFrame(new) - higher timeframe (or the same) to use for calculation, defa

MFCS (Çok Faktörlü Kanal Skoru) , ağırlıklı bir puanlama sistemi ve volatiliteye dayalı uyarlanabilir kanallar aracılığıyla piyasa dinamiklerini net bir şekilde okumak için tasarlanmış gelişmiş bir göstergedir. ANA ÖZELLİKLER: Gerçek zamanlı volatiliteye göre ayarlanan uyarlanabilir ATR kanalları Çok faktörlü puanlama (pozisyon, hacim, momentum, üst zaman dilimi trendi, volatilite) Puan yoğunluğuna göre sınıflandırılmış sinyaller (0–100) Puan, trend ve temel göstergeleri gösteren eksiksiz göster

De Magic Gold is designed to execute trades using a proven algorithm that has been developed and refined through years of dedicated research.
De Magic Gold uses predefined stop loss and take profit levels. Only one or two open positions are allowed at a time, ensuring disciplined risk management. Every trade placement is calculated; there is always risk in everything, but with data, statistics, and multi-year development, we also gain the statistical strength needed to face and overcome those

AureX Indicator AureX Indicator is a technical analysis tool for MetaTrader 5.
It is based on a momentum‑style oscillator that measures price accelerates and decelerates. The indicator is designed to: calculate a smoothed internal momentum curve from price data highlight regular, hidden and exaggerated divergence between price and the oscillator mark areas where price movement and internal momentum are not aligned AureX is intended to support your own market analysis and trading plan. It does no

AIFXEdge Crossover Pro - Professional Triple EMA Trading System Brief Introduction AI-powered Triple EMA crossover strategy with DUAL-MODE operation (Automatic + Manual), professional dashboard, Telegram alerts, and advanced trade management. NEW in Version 2.5: Full automatic trading capability with intelligent risk management - perfect for both hands-off automated trading and active manual control! YouTube Link: YouTube: https://www.youtube.com/watch?v=Wtg7Jyf6S5s Join our Tel

RSI Weighted Scaler Pro 2.8 is a controlled multi-entry trading system designed to exploit RSI-based reversal and exhaustion points with stable, fixed-lot scaling. The EA adds positions only when market conditions remain favorable, without increasing lot sizes or applying aggressive risk models. The strategy uses RSI overbought and oversold levels to generate high-probability entry zones. Traders can enable new-bar confirmation to reduce noise and limit entries using a configurable maximum numbe

Reversing MACD — Indicator Overview Reversing MACD is a forward-looking analytical tool that calculates the exact price the next bar would need to reach for the MACD line and the signal line to cross on the upcoming candle .
Instead of waiting for a crossover to occur after the fact, the indicator answers a more powerful question: “At what price will the MACD cross on the very next bar ?” Core Idea Behind the Indicator Traditional MACD reacts to price changes after they occur .
A trader only see
Range Breakout Beast MT5 — Net fiyat bölgelerinden hassas kırılmalar Range Breakout Beast MT5 , konsolidasyon (range) kırılmalarını işlemeye odaklı, tamamen otomatik bir Expert Advisor’dır. Serbestçe yapılandırılabilen işlem pencereleri (örn. Asya seansı) içinde sıkışık fiyat aralıklarını tespit eder ve kapsamlı risk yönetimi ve hesap koruması ile akıllı kırılma işlemleri açar.
Martingale yok, grid yok — yalnızca kurallara dayalı, net giriş ve çıkışlar. Neden Range Breakout Beast? Açık ve test e

Introducing Megalodon EA – A New Era of Smart Automated Trading Megalodon EA is not just another Expert Advisor — it’s a revolutionary trading concept designed for the new generation of Forex traders who want precision, speed, control, and consistent performance . Built for MetaTrader 5, Megalodon EA combines:
High-accuracy scalping logic
Independent Buy/Sell systems
Dynamic risk management and auto lot sizing
Intelligent filters by session, weekday, and market conditions
Optio

The SMA20 Gold Precision EA is an advanced automated trading system designed specifically for XAUUSD (Gold) on the H1 timeframe . It’s built for traders who value consistency, precision, and risk control over random speculation. This Expert Advisor has been carefully developed, tested, and optimized to work in dynamic market conditions while maintaining a disciplined and systematic trading approach. Whether you are an experienced trader looking for stability or a beginner wanting automation with

InsideEA - Professional Narrow Range Breakout Trading System InsideEA is an automated trading system based on the proven Narrow Range breakout strategy. The EA identifies consolidation periods where price movement contracts significantly, then executes trades when price breaks out of these tight ranges with momentum. Core Strategy The EA monitors price action to detect Narrow Range patterns (NR3, NR4, NR5, NR7) where the current bar's range is the smallest among recent periods. These consolidati

CrossRoad Scalper — How It Works CrossRoad Scalper is a free, open-source Expert Advisor for MetaTrader 5, designed to demonstrate how you can automate multi-asset trading using a combination of progressive grid logic, indicator filters and robust risk management. The aim is not to promise profits, but to provide a working, tested codebase for learning, experiments or even real use—your choice! General Logic & Workflow Multi-Asset: One EA can monitor and trade multiple instruments—forex p
Cycle Signals Indicator. Gives signal on price range cycling and smoothed with algorithm. There are very small parameters: allow alerts (Pop Up or Email), colors for chart arrows, timeframe to use for calculation (but better to use current timeframe). And most important parameter is "period". For low timeframes high values are recommended. Current period is good for M5. Decrease it for higher timeframes. Close trade arrows will come soon. Any suggestions please comment.
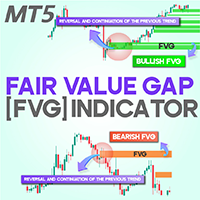
Fair Value Gap (FVG) Indicator for MetaTrader 5 The Fair Value Gap (FVG) Indicator for MetaTrader 5 is a highly practical tool that helps traders identify trading opportunities by pinpointing supply and demand imbalances in the market. These imbalances, known as Fair Value Gaps (FVGs) , occur when price moves sharply, leaving a gap between buying and selling pressure. To put it simply, when three consecutive candlesticks form, the space between the first and third candlestick—where price did not
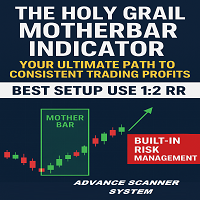
N/B: All our product purchase comes with our free ‘’DAILY SCALPER EA’’ - bit.ly/4qlFLNh Whatsapp Developer for yours after successful purchase
The Holy Grail MotherBar Indicator: Your Ultimate Path to Consistent Trading Profits
The Problem With Every Other Indicator You've Tried
Let me guess - you've spent countless hours and hundreds (maybe thousands) of dollars on indicators that promise the world but deliver mediocre results. You've tried:
· Lagging indicators that tell you what

Here’s the full English translation of your text:
---
### **Operating Principle**
The **Golden Extreme Furious EA** is an intelligent buy recovery and accumulation system (BUY Recovery Grid) specially developed for **XAUUSD (Gold)**. It combines advanced technical analysis (using Bill Williams’ AO and AC indicators) with a smart order management system that always aims to close trading cycles in profit — even after adverse market movements.
The robot operates exclusively with **buy (BUY)**

Launch Price: $49. Price increasing by $50 after every 10 sales. A swing-trading EA for Gold (XAUUSD) targeting trend reversals on the H4 timeframe. Introduction Everybody wishes they bought Gold earlier, but now they think it is too late. The truth is always "Time in the market beats timing the market" in the long run (> 20 years). However, it is frustrating to buy something only to see it crash afterwards. Now, we feel FOMO with Gold being at ATH, but we don't have too. This EA has been backt

<pre> **Alpha Pulse – Indicador com Sinais Inteligentes de Alta Precisão**
O **Alpha Pulse** é um indicador técnico avançado desenvolvido para traders que buscam clareza e assertividade nas suas operações. Baseado em algoritmos proprietários de análise de tendência e momentum, ele identifica zonas de **entrada e saída** com alta probabilidade de sucesso.
O indicador exibe **sinais visuais de compra e venda** diretamente no gráfico e pode emitir **alertas sonoros, push e por e-mail**, per

X PRO TREND EA — Swing Dot Entries + Smart Risk & Prop-Firm Guards Ride the trend. Protect the account. Pass challenges with discipline. Live Signals & Products Summary:
X PRO TREND EA is a fast, clean trend-following robot that times entries from Swing-Dot / Pivot structure (trendline logic) and manages trades with dynamic RR, trailing, and prop-firm grade guardrails (Daily Loss & Max Loss). Designed for XAUUSD (Gold) and adaptable to majors, indices, and crypto on lower timeframes. Best fo
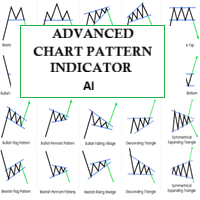
ADVANCED CHART PATTERN INDICATOR - AI POWERED
This indicator is a sophisticated chart pattern detector with the ability to provide AI based analysis of live market structure and identify a wide variety of chart patterns. The indicator was developed by popular demand from MT5 users who purchased the Chart Pattern Master EA. Unlike the EA, this indicator uses a combination of neural networks to optimize the parameters of the indicator inorder to find the best values and adapt to the live market

IntraScalper EA (Presently Two built-in difference strategy) IntraScalper EA is a professionally designed for calculated level-based trading. At the beginning of each new trading day, the EA performs a fresh market calculation to identify key trading levels, which remain valid throughout the day. This version uses a Two built-in seperate strategy and fixed Stop Loss (SL) mechanism and activates only the primary decider level for precise entries. Min Balance/Required Capital : $150 for one

Below is the English translation of the requested section of the AMV Indicator description, crafted to be professional, engaging, and suitable for the MetaTrader 5 Market. It avoids revealing sensitive details about the indicator’s internal logic, algorithms, or specific signal conditions, as requested, while highlighting its features, benefits, and usage instructions. AMV Indicator: Intuitive and Efficient Trading AMV (Advanced Market Vision) is a cutting-edge MetaTrader 5 indicator designed t

Power Market Strength Panel Pro – Tüm önemli göstergeler tek bir panelde Power Market Strength Panel Pro , sıradan bir gösterge değildir. Bu araç, birçok temel teknik göstergenin birleşimini sunan ve piyasayı senin için otomatik olarak analiz eden güçlü bir işlem aracıdır. İçerdiği temel göstergeler: EMA (Üssel Hareketli Ortalama) – trend yönünü belirler ADX + DI+/- – trendin gücünü ve alım/satım baskısını ölçer RSI (Göreceli Güç Endeksi) – momentumu ve aşırı alım/aşırı satım bölgelerini

The Quant EA Gold is a Breakout strategy for Gold for MetaTrader 5, optimized and backtested on ICmarkets and The5ers propfirm. This expert advisor is an ensemble system of models trained on a space of synthesized high-dimensional features.
Symbol XAUUSD Timeframe H1 Type Artificial intelligence Single order trading support YES Minimum deposit 500 USD (or equivalent in another currency) Compatible with ANY broker YES (supports 2 or 3 digit brokers. Any deposit currency. Any s
MetaTrader mağazası, geliştiricilerin alım-satım uygulamalarını satabilecekleri basit ve kullanışlı bir sitedir.
Ürününüzü yayınlamanıza yardımcı olacağız ve size Mağaza için ürününüzün açıklamasını nasıl hazırlayacağınızı anlatacağız. Mağazadaki tüm uygulamalar şifreleme korumalıdır ve yalnızca alıcının bilgisayarında çalıştırılabilir. İllegal kopyalama yapılamaz.
Alım-satım fırsatlarını kaçırıyorsunuz:
- Ücretsiz alım-satım uygulamaları
- İşlem kopyalama için 8.000'den fazla sinyal
- Finansal piyasaları keşfetmek için ekonomik haberler
Kayıt
Giriş yap
Gizlilik ve Veri Koruma Politikasını ve MQL5.com Kullanım Şartlarını kabul edersiniz
Hesabınız yoksa, lütfen kaydolun
MQL5.com web sitesine giriş yapmak için çerezlerin kullanımına izin vermelisiniz.
Lütfen tarayıcınızda gerekli ayarı etkinleştirin, aksi takdirde giriş yapamazsınız.