 MetaTrader 5
 专家
 指标
 程序库
 实用工具
 窗口小部件
 规则
适用于MetaTrader 5的EA交易和指标 - 157
 使用EA交易和指标,使外汇交易获得更多盈利。EA交易可使您自动开启和关闭交易,而指标将帮助您更准确地预测市场行为。
该页面提供MetaTrader 5应用程序的目录。

DeMarker Advanced Indicator for MetaTrader 5 The DeMarker (DeM) indicator, created by legendary trader Tom DeMark, is a powerful oscillator designed to measure the demand for an asset by comparing recent price highs and lows. It excels at identifying potential trend exhaustion and imminent market turning points. The DeMarker Advanced Indicator for MetaTrader 5 takes this classic tool and supercharges it. While the standard DeM indicator is often difficult to read due to erratic movements, thi
FREE

[FREE EA] EA23 TANIN HEIKEN CCI: THE PULLBACK ASSASSIN & PROP FIRM SHIELD Are you tired of entering trends too late and getting caught in drawdowns? Meet EA23 Tanin Heiken CCI , a commercial-grade automated trading system designed to catch the perfect pullback entries in a strong trend. THE BIG UPDATE: NO MORE .SET FILES! For the first time, you don't need to download or load messy .set files. EA23 comes with Built-in Presets . Just select your mode from the dropdown menu (Prop Firm Safe M
FREE

TideMarks Basic — Session Highs & Lows (NY, London, Tokyo) This is the free version of TideMarks. It displays today's session highs and lows for Tokyo, London and New York with no configuration required — just add it to your chart and it works. The full version adds: On-chart toggle buttons per session Open-Close range lines Session candle coloring with directional tick marks Two fully customisable extra sessions Extend lines as live support and resistance Full alert suite (8 alert types) Config
FREE
MACD-V — Volatility-Normalized Momentum Indicator Inspired by award-winning quantitative trader Alex Spiroglou ,
the MACD-V is a powerful evolution of the classic MACD — delivering a volatility-normalized momentum framework that produces consistent, actionable signals across all securities and timeframes. While the traditional MACD measures the difference between two EMAs, the MACD-V goes a step further by dividing this difference by the market’s volatility (ATR).
This normalization makes the
FREE

The indicator draws horizontal lines based on the RSI indicator's overbought and oversold levels. The closing prices of the bar are selected when it exits the overbought zone or when the RSI indicator first crosses the 50% line. For more information, you can enable the display of RSI values for the most recently closed bars in the upper left corner. It also displays information about whether the RSI indicators are in the overbought or oversold zone. All timeframes are available. Can be enable
FREE

This indicator solves the problem of chart scaling where the bar becomes too thin and it becomes difficult to determine the bar's open and close prices.
Thick Bar indicator - allows you to change the thickness of the lines and the color of the stroke, due to which you can get a thicker bar on the chart. The default indicator has a bar thickness of 2 and preset colors that can be changed in the settings
FREE
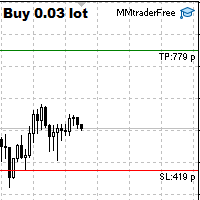
This tool is designed to quickly calculate the lot depending on the Stop Loss.
The control is done by hot keys
By default:
1 - Limit order price level
2 - Stop Loss Level
3 - Take Profit Level
Space Bar - Open an order
Escape - Cancel All 9 - Open 2 orders
Market Order
To open a Market order, click (2) and set up Stop Loss with the mouse If you want to put Take Profit - click (3) and set up Take Profit with the mouse
FREE
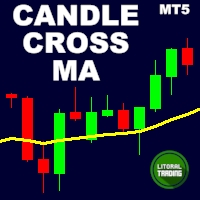
Candle cross MA is an indicator that works "silently", that is, drawing only a moving average on the chart.
It alerts you when the last candle cross with a moving average that you set. Alert is given only when the candle closes.
The moving average settings are fully customizable.
The indicator sends popup, and push notifications. You can also deactivate alerts when the chart is inactive. Are you the trend type? Do not miss another opportunity!
FREE

WHY ECONOMIC CALENDAR PRO?
Trading without knowing when high-impact news is scheduled is like driving blindfolded. Sudden price spikes, spread widening, and stop-loss hunts are almost always tied to economic releases. Economic Calendar Pro puts the entire week's news schedule right on your chart — always visible, always up to date — so you are never caught off guard again.
Unlike web-based calendars that require switching windows or relying on a browser, this indicator is embedded directly in
FREE

Gives signal on daily cycle. Use H1 timeframe or lower. When day starts it looks for extremum. Better to close trade until the next day. There is only one parameter for now: maximum bars. If you have any ideas about this indicator please leave your feedback. As soon as it will grow it will be commercial. Maybe. Also parameters will be added later when I backtest it enough to ensure it is safe.
FREE

Trade Sentiment or trade assistant is a MT5 Indicatior. That show buy or sell signal of different indicator to assist to take trades. That will help you to take right trades or to get confirmation for your trade. You don't need to have this indicators. Including indicators like RSI , STOCH , CCI. And the signals are Based on different Timeframes like 5M , 15H , 1H and 4H.
FREE

Добрый день. Сегодня добавили вспомогательный индикатор тренда DveMashkiTompson, идея взята из аналога МТ4 и перенесена на МТ5, используется совместно с индикаторами Тренда ТМА и МА, рисует красные и зеленые области в зависимости от направления рынка. Тренд вверх -зеленые области, тренд вниз -красные.Области основываются на пересечении индикатора МА, таким образом данный индикатор дает информацию графического содержания для более быстрой оценки ситуации и принятия решения.
FREE
Мультивалютный индикатор в отдельном окне отображает движение валютных пар в пунктах с расхождением от начала дня. Во время работы, динамически возможно включать и отключать различные пары прямо на графике. При первом запуске, возможно, потребуется продолжительное время, пока загрузиться история для основных валютных пар. Расчет всех кроссов происходит на основе мажоров. Для валют CAD, CHF, JPY - график перевернут. При повторном открытии, все настройки индикатора восстанавливаются автоматически.
FREE
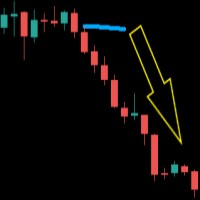
O indicador imprime a linha da média longa quando as médias media e curta estão confinadas dentro dos limites de 1 ATR (average tru range) da média longa. Após períodos de congestão os preços se movimentam fortemente em uma direção. Este indicador não fornece pontos de entrada, apenas mostra que as médias estão bastante próximas. Parâmetros: Periodmalongo: Período da média longa. Periodmamedio: Período da segunda média. Periodmamedio2:Período da terceira média. Periodmacurto: Período da média cu
FREE
This is a Price Projection for Current Candle from Time Frame M15 To Weekly, It's shows Market Trends Teji (Bullish) Or Mandi (Berries). It's Show Teji High & Low for Bullish Market and Mandi High & Low for Berries Market. We can Plan Our Trade in Well Advance for our Current Open Trade. It's Generate New Data for Every New Candle. You are requested to Please Test it with demo Ac before Use in Real Trade. Please Save it to your Mql\Indicator folder and attache to your chart. if any quay Please
FREE

Engulfing Failed Zone by RWBTradeLab
A clean, non-repainting FAILED engulfing detector for MetaTrader 5. Most traders only look for engulfing patterns — professionals also watch what happens when an engulfing FAILS, because a broken pattern traps traders on the wrong side and often fuels the opposite move. This indicator finds those failures automatically, sorts them into 8 types, and marks the exact level that broke — all from CLOSED candles only.
What This Indicator Does
Step 1 — Engulfing
FREE
如果产品有任何问题或者您需要在此产品上添加功能,请联系我 Contact/message me if you encounter any issue using the product or need extra feature to add on the base version.
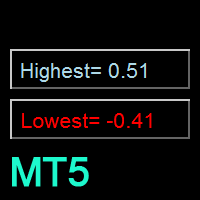
Floating Highest Lowest MT5 provides you an intuitive and user-friendly method to monitor the floating highest (profit) and lowest (loss) that all your trades together ever arrive. For example, I opened 3 orders, which arrived at $4.71 floating profit when trade following trend. Later when the trend is against me, these 3 orders arrive $30 in loss, and a
FREE

Trade Copier Master and Follower in 1 is a local expert advisor for copying trades between master and follower accounts on different terminals on the same device. It supports master/follower modes, configurable symbol mapping for different brokers, multiple money management options, risk-based sizing, stop loss/take profit copying, partial close copying, and deviation handling. The follower can close positions independently, invert trades, and adjust symbols with prefixes, suffixes, or explicit
FREE

Try BlendLink: See the win rate live on your chart. BlendLink Essential is the free introduction to BlendLink for MetaTrader 5. Tick the lines you trust, blend them into one clean line, and the panel tests your mix on your own chart with real spread included. Features included: 5 lines of the Average group: EMA 50, SMA 200, EMA 20, Hull MA, and Ace Trend. Blend into 1 clean composite trend line. Balanced style with Buy/Sell signals, Entry, Take Profit, and Stop Loss tags (No repaint). Live wi
FREE

Trading is not easy, but you can make it easier with the pips-focused AP Pips. Money is the root of many emotional behaviors that plague traders, AP Pips take that away by offering you real-time analysis of your performance in pips so you can forget the $ behind it. Included in this free version : Live Pips Counter for your open trades Real-time data on your performance (Net Pips & Win Rate) for the current session, day & week. Adjusted every time a position is closed.
FREE

核心定位 专为 MT5 平台打造的轻量化风险测算工具,聚焦交易员日常风控测算核心需求,深度优化操作体验与数据展示效果,适配日内交易、波段交易等各类看盘交易场景,是交易员日常风控操作的高实用性辅助工具。 核心功能 手数便捷编辑:点击输入框可直接录入数值,无需提前选中,一步到位告别传统繁琐的编辑流程,提升操作效率。 实时动态测算:支持自由拖拽入场 / 止损线,系统即时精准计算价差、对应风险金额,测算结果实时同步更新,精准反馈每笔交易的实际风险敞口。 数据清晰展示:针对性修复换行乱码漏洞,将价差、风险金额等关键风控数据分行清晰呈现,让核心数据阅读更直观,避免信息混乱影响交易判断。 面板自定义布局:配备可拖拽面板,支持交易员根据自身看盘习惯、屏幕尺寸自由调整面板位置与布局,兼顾操作灵活性与使用舒适度。 核心价值 全方位提升风险测算效率,为交易决策提供精准、高效、实时的风险数据支撑,可无缝衔接各类交易策略的风控测算需求,助力交易员做好事前风险把控。
FREE

ApexTPGrid is a powerful Trade Management Utility designed to professionalize your grid and averaging strategies. Whether you trade manually or use other EAs, this utility takes control of your open "basket" of orders to manage them to a safe exit. The standout feature is the Swap-Aware Logic . We all know the pain of holding a grid for weeks, only to close at "breakeven" and realize negative swaps ate your capital. ApexTPGrid solves this by automatically calculating all accumulated costs (Swap
FREE

产品名称: QuickStep Trader – 可自定义界面手动交易面板
版本: 2.0
兼容性: MetaTrader 5
产品类型: 实用工具 描述:
QuickStep Trader 是一款专为手动交易者设计的高效交易面板。它通过直观的图形界面,帮助您快速执行开仓、平仓操作,并允许您根据个人偏好自由调整外观,打造专属的交易工作区。 核心功能: 一键开仓 :三个预设手数按钮(数值可自定义),点击即可快速设置手数,避免手动输入错误。 止损/止盈设置 :独立的止损、止盈点数输入框,下单时自动附加,精确控制风险。 比例平仓 :通过 1/4、1/3、1/2 比例按钮,快速平掉部分持仓;同时设有“平多”、“平空”、“全平”按钮,满足多种平仓需求。 面板移动 :通过输入坐标并点击“MOVE”按钮,可将面板整体移动到图表任意位置,方便您调整界面布局。 完全自定义外观 :所有背景色、边框色、按钮色、标签色以及字体大小均可通过输入参数调整,让您随心定制面板风格。 适用场景:
适合手动交易者、日内交易员以及对界面有个性化需求的用户。支持任何品种(外汇、贵金属、指数、商品等)
FREE

The standard Bollinger Bands indicator has been improved by integrating additional indications from the Standard Deviation indicator (StdDev), which gives an additional filter for confirming trading signals. In addition, the color of the indicator's lines shows the beginning of a trend, its development and exhaustion. This indicator has a signal block that notifies the trader of the beginning of the trend on any time frame to which it is attached.
Settings Type of messages - select the type of
FREE

FullMargin RiskGuard - Advanced Risk Management for New Traders Unlock the power of full margin trading with confidence using FullMargin RiskGuard , a cutting-edge Expert Advisor (EA) designed specifically for beginner traders on the MetaTrader 5 platform. Inspired by the renowned trading style of Papip Celebes, this EA empowers users to execute full trade strategies while safeguarding their capital with advanced risk management features. Key Features: MaxFloatingLoss Protection: Set your maxim
FREE
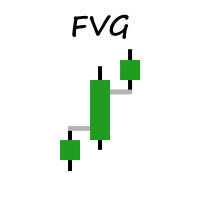
Welcome to MM Fair Value Gap Indicator.
Simple indicator that shows You FVG based on settings. The Fair Value Gap is a pattern made up of three candles: A Bullish Fair Value Gap forms on a second rising candle between the high of the first candle and the low of the third candle. A Bearish Fair Value Gap forms on a second declining candle between the low of the first candle and the high of the third candle
Indicator will be updated in future.
FREE
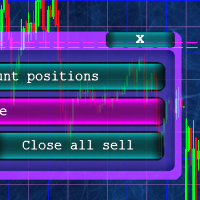
Кнопочная панель для одновременного закрывания большого числа позиций. Всего четыре варианта закрывания: Закрыть все позиции на счёте ( Close all account positions ). Закрыть все позиции по символу графика, на котором находится панель ( Close all positions ). Закрыть все Buy позиции по символу графика, на котором находится панель ( Close all Buy positions ). Закрыть все Sell позиции по символу графика, на котором находится панель ( Close all Sell positions ).
FREE

Transform your way of analyzing the market with our innovative trend and support/resistance indicator!
By combining the robustness of pivot points, the sensitivity of price adjustment, and the reliability of moving averages, our indicator provides a comprehensive and intuitive view of price behavior. Whether to detect emerging trends, track significant price shifts, or map critical support and resistance zones, this tool is your reliable guide amidst market volatility (BMF WIN).
T ested for B
FREE

This Tradepanel is an Utility for Traders Who want ot use Basic MoneyManagement for Calculation of Lotsize I have created the basic edition only to give an Overview with Limited Functionality Full Features are available with Auto TradePanel Pro. (This is Only Because it can not be Tested in Strategy Tester ). Complete Description is available at "Auto TradePanel Pro". in This Version Basic Functionality ( Calculation of Lotsize ) open /close Positions is working in the same way as in Pro
FREE

当每一秒都至关重要时的极速操作 这款交易面板最初就是为 自定义用户图表 而设计的,包括 秒级时间周期图表 。
它能够 自动识别自定义图表背后的真实交易品种 ,并直接对该真实品种执行交易—— 无需手动绑定,也不需要任何额外操作 。 这款面板只解决一个核心问题:
缩短“做出决定”和“执行操作”之间的距离。 没有多余的窗口
没有确认弹窗
不需要频繁切换界面 极速入场 面板将最关键的交易操作直接集成在图表上: Buy / Sell —— 一键市价开仓 LIMIT —— 无弹窗设置限价订单 点击按钮,操作立即执行。
无需在菜单中查找选项,也不会分散你对图表的注意力。 直接在图表上设置 SL / TP 设置止损或止盈非常直观: 只需点击开仓线,拖动出现的辅助线到目标位置,即可完成 SL / TP 设置。 无需手动输入数值。
你看到的价格位置,就是你设置的价格。 高效的限价订单操作 设置挂单只需两步: 点击 LIMIT 按钮 将出现的价格线拖动到目标水平 订单以 视觉化方式 完成设置,就像你在图表中规划交易一样自然。 在行情快速波动、来不及精确填写参数窗口时,这一点尤为重要。 画面干净,不干扰分析
FREE

MT5 Visual Theme Indicator – Clean Chart and Full Customization Enhance the appearance of your charts in MetaTrader 5 with this fully customizable visual indicator, designed to provide a clean, modern, and easy-to-read trading environment. This indicator does not generate signals or open trades. Its sole function is to optimize chart visualization to help you analyze the market with greater clarity. If you find this useful, please leave a 5-star rating and follow me for future tools, indicators,
FREE
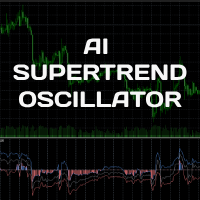
The AI SuperTrend Clustering Oscillator identifies three key outputs—bullish, neutral, and bearish—derived from variations between multiple SuperTrend indicators. FUNCTIONALITY The oscillator consists of three primary elements: Bullish Output : Represents the most optimistic signal, always the highest value. Bearish Output : Reflects the most pessimistic signal, always the lowest value. Consensus Output : Falls between the bullish and bearish outputs, serving as an overall trend indicator. A
FREE

Spread Engine Nika — MetaTrader 5 实时点差分析工具 Spread Engine Nika 是一款专业的 MetaTrader 5 点差分析指标。它利用历史 Tick 数据为任意交易品种构建统计点差档案,实时展示当前点差状况,并即时判断当前点差是正常、偏高还是危险——所有信息集中显示在图表上的紧凑面板中。 专为剥头皮交易者、日内交易者以及关注执行成本的交易者而设计,将原始点差数据转化为可操作的市场情报。 功能说明
点差档案引擎
— 分析最多 120 天的历史 Tick 数据,并将其划分为时间桶(可配置,默认 15 分钟)。每个桶存储平均值、中位数、75 百分位数、最大值、标准差和跨日标准差。
实时点差显示
— 实时显示当前点差,根据是否在该时间窗口的历史正常范围内以绿色/红色标注。
市场状态识别
— 根据 Z 分数相对于桶分布,将当前市场环境分类(如:低 / 正常 / 偏高 / 高)。
Z 分数与百分位数
— 精确显示当前点差在该时段统计分布中所处的位置。
当前 vs 下一时段对比
— 并排表格显示当前桶和下一个桶的 Avg、Medi
FREE
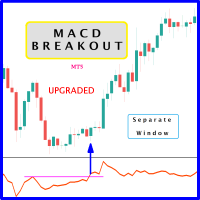
Probability emerges to record higher prices when MACD breaks out oscillator historical resistance level. It's strongly encouraged to confirm price breakout with oscillator breakout since they have comparable effects to price breaking support and resistance levels; surely, short trades will have the same perception. As advantage, many times oscillator breakout precedes price breakout as early alert to upcoming event as illustrated by 2nd & 3rd screenshot. Furthermore, divergence is confirmed in c
FREE
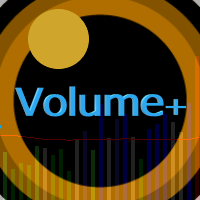
The Volume Plus indicator for MT5 can be effectively used for detecting imbalances in supply and demand.
The indicator improves on the typical volume histogram by coloring the bars.
Bar colors (colors are customizable):
Neutral - DimGray Wide Spread (Range) Bar on High Volume - MediumBlue Narrow Spread, High Volume - MidnightBlue Wide Spread, Low Volume - ForestGreen Narrow Spread, Low Volume - DarkGreen Very/Ultra Wide Spread, Low Volume - Aqua Narrow Spread, Ultra High Volume - Purple Very/
FREE

Volume Proxy
A synthetic order flow indicator for CFD traders on XAUUSD, NAS100, and US30.
What It Does CFD and synthetic markets on MetaTrader 5 do not provide real volume data. The standard tick volume that most traders rely on only counts price updates — it reveals nothing about the actual buying and selling pressure behind a move. This leaves retail traders unable to distinguish genuine institutional activity from ordinary market noise.
Volume Proxy addresses this directly. It synthesizes
FREE

Stop journaling your trades by hand. Let them journal themselves. Every serious trader knows the truth: the traders who review their trades outperform the ones who don't. And almost nobody actually does it — because manually logging every entry, exit, SL, TP, and P&L into a spreadsheet is tedious enough that it quietly dies after week two. War Room Journal kills that excuse. This is the official connector between your MetaTrader terminal and the War Room trading journal on Telegram (by @Ash_TheT
FREE

## FutureSight CCI — See Beyond, Trade Ahead
### What It Is FutureSight CCI is a next‑gen oscillator that upgrades the classic CCI. It combines trend detection, cross signals, Bollinger Bands, alerts, and logs into one powerful tool.
Paired with the **second‑chart generator**, it gives you total control of the ultra‑short‑term market. Perfect for scalping and binary options where speed and precision matter most.
---
### Highlights - **Extended CCI**: Three custom lines for deep
FREE

别再猜测你的交易表现了!立即在图表上追踪你的盈亏! 作为交易者,准确、实时地掌握自身的心理状态和执行力是保持交易纪律的关键。DaBhoza 胜率追踪器是一款轻量级、直观且高度可视化的图表工具,旨在帮助您一键手动记录和监控交易结果。 无论您是在测试新的手动交易策略、在模拟账户上练习,还是追踪每日实时目标,此仪表盘都能清晰地显示您的关键统计数据。 主要功能 一键记录:使用醒目的高对比度按钮,即可立即记录盈亏。 实时统计:自动计算并显示您的胜率百分比、总盈利、总亏损和总交易次数。 图表上的便捷性:在瞬息万变的市场交易中,无需打开外部电子表格或交易日志。 即时重置:使用专用的重置按钮,即可立即清除当前交易时段的统计数据,为新的交易日或交易时段做好准备。 简洁流畅的用户界面:采用现代深色主题仪表盘,搭配简洁的字体,可与任何 MT5 图表布局完美融合。 进度保存:关闭 MT5 终端后,您当前的交易数据不会消失——您的进度会自动保存,并在您下次运行终端时继续。 为什么您需要这款工具? 手动回测和前瞻测试可能非常繁琐。在混乱的交易过程中,我们常常会忘记自己的实际胜率。DaBhoza 胜率追踪器弥补了这
FREE

RKbots EMA Crossover is a clean, professional trend-following indicator designed for MT5, optimized for Deriv Synthetic Indices and all major forex pairs. It plots a Fast EMA and Slow EMA directly on the chart and generates clear Buy and Sell arrow signals at every crossover — no repainting, no lag beyond the EMA calculation itself. Key Features: Visual Buy () and Sell () arrow signals at EMA crossovers Fully customizable Fast and Slow EMA periods On-chart live dashboard showing trend directio
FREE

OVERVIEW
The Fibonacci Moving Averages are a toolkit which allows the user to configure different types of Moving Averages based on key Fibonacci numbers.
Moving Averages are used to visualise short-term and long-term support and resistance which can be used as a signal where price might continue or retrace. Moving Averages serve as a simple yet powerful tool that can help traders in their decision-making and help foster a sense of where the price might be moving next.
The aim of this scrip
FREE

Overview Advanced MT5 EA that automatically detects, scores, and visualizes support/resistance levels with integrated trading panel, risk management, and multi-channel alerts. Installation (3 Steps) Copy EA File : Place Saturno_Smart_SR_PRO_EA.ex5 in MQL5\Experts\ folder Refresh : Right-click "Expert Advisors" in Navigator → "Refresh" Attach : Drag EA to chart → Click "OK" → Enable AutoTrading button Note : Ensure "Allow Automated Trading" is checked and the EA shows a smiley face Qu
FREE

WatchListPro — Watch list and Linker for MetaTrader 5 Developer / website: Tradingvyuga.com
WatchListPro is a MetaTrader 5 Expert Advisor: a ticker watchlist with a chart linker. Build working instrument sheets, switch the symbol on several charts with one click, save templates, and trade from a single hub.
It uses your broker's symbols (forex, crypto, metals, stocks, and more). Instrument selection is manual. Several open charts are recommended. It does not work in the Strategy Tester.
Featu
FREE
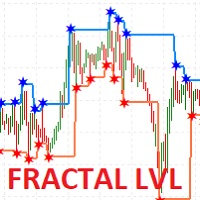
I present the well-known Fractal indicator.
Levels have been added to this indicator.
At the extreme points, you can see the continuation of the price line, which changes when the values of the Fractal indicator change.
The indicator is easy to use. The basic Fractal settings have been saved.
FractalLevels Parameters:
LeftBars - the number of bars on the left
RightBars - the number of bars on the right
FREE
This indicator is to be used in bot connectors for automation of Pct Multi indicator entries.
How to use: Configure the bot connector with the following information: Indicator name: pctmultibot Call buffer: 0 Put buffer: 1
Do not add this indicator to the chart, just configure it in the bot connector!
Pct Multi indicator:
https://www.mql5.com/en/market/product/111091
FREE

Adds the symbols listed in Binance Future to Metatrader5
With this free file, you can list the entire list right away. You can easily install it on your demo account It is the first file to be uploaded for Binance Future Tick and is offered for free.
Tools menu / Options / Expert Advisors / You need to select Use WebRequest for listed
You can watch videos to add metatrader
FREE

Индикатор показывает финансовый результат по всем открытым позициям открытым по инструменту. Это полезно если открыто несколько сделок в разных направениях. В подсчете результата учтены накопленные свопы и комиссии за открытие сделок. Результат отображается в отдельном подокне, чтобы не нагружать информацией рабочий график. Результат сделок отображается на горизонтальном уровне, который пользователь сам наносит на график и переносит на интересующий уровень цены. Горизонтальному уровню по умолчан
FREE

Простая торговая панель, позволяет открывать и закрывать сделки в тестере стратегий МТ5, устанавливать stoploss и takeprofit, а так же управлять ими с помощью кнопок на панели. Панель находится в правом верхнем углу, что при включенном правом отступе графика позволяет удобное использование не перекрывая график. так же имеется возможность устанавливать количеством лотов/контрактов в сделках.
FREE

Spread Info and Candle Timer Panel FREE - Essential Info Tool
Small, lightweight and fast information panel for scalpers and intraday traders. Displays real-time Spread in points and pips, current Ask/Bid prices and countdown timer to candle close.
Never miss a candle close again and always see your real spread.
FREE, No DLL, Lightweight & Fast - will not slow down your terminal.
FEATURES: Real-time Spread in points and pips Real-time Ask and Bid prices Candle Timer with countdown mm:
FREE

Robô de apresentação inicial para o mundo trader por Jason Ramalho Nascimento, programador em javascript e C, C# dês de 2024. As boas vindas universais desta vez apenas em português para mostrar ao mundo de 40% dos melhores programadores do mundo são brasileiros, Olá mundo! Com isso venho apresentar a vocês meus produtos virtuais para o auxilio de traders iniciantes.
FREE

"Twits Price speedometer" is an indicator designed to measure current "speed" and directional efficiency of price movement in real time. It has been developed as an Expert Advisor (EA) because it reacts to every incoming tick, making it independent from traditional chart time frames and capable of analyzing markets with extremely high precision, even at the level of individual ticks or milliseconds. The operating principle is simple yet highly effective. Within a user-defined analysis window (fo
FREE

Chart Candle Timer Pro is a professional candle countdown panel for MetaTrader 5. It displays a compact, elegant dashboard on your chart that shows the time remaining until the next candle opens, along with essential market data at a glance.
The panel updates every 200 milliseconds, ensuring a smooth and accurate countdown. It works on all standard timeframes from M1 to MN and adapts its time format automatically, showing HH:MM:SS for higher timeframes and MM:SS for shorter ones.
User Guide
FREE

Aegis Gold Dashboard is a free, lightweight visual indicator created to help traders monitor key market conditions in a clean and professional way.
This indicator is designed as a visual companion to automated or discretionary trading systems and does not execute any trades.
Features: • Informational signal overview (non-executable) • ATR-based volatility display • Market session open / closed status • Real-time spread monitoring • Last closed trade overview • Simple market condition tips
De
FREE
ZZA TRADE ASSISTANT This ZAA trade assistant indicator is very powerful. Here you can use this as your trading assistant . So while applying this use money management . This indicator can be use on 5 minutes timeframe, 15 minutes timeframe, 1 hour minutes timeframe and above . Try practice this on your demo account before using on real account . This indicator should apply on meta trader 5 .
FREE

Pips Keeper is a sophisticated Forex trade manager expert advisor designed to enhance trading efficiency and optimize profit-taking strategies. With its intuitive functionality, this EA empowers traders to automate the process of closing profitable positions at predefined profit thresholds, thereby maximizing returns and minimizing risks.
Key Features:
1. Threshold-based Profit Closure: Pips Keeper enables traders to set customizable profit thresholds, allowing for the automatic closure o
FREE

Add Logo Watermark – Showcase Your Signals with Clarity This indicator allows you to display a clean and customizable watermark on your chart, helping your audience easily identify what symbol you're currently trading. Display the current symbol as a watermark
Add current symbol text and customize its color
Choose to show only the logo, only the symbol, or both
Add your own custom watermark by placing custom.bmp in the MQL5 > Files directory Perfect for signal providers, educators, and
FREE

SSACD - Singular Spectrum Average Convergence/Divergence This is an analogue of the MACD indicator based on the Caterpillar-SSA ( Singular Spectrum Analysis ) method. Limited version of the SSACD Forecast indicator. Limitations include the set of parameters and their range.
Specificity of the method The Caterpillar-SSA is an effective method to handle non-stationary time series with unknown internal structure. The method allows to find the previously unknown periodicities of the series and make
FREE

Product Description Clean, Smart Sessions is a professional trading sessions indicator designed to provide traders with a clear, accurate, and clutter-free view of the active market sessions directly on the chart. The indicator dynamically detects and displays the active trading session (Asian, London, and New York) in real time, drawing a clean session box that continuously updates to reflect the session’s true high and low. When sessions overlap, each active session is handled independently
FREE

Фрактальная дивергенция - это скрытая дивергенция, построенная на фракталах Билла Вильямса. Бычья фрактальная дивергенция представляет собой комбинацию из двух нижних фракталов, последний из которых расположен ниже предыдущего, и при этом две свечи справа от минимума последнего фрактала имеют минимумы выше уровня предыдущего фрактала (см. скриншот 1). Медвежья фрактальная дивергенция - это комбинация из двух соседних верхних фракталов, последний из которых расположен выше, чем предыдущий верхн
FREE
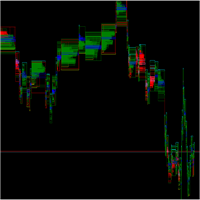
O SpreadFlow é um indicador para MetaTrader que gera um gráfico totalmente baseado no comportamento do fluxo de negócios, em vez de se limitar apenas a candles de tempo ou volume.
Ele organiza as informações de cada tick em quatro dimensões principais: Spread – monitora a diferença entre BID e ASK ao longo do tempo, mostrando momentos de compressão e alargamento do spread, associados a maior ou menor liquidez. Negócio no mesmo preço – identifica quando sucessivos negócios ocorrem no mesmo nível
FREE

Turn your trading history into a clean journal you can open in Excel or Google Sheets. How it works Click the button on the chart or let the utility export every day at a set time. Each closed position becomes one row: symbol, direction, volume, entry and exit time and price, SL, TP, pips, duration, profit, swap, commission and net result. A second summary file lists win rate, profit factor, average win and loss, largest win and loss and maximum consecutive losses. Key features One row per posit
FREE
Maximum Minimum Candle indicator is a basic indicator (but useful) that shows the highest and lowest candle in a period of time .
The indicator shows the maximum candle and the minimum candle for a defined period of time. You can choose the number of candles that make up the period The indicator will show with color points the maximum and minimum values. A message tells you when the price reaches the maximum or minimum.
Parameters number_of_candles: It is the number of candles that will be c
FREE

A Market Watch multi-timeframe ATR dashboard that turns a chart into a full-screen table showing each selected symbol’s recent volatility across multiple timeframes. It calculates ATR for the symbols visible in Market Watch, then displays the result in pips, points, or raw price units. Its practical use is volatility scanning, quickly finding instruments and timeframes that are moving enough—or quietly enough—for your trading style. Period that is worth using Sty
FREE

Introducing our simple yet powerful trendline trading expert, designed to open positions upon trendline breaks or touches based on predefined parameters. All you need to do is rename it to buy, sell, buy limit, or sell limit. As the name suggests, this is the basic version with minimal features. However, if you're looking for a truly professional trendline trading expert equipped with various trading management tools, automatic position sizing, trailing stops, breakeven points, partial closures,
FREE
Reverse TradeCopier for Followers can copy trades from an account that is running Reverse TradeCopier for Source . Features: Copies trades from one source (master) account to multiple following (slave) accounts. Allow investor (read only) password for source (master) account. There are no complicated settings and input parameters, everything is easy. Works with different brokers. Works with different quotes symbols (EURUSD_FX, eurusd_m, etc.). Can copy orders from 4-digit quotes platform to 5-
FREE

账户统计 – 用于 MetaTrader 5 的交易统计仪表板
账户统计是一款适用于 MetaTrader 5 的分析与报告工具。它将您交易账户的关键指标直接显示在图表上,并支持在不同时间周期内对您的交易表现进行结构化分析。 该产品面向希望系统性分析其交易结果并进行清晰记录的交易者。 功能
内置仪表板可实时显示最重要的交易指标,包括盈亏、胜率、利润因子以及其他统计数据。显示内容可在不同时间周期之间切换,包括日、周、月、年以及总体统计。 此外,该工具还提供自动报告功能。报告可在设定时间生成,并通过平台内置的通知功能发送。用户可以将每日分析与周期性汇总相结合。 程序能够自动识别如周、月、年切换等关键时间节点,并相应地补充报告内容。 在风险监控方面,将计算并显示最大回撤及历史权益数据等信息。
输入参数 InpLanguage: 选择仪表板显示语言(德语或英语) InpFontName: 指定您偏好的字体(默认:Arial) InpX / InpY: 设置仪表板在图表中的精确像素位置(之后可移动 InpBgColor: 仪表板背景颜色 InpMainText: 文字标签颜色 InpBtn
FREE
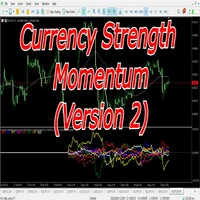
The currency strength momentum has a lot of similarities with currency strength meter presented in the previous page, but the difference are much more pronounced. You can try putting both in the same chart and see the difference in results. Currency strength momentum measures strength of a currency based on (you guess it) it's momentum relative to other currencies, while currency strength meter measures the strength of a currency based on pips it has moved in a certain direction.
FREE

Hotkey Fractals EA is a trading expert advisor designed for manual and semi-automated trading, built on the logic of the Fractalsalligatorfilter indicator. The EA helps quickly identify trading opportunities based on fractals with Alligator line filtering and instantly place virtual or market orders with pre-calculated Entry, Stop Loss, and Take Profit levels. The advisor is created for traders who work with breakout strategies, fractal market structure, and trend-direction trading. Its main pur
FREE

This indicator will show a vertical representation of the volume distribution within a selected user range.
This is a free version of the full product. It is limited to use on a week old data or older. Find the full product at https://www.mql5.com/en/market/product/42234 .
Main features: This Indicator will create an image that will allow viewing the tick volume per price level in a graphical form. The indicator will work on any range size in any time-frame, limited only by your computer mem
FREE

POTUSCalendar 白宫日程仪表板 - 不要错过影响市场的政治事件 POTUSCalendar 是一款专业的 MetaTrader 5 指标,可直接在您的交易图表上显示美国总统的公开日程。随时了解可能影响金融市场的白宫即将举行的活动,包括新闻发布会、官方声明、旅行计划和公开露面。 该指标自动从白宫官方公开日程获取实时数据,将所有活动时间转换为您的本地时区和经纪商时间,并在优雅、可自定义的面板中显示所有内容。无论您交易外汇、指数、商品还是加密货币,了解重大政治事件对于做出明智的交易决策至关重要。 阅读更多: 完整文档和设置指南 (English) 限时优惠: 前 50 次下载免费!之后,本产品将收费。立即下载以获取您的免费副本。 主要特点 实时白宫日程: 自动从官方来源获取并显示最新的总统活动 自动时区转换: 同时显示 ET(东部时间)、您的本地时间和经纪商服务器时间的活动时间 颜色编码的活动类型: 使用可自定义的彩色徽章立即识别活动重要性(官方日程、新闻发布会、媒体召集、旅行等) 实时倒计时计时器: 通过根据紧急程度改变颜色的动态倒计时准确了解活动何时发生(紧急为红色、临近为橙
FREE
MetaTrader市场提供了一个方便,安全的购买MetaTrader平台应用程序的场所。直接从您的程序端免费下载EA交易和指标的试用版在测试策略中进行测试。
在不同模式下测试应用程序来监视性能和为您想要使用MQL5.community支付系统的产品进行付款。
