YouTube'dan Mağaza ile ilgili eğitici videoları izleyin
Bir ticaret robotu veya gösterge nasıl satın alınır?
Uzman Danışmanınızı
sanal sunucuda çalıştırın
sanal sunucuda çalıştırın
Satın almadan önce göstergeyi/ticaret robotunu test edin
Mağazada kazanç sağlamak ister misiniz?
Satış için bir ürün nasıl sunulur?
MetaTrader 5 için yeni Uzman Danışmanlar ve göstergeler - 78

Demarker pullback system - is the manual trading system for choppy markets. It show 2 colored histogram. When histogram is blue - market is quite bullish, when histogram ir orange - market is more bearish. Up arrow is plotted when histogram is in oversold zone but blue color. Down arrow is plotted when histogram is in overbought zone but orange color. These patterns shows false breakout and possible soon reverse(price is overbought but shows bearish signs and price is oversold but shows bullis

Violence Great Wall is an MT5 intelligent trading robot. It takes into account the price support and pressure position, and provides phased prediction in the future, accurate opening position, and stable stop loss position. The main trading variety is gold! To be on the safe side, it is recommended that you provide funds above 3000 dollars, and leverage above 1:500. The position opening is extremely accurate, but due to the complexity of position opening factors, we must keep EA running stably

Core Long this bot works with the help of two iEnvelopesM indicators (modified iEnvelopes) and one iFractals trading principle for buying and selling at the same time.
The essence of the work is to open a series of orders and exit the market either in profit or with losses, but exit and not linger and open the next series according to indicator signals. The heart of this algorithm is market exit formula, when to exit and with what profit or loss, how many orders can be allowed to be used in a

Core TDM this bot works using the Trend TD indicator.
The essence of the work is to open a small series of orders and exit the market either in profit or with losses, but exit and not linger and open the next series on the signals of the indicator. The heart of this algorithm is the formula for exiting the market, when to exit and with what profit or loss, how many orders can be allowed to be used in a series. And the settings of the Trend TD indicator. The bot works throughout history, but y

Short TD this bot works using the Trend TD indicator.
The essence of the work is to open a small series of orders and exit the market either in profit or with losses, but exit and not linger and open the next series on the signals of the indicator. The heart of this algorithm is the formula for exiting the market, when to exit and with what profit or loss, how many orders can be allowed to be used in a series. And the settings of the Trend TD indicator. The bot works throughout history
This EA is designed to calculate and draw Pivot Point, Support and Resistance for your selected time frame on the chart.
Works on all currency pair and on any time frames available on MT5.
To make sure the EA works, you need to select the pivot time frame as well as the candle shift that you want to calculate the pivot.
0 = Current candle on chart
1 = Previous 1 candle on the chart

Do you know what is The Blue Ocean Strategy ?
It is when an entrepreneur goes on a brand new market with no concurrence because nobody knows about it. This way, the entrepreneur is in a situation of monopoly and can enjoy this situation as long as nobody comes into the market. And you know what ? This situation is reproducible in bot trading thanks to the Blue Ocean Strategy EA MT5.
I’m a prop firm trader and I use it myself to make all my trades. After many years of use, a friend told m

Multy TDM this bot works using the Trend TD indicator. The multicurrency bot works with 12 pairs, pairs can be changed and others can be used.
The essence of the work is to open a small series of orders and exit the market either in profit or with losses, but exit and not linger and open the next series on the signals of the indicator. The heart of this algorithm is the formula for exiting the market, when to exit and with what profit or loss, how many orders can be allowed to be used in

Monitoring Account MT4 Version
Wirama Rush M9 MT5 is advance trading system use multilevel support and resistance to find the best price in market, integrated with the best risk management to open position carefully in moderate lotsize.
Main Pairs : NZDCAD,AUDNZD,AUDCAD Time Frame : M15 Minimum balance to start with $5000 or cent account Only 10 copies of the EA out of 10 left at $199 Next price $299 Features: Multiple currency pairs support True backtest support TDS (no hardcod

Current : This first version of AlgotradeClub EA was developed by the strategist with a focus on CFD operations on Global Indices (Us500, UsTec, Fr40, etc.). Operates the main direction of the trade only buy positions opening positions in bar opening respecting the minimum distance as parameterized. There is an option to open sell positions after “n” buy positions, placing Stop Gain of each sell when the buy position “n+1” is executed. The closing of each trade takes place through the financial
Algo Bot is an expert advisor that is designed and optimized for GBPUSD. It is extremely easy to use, just open the GBPUSD pair, load the bot and activate Algo Trading. You can leave the default values. This bot does not use any technical indicator, its algorithm is based on price action, placing BuyLimit and SellLimit orders in optimal zones for GBPUSD.
The parameters of the EA are: Magic number: Number to identify the positions of this EA. Points to place the next order: Points at which the
The Indicator assists in decision making along with the user's market reading. By drawing the trend, this indicator becomes very useful on days of high volatility in the market, that is, it offers strategic insights on days of economic data, news or pronouncements. On flat market days it becomes usual to identify possible market reversals. Follow Youtube to understand the most suitable scenarios for its use.

EA ELA MT5 is a unique fully automated Expert Advisor which is built on the backbone of a simple trend following trading system. It’s a powerful price action EA which uses well known and extremely efficient Indicators like MA, AD and ATR to find the most profitable trades hence making it suitable for beginners and experienced traders.
The EA was designed to trade Indices and Synthetic Index. With the right settings, using the recommended broker with a low spread and a fast VPS, EA Ela MT5 has

KT Forex Trend Rider uses a trend following algorithm developed specifically for the Forex market to provide reliable buy & sell signals across the major currency pairs. It works best on major FX pairs and all time-frames.
Features
It comes with a Multi-Timeframe scanner that can search for upcoming signals across all the time-frames. It comes with four preset profiles to facilitate trading for scalpers, tick-trend, swing, and trend traders. It marks the potential reversal points in the mark

Данный индикатор показывает объем каждого бара (видимый диапазон) в пунктах. Гибкие настройки отображения значений. Возможна настройка параметров показа. Индикатор создавался для личного пользования, анализа графиков. Параметры: Color - цвет текстовых меток; Position - позиция метки: 0 - снизу, 1 - сверху; FontSize - размер шрифта; Angle - угол наклона текста; GapPoints - отступ по вертикальной оси.
FREE

OnBoard stats is a panel that show in a single view a lot of usefull information about working orders and trading account. It has 4 different sub-panels (from left to right): Symbols order statistics : it can be found symbols for which there are orders (market or pendings). Symbol with pendings are colored with "Pendings color". Clicking on a specific symbol row, chart will be changed to that symbol. Current symbol statistics : informations about the "current" symbol, the one which is opened in
FREE

Robot Trading Gold is a fully automated trading system that doesn't require any special skills from you. Just fire up this EA and rest. You don't need to set up anything, EA will do everything for you. EA is adapted to work on small deposit over $100 for good work.
Timeframe: 15 Min
Currency pairs: XAUUSD PROFITABILITY AND RISK The expected estimated profitability according to the backtest data is about 300% - 600% per year. The expected maximum drawdown is about 90% or more . Attention!
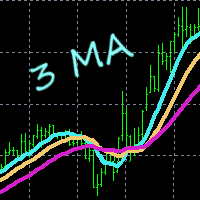
This indicator gives you a modified version of three Moving Averages. Great for scalping. Does not feature any alerts, and is best used manually after confirming multi line displays. Settings: Period1 Period2 Period3 Period4 How to use: Simply attach to any chart with default settings. Buy when the 4 lines converge below the price. Sell when the 4 lines converge above the price. Take note of the slope of Period4. See example pictures below. Best results when looking at three or more time frames

Seven copies left at $99 USD. Next price is 149 USD . set file Smooth Lift is an indicator-based trading system that includes 7 indicators, including trend indicators, volume indicators and indicators of possible price movement strength. They are used to confirm the analysis of the main Smooth Lift trading system. The trading is performed on 24/5. The strategy was developed taking into account the movement of the currency pair USDCHF and the best trading performance is on it.
Recommendations:
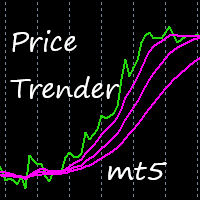
This indicator uses a special algorithm to plot the 4 lines for trading. Great for scalping. Features alerts. Settings for trend filters. How to use: Simply attach to any chart with default settings. Buy when the three pink lines converge below the green line. Sell when the three pink lines converge above the green line. Best results when looking at three or more time frames, and the three blue lines have just converged below or above the green line.
Use as you see fit for your strategy. Best r
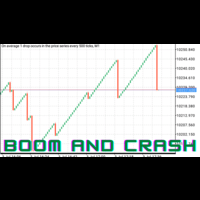
The BoomAndCrashEA , based on vector machine learning, is an advanced trading tool that uses the latest advances in computing technology to analyze the forex market and predict future price movements. The Expert Advisor will use vector machine learning to learn huge amounts of historical data and quickly and efficiently detect patterns in the market. It will use a sophisticated and complex proprietary algorithm which uses advanced mathematical calculations to solve complex problems and optimize
The KT Trend Angle helps to identify ranging and trending markets. The idea is to only enter a trade following the market trend if the slope is steep enough.
An angle is the ratio of the number of bars to the number of points: The bars mean the time offered by standard (M1, M5, etc.) and non-standard time frames. Points represent the unit of price measurement with an accuracy of 4 or 5 decimal places.
Input Parameters Period: An integer value to define the intensity of angled trendlines. A

2 copies left at 49 USD. Next price is 99 USD . set file
- This is a very aggressive trading strategy, based on a modified MACD indicator. It is used to analyze the anomalous zones of the market + author's methodology to restore the critical movement.
The strategy was developed taking into account the movement of the currency pair USDCHF and the best rates of trade just on it.
Recommendations:
- H1 USDCHF - Leverage of 1:500 or higher (ideally 1:1000 or 1:2000) - Minimum deposit 100 uni

KT Forex Blau Balance combines elements of momentum and volatility. It helps you identify entry and exit points.
Blau Balance consists of two moving averages (a slow-moving average and a fast-moving average) intersecting key transition points in market price. The indicator turns green or red when one is above or below the other, signaling to buy or sell trade signals.
It can be used in currency pairs and other markets that your MT4 or MT5 platform supports. Both short-term and long-term tra

The KT De Munyuk is a trend-based indicator that uses Parabolic SAR to identify the market direction. The indicator shows the PSAR in the form of green/red dots using a separate window. Buy Signal: When a green dot appears after a series of at least three red dots. Buy Exit: When a red dot appears on the current or next higher time frame. Sell Signal: When a red dot appears after a series of at least three green dots. Sell Exit: When a green dot appears on the current or next higher

In MetaTrader, plotting multiple horizontal lines and then tracking their respective price levels can be a hassle. This indicator automatically plots multiple horizontal lines at equal intervals for setting price alerts, plotting support and resistance levels, and other manual purposes. This indicator is suitable for Forex traders who are new and looking for chances to make quick profits from buying and selling. Horizontal lines can help traders find possible areas to start trading when the

KT XMaster Formula is a buy & sell signal indicator that works magically on most of the timeframes and currency pairs when used correctly.
The indicator uses calculations based on moving averages, RSI, and MACD. It is usually appropriate for scalping and trend trading - whether you are a novice or an experienced trader, the signals generated by this indicator are simple to understand and implement.
Overview The indicator comprises green and red dots arranged in wavy lines. These dots corre
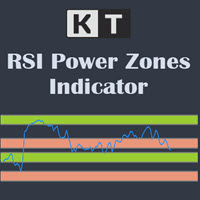
The KT RSI Power Zones divides and shows the movement of RSI into four different power zones to identify the potential support and resistance zones using the RSI.
Bull Support The bull support ranges from 40 to 50. The price is expected to reverse to the upside from this zone.
Bull Resistance The bull resistance ranges from 80 to 90. The price is expected to reverse to the downsize from this zone.
Bear Support The bear support ranges from 20 to 30. The price is expected to reverse to the

KT Price Border creates a three-band price envelope that identifies potential swing high and low areas in the market. These levels can also be used as dynamic market support and resistance. The mid-band can also be used to identify the trend direction. As a result, it also functions as a trend-following indicator. In addition, its ease of use and more straightforward conveyance of trade signals significantly benefit new traders.
Features
It works well on most of the Forex currency pairs. It

The BSI stands for Bar Strength Index. It evaluates price data using a unique calculation. It displays readings in a separate window. Many financial investors mistake this indicator for the Relative Strength Index (RSI), which is incorrect because the BSI can provide an advantage through its calculation method that the RSI indicator does not. The Bar Strength Index (BSI) is derived from the Internal Bar Strength (IBS), which has been successfully applied to many financial assets such as commodit

The KT Tether Line is a trend-following tool consisting of three indicators that work together to generate trading signals. It can correctly identify market trends while signaling trade entries. It was first introduced by Bryan Strain in the Stock & Commodities magazine in 2000 in "How to get with the trend and out at the end."
The Concept
When a market trend is confirmed, the most challenging part is determining the timing of the entries. This indicator alerts you to potential trend reversal

Advance Trend Intellegence EA is Powefull Expert Advisor base on trend following strategy. This expert using advance dynamical algorithm to cathching the market trend. With this EA orders that are made accurate entry orders in the market in tune with the trend signal. This EA have a good performance that has been tested more than 1 years with real ticks history data.
Although this EA can be use on any pairs, but please Use this EA on EURUSD Pair at M15 timeframe. Account type : HEDGE.
Adva

Um Inside Bar é um dos principais sinais de continuidade de uma tendência existente e as vezes reversão, pois nos mostra locais especiais de entrada, possibilitando uma boa taxa de Risco x Retorno. É simples visualizar um Inside Candle. Esse padrão é formado por apenas dois candles. O primeiro deve ser, preferencialmente grande, e o segundo deve estar integralmente contido dentro dos limites de máxima e mínima do primeiro.

Overview This expert advisor is based on statistic model created using historical data. Our model lead to prepare parameters to drive Martingale strategy. It plays on USDCAD pair. To work proper with full strategy EA should be able to open total positions of 3.62 lots (sum of all possible open positions at the same time) and some margin for safety. For example it can be approximately at least 1200GBP with 500:1 leverage on account. It must be able to play 0.01 lots positions. Screenshots presen

Oynaklık analizörü, sıkı bir ticaret aralığında konsolide edildikten sonra fiyatın güçlü bir şekilde kırılma eğiliminden yararlanan bir momentum göstergesidir. Gösterge ayrıca, sıkıştırma tetiklendiğinde hareketin beklenen yönünü göstermek için bir momentum osilatörü kullanır. Bu histogram sıfır çizgisi etrafında salınır, sıfır çizgisinin üzerinde artan momentum uzun satın alma fırsatını gösterirken, sıfır çizgisinin altına düşen momentum bir kısa devre fırsatını gösterebilir.
SINIRLI SÜRELİ

Pin Bar Dedektörü, grafikte Pin Bar fiyat hareket modelini bulan bir göstergedir. Pin Barlar, Dragon Fly Doji, Grave Stone Doji, Hammer, Inverted-Hammer, Hanging Man ve Shooting Star gibi uzun üst veya alt gölgeli ve çok küçük gövdeli Japon şamdanlarına alternatif olan klasik bir çubuk deseni olan "Pinokyo Çubukları" için bir kısayoldur. .
SINIRLI SÜRELİ TEKLİF : Gösterge sadece 50 $ ve ömür boyu kullanılabilir. (Orijinal fiyat 125$ )
Ana Özellikler Boğa Pin Bar Dedektörü. Ayı Çubuğu Dedekt
FREE

The EA for manual trading to manage open positions.The built-in trailing stop has five modes and seven instruments. There is a virtual stop loss and a virtual take profit, which can be freely moved around the chart. With the help of the built-in trading simulator, you can check how the EA works in the strategy tester. Guide to UTrailingMinMT5 can be found in the "Comments" section. In the MT5 strategy tester, manual movement of virtual SL and TP lines according to the schedule does not work! Ben

About the indicator: DALA Forecast is a universal tool for predicting the dynamics of time series of any nature. For prediction, modified methods of nonlinear dynamics analysis are used, on the basis of which a predictive model is built using machine learning methods. To get the trial version of the indicator, you can contact me in private messages.
How to use the indicator: Apply the indicator to your chosen financial instrument or indicator with the settings you need. The prediction will b
FREE

Tüccar her işlem açtığında, yaptığı işlemin karını ve riskini bilmesi gerekir, böylece alacağı risk ve kar fırsatını belirleyebilir. Bu hesaplamayı manuel olarak belirlemek, özellikle yapılacak çok fazla açık ticaret varsa, oldukça zahmetli olabilir.
Trading Panel Katana, yatırımcıların bu ihtiyaçları karşılamalarına gerçekten yardımcı olan bir yardımcı araçtır. Piyasa açma veya bekleyen işlem, lot, pip, fiyat pozisyonları, ne kadar USD ve risk yüzdesinin belirlenmesi otomatik olarak ayarlana

MQL5 Piyasasındaki En İyi Kopya Ticaret Aracı!
Ayrıcalıklı Özellikler:
- Magic Number kullanarak EA'ları kopyalamak için yönetim, Ana hesabın birden fazla strateji yüklemesine izin verir. Bu, bağlı Köle hesapların alınan sinyalleri ve işlem hacmini ayrı ayrı işlemesini mümkün kılar; - Sistemi sabit parti veya Ana hesap çarpan faktörü ile kopyalayın; - Sipariş çarpanı: Egzotik CFD'lerde likidite limitlerini çözün; - Kaybı Durdur ve Kar Al İşlevlerini Gizle: Kaliteyi ve fiyat uygulamasını öne

Şiddet Great Wall, MT5 akıllı ticaret robotudur. Gelecekteki aşama tahminleri, doğru açık pozisyonlar ve istikrarlı durma kaybı pozisyonları sağlayarak fiyatın destek ve basınç konumunu dikkate alır. Ana işlem çeşitliliği altın! Sigorta uğruna, 3.000 ABD dolarından fazla dolar sağlamanız önerilir ve kaldıraç 1: 500 ile önerilir. Pozisyonun açılması son derece doğrudur, ancak konumun açılması karmaşık olduğu için EA'yı uzun süre tutmak gerekir. Aşağıdaki şekil açık pozisyonun kârlılığını gösterme

Gösterge, Trend Çizgisi, Dikdörtgen, Metin nesneleriyle çalışır ve bunları bir grafikten diğerine oluşturup kopyalamanıza olanak tanır.
Otomatik kopyalayıcılara daha uygun bir alternatiftir, çünkü neyin ve nereye kopyalanacağını daha esnek bir şekilde seçmenize izin verir.
Kısayol tuşları:
'1,2,3,4,5,6' - ince yatay çizgiler oluşturma (renk ayarlarında ayarlanır), SHİFT ile aynı - kalın çizgi ' ~ ' - rastgele renkli bir çizgi oluşturma ))) '7,8,9' - boyalı dikdörtgenler oluşturma (renk ay
A professional tool for trading - the divergence indicator between the AO and the price, which allows you to receive a signal about a trend reversal in a timely manner or catch price pullback movements (depending on the settings). The indicator settings allow you to adjust the strength of the divergence due to the angle of the AO peaks and the percentage change in price, which makes it possible to fine-tune the signal strength. The indicator code is optimized and is tested very quickly as part
FREE

A professional tool for trading - the divergence indicator between the AC and the price, which allows you to receive a signal about a trend reversal in a timely manner or catch price pullback movements (depending on the settings). The indicator settings allow you to adjust the strength of the divergence due to the angle of the AC peaks and the percentage change in price, which makes it possible to fine-tune the signal strength. The indicator code is optimized and is tested very quickly as part
FREE

The effectiveness of the adviser is confirmed by trading on real accounts. Signal https://www.mql5.com/ru/signals/1714293 The Invest Time Classic uses many different strategies, including mean reversion, trend following, and a smart grid system with variable take profit levels that adapt to market conditions. Unlike conventional grid systems, where the risk is very high compared to the potential profit, Invest Time Classic will only open trades under suitable market conditions, which is confirme
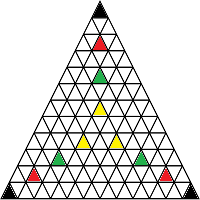
A strategy based on triangular arbitration. At the same time, we open positions on three currency pairs. For example, EURUSD – USDJPY – EURJPY, i.e. we buy all three currencies so that the circle is closed. Thanks to this, wherever the price goes, open positions insure each other. Due to this, you can open quite large lots. The adviser will provide you with triangle options himself from all open pairs in the market overview.
The Expert Advisor opens triangles simultaneously in two directions

Core SCB this bot works without indicators , the principle of trading is for buying and selling at the same time .
It should be noted that no matter how well the indicators show, there is always a moment when the indicator can give a signal to enter at the peak of the beginning of the trend in the other direction. Thus, the essence of using the indicator is completely reset. Therefore, one of the options for getting out of the situation is to completely abandon indicators and constantly work

MT4 Version Order Blocks Zone Scalper is dedicated to all people who like order blocks trading but do not have the time to stare at the charts every day or the discipline to follow a trading strategy. It is also for everyone who likes to experiment and optimize parameters on their own. If you belong to this type of person, it is your lucky day, as I decided to keep all EA parameters available to you so that you can optimize the EA to your own taste. To understand how this EA works, come read my

The movement exhaustion is a color rule that helps indicate when the movement will revert its direction. The darker the color, the greater the probability to revert. The indicator is based on the price statistic. Works on every timeframe, every instrument. Five color options: 0. Natural movement. (Gray) 1 - 4. Movement exhaustion (Yellow to maroon) The trader can use it as reversal or exhaustion signal. In a trend following trade it can be used as an exhaustion signal, indicating the movement ca

Here’s the problem: the default zigzag indicator given in MT5 trading platform does not really capture the most of the highs and lows on chart do draw zigzags. On chart below, notice that some of ther high, low of price have been missed to draw zigzags by this default zigzag indicator (picture 1). It is not so apparent until you compare default zigzag indicator to this SwingZZ indicator. Have a look on picture 2 and 3. The swing zigzag indicator is best because it captures most of the swing high
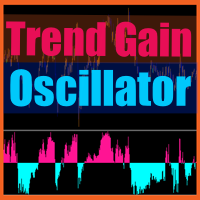
Trend Gain Oscillator - is the manual system for defining trend phase(bullish/bearish). When histogramm is pink - market is up/bullish and when histogramm is blue - market is down/bearish. Arrows is plotted on zero cross, in case if additionally market has power for future movement. Main inputs are : trendPeriod- main indicator's period for trend calculation; trendPowerPeriod - period for market's power(volatility+volume) calculation ; trendPowerTrigger - arrows is not plotted if market's power
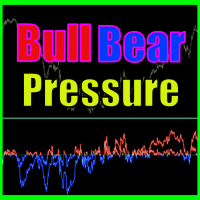
Bull bear pressure indicator - is the manual system which defines bull/bear market. When lines is above zero level - market is strong bullish, and when lines below zero level - market is bearish. First line represents global trend and second one are smoothed and shows local market's mood. Main inputs are : MainPeriod- main indicator's period for global trend calculation; SignalPeriod - period for smoothed and shows local market's trend; Main Indicator's Features Signals are not repaint,non-late

ROC acceleration-deceleration is the manual system for medium-term scalping. Indicator based on custom ROC system which defines bullish/bearish market and especially acceleration-deceleration of tendention in the market's main direction. Buy arrow is plotted during bearish market when current trend decelerates and sell arrow is plotted during bullish market when current trend decelerates. Main Indicator's Features Signals are not repaint,non-late or disappear(exept cases when system recalculat

ASI fractals with DPO filter - is the manual trend-following system. ASI fractals are the base of every trend. System plots an arrow when fractal pattern appears on ASI indcator and DPO direction is same as incomming signal. System has several ways of usage : simply indicator, indicator with suggested arrows, arrows with single targets and arrows with common profit targets. User can simply switch indicator's modes directly from chart. Main Indicator's Features Signals are not repaint,non-late or
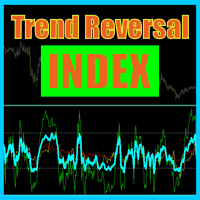
Trend reversal index - is the manual trading system that works with overbought , oversold levels and reversal patterns. Sell arrow is plotted when indicator is higher than overbought level and here forms reversal pattern, all pattern points located higher than overbought level. Opposite with buy arrow : ndicator is lower than oversold level and here forms reversal pattern, all pattern points located lower than overbought level. Main Indicator's Features Signals are not repaint, late or disapp

Theoretical Foundation The Keltner Channels are channels ploted using volatility deviations above and bellow a moving average. The indicator is an excellent tool to help the trader build trend and mean-reversion strategies. Parameters The Orion Dynamic Keltner allows the user to select the Volatility Calculation Type, being ATR or Average Range (not considering price gaps). Also, the user can select the Calculation Period, Number of Deviations, Moving Average Mode and the Moving Average Ca

Theoretical Foundation Similar to the well-known Average True Range (ATR), the Average Range indicator is a volatility measure that is calculated using only the range of the bars (high – low), not considering the Gaps, as with the ATR. The Average Range can be very useful for day traders as it allows one to get the measure of the volatility of the last N bars. Parameters You can select the calculation period of the indicator.

The utility for manual trading to manage open positions.The built-in trailing stop has three modes and seven instruments: by pips, by bar extremes, by fractals, by volumes, by MA, by Parabolic SAR and by ATR. With the help of the built-in trading simulator, you can check how the EA works in the strategy tester. Guide to UTrailingMiniMT5 can be found in the "Comments" section. Benefits 3 trailing stop modes: normal, total and mobile stop loss; 7 options: by points, by bar extremes, by fractals, b

Early WPR divergence - is the manual system to define trend reverse. Green histogram shows main trend, Orange one - shows "short"/local trend. System is looking for clear divergence between both trends and pick up position(plot buy/sell arrows). When main trend is up, but local trend reverses to bearish trend and get's big power - sell arrow is plotted; When main trend is down, but local trend reverses to bullish trend and get's big power - buy arrow is plotted; Main inputs are : mediumTrendPe

Optimized from 2004 to 2022. Optimize further after this date, use monthly or yearly. Experts need optimizing as markets develop new ranges. New Age Bot trades XAU/USD on 5 minute charts. Entry - Bollinger bands and trend trading reversals is used for entries. Stops - Trailing stops are used with ATR. Money - lots Bollinger band period - 20 MA period - 100 Deviation - 2.0 Symbol for build - XAU/USD Time frame for build - 5 minute charts Risk Disclaimer Trading foreign exchange on margin carri
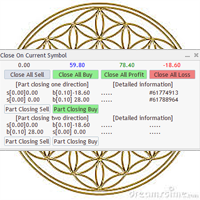
Utility / EA to simplify the exit from the drawdown. Allows you to gradually exit the drawdown correctly, reducing the volume of losing trades. At the same time, profitable trades opened on the same symbol cover losing trades in whole or in part. The volume of partial closing of a losing trade is calculated automatically. Trades opened both in one direction and in the opposite direction are supported. Position Management Closing positions only for purchase, only for sale, only profitable, only

Robô Davi I by Êxodo Capital is a professional system for traders created for the MT5 platform and optimized to work with MINI FUTURE INDEX (WIN) at B3 in BRAZIL.
The system uses bias algorithms. After identifying the trend, the position is opened and the robot conducts the trade through a trailing stop that will be driven by the 13-period average. Maximum GAIN of 2200 pts.
Main features Our setup has the option to use martingale, the EA has the option to customize. Presentation in the

Normal Parabolic SAR with label of long or short state. Tells also "Parabolic long" and "short". Can be used in multitimeframe layouts together with Swiss HolyGrail indicator or in different timeframes. So, if all the indicators show "long" or "short" you can be sure that the risk of a wrong direction is small. The standard values for Parabolic SAR are 0.02 for step and 0.2 for maximum. You may experiment with changing the maximum to get smother curves. Note that changes in parabolic SAR are la
FREE
Индикатор отображает изменение баланса В правом нижнем углу окна.
Отображаются следующие периоды Сегодня Вчера 3 дня Неделя 10 дней Месяц 3 месяца Полгода Год Все время Есть возможность выставить расчетное время. Удобно пользоваться для расчетов прибыли/убытков с определенного часа.
Будет полезен например ночным скальперам. Данные совпадают с расчетами отчета в терминалее.
FREE

OPTIMIZE BEFORE BACKTEST AND TRADING Day trade the markets. Any market, any time frame but its recommended to trade 5 minutes for some inputs but experiment with time frames and assets to see the best . It is important to optimize the inputs of the EA before back testing and using. Last month option to a year is recommended.
Parameters for intraday trading are: Weight Weight of signal of the module in the interval 0 to 1. GoodHourOfDay Number of the only hour of day (from 0 to 23) when tra

reguired set file Live Siqnal - is a trading system based on the correlation of several classical indicators with certain parameters to achieve the necessary goals of market entry and exit control. The minimum number of parameters greatly simplifies the work with the Expert Advisor. The strategy is based on a classic overbought/oversold system with the possible influence of market strength on the price movement in a certain direction. Recommendations for trading: - TF H1GBPUSD - leverage 1:500

Optimize for time frame and asset before back test and use, use last year or monthly for parameters. XAU/USD 1 HR recommended. Parabolic works on any asset or time frame. This EA uses parabolic sar as the signal. Percentage of margin is used for entries. So for low risk it would be 1% of margin and for medium risk it would be 5-10% and high risk would be above these amounts. Also taking into account the smaller time frame or larger time frame + asset for risk management assessment.
Risk

Expert Advisor, oz sermayeyi sürekli izleyerek ve parametrelerde girilen kurallara göre hesabınızı beklenmeyen kayıplardan koruyacaktır. Kurallar ihlal edildiğinde EA tüm işlemleri kapatacaktır. EA'yı tüm işlemleri belirli bir yüzde veya para kaybıyla kapatacak veya belirli bir yüzde veya para kârıyla kapatacak şekilde ayarlayabilirsiniz. Bu yardımcı program, çekilişi düşük tutmak ve öz sermayenizi korumak için Prop Trading Challenges için çok kullanışlıdır!
Sinyallerim ve diğer ürünler

MT5 GÖSTERGESİ.
Bu gösterge, herhangi bir grafikte, herhangi bir zaman diliminde ve herhangi bir komisyoncuda talep ve arz bölgelerini algılar. Teknik analiz için mükemmeldir.
Varsayılan olarak, kırmızı çizgiler güçlü satış bölgelerini gösterirken yeşil çizgiler güçlü alım bölgelerini gösterir. Bir çizgi çizildiğinde (yeşil veya kırmızı), çizgiyi kapatmak için fiyatların o bölgeye geri dönme olasılığı %99'dur.
GİRİŞLER:
(bool) Four_candle = false :Dahili hesaplamalar için Dört mum K

Live broadcast of the indicator on YouTube. Please click on the link below for more credibility. There are also videos of the indicator that you can watch. Note that the broadcast is late, do not rely on it. Only a review of the indicator is only a review of the indicator’s accuracy, which does not lose almost and the profit rate reaches 95%. I will work with great accuracy on the CRASH coin 1000 INDICES
MetaTrader Mağaza, geliştiricilerin ticaret uygulamalarını satabilecekleri basit ve kullanışlı bir sitedir.
Ürününüzü yayınlamanıza yardımcı olacağız ve size Mağaza için ürününüzün açıklamasını nasıl hazırlayacağınızı anlatacağız. Mağazadaki tüm uygulamalar şifreleme korumalıdır ve yalnızca alıcının bilgisayarında çalıştırılabilir. İllegal kopyalama yapılamaz.
Ticaret fırsatlarını kaçırıyorsunuz:
- Ücretsiz ticaret uygulamaları
- İşlem kopyalama için 8.000'den fazla sinyal
- Finansal piyasaları keşfetmek için ekonomik haberler
Kayıt
Giriş yap
Gizlilik ve Veri Koruma Politikasını ve MQL5.com Kullanım Şartlarını kabul edersiniz
Hesabınız yoksa, lütfen kaydolun
MQL5.com web sitesine giriş yapmak için çerezlerin kullanımına izin vermelisiniz.
Lütfen tarayıcınızda gerekli ayarı etkinleştirin, aksi takdirde giriş yapamazsınız.