YouTube'dan Mağaza ile ilgili eğitici videoları izleyin
Bir alım-satım robotu veya gösterge nasıl satın alınır?
Uzman Danışmanınızı
sanal sunucuda çalıştırın
sanal sunucuda çalıştırın
Satın almadan önce göstergeyi/alım-satım robotunu test edin
Mağazada kazanç sağlamak ister misiniz?
Satış için bir ürün nasıl sunulur?
MetaTrader 5 için yeni Uzman Danışmanlar ve göstergeler - 80

This Expert Advisor combines classic mean reversion with an advanced Bollinger Band Walk Filter to trade when momentum is confirmed.
It can be adapted between mean reversion and a breakout strategy (Bollinger walk), reducing false signals and improving trade precision.
The Walk Filter detects sustained price interaction with Bollinger Bands over N consecutive bars.
Only after this walk is confirmed does the EA enable breakout trades in the corresponding direction.
Upper band walks trigger breako

Limiter Drawdown EA – Otomatik Hesap Koruması Limiter Drawdown EA , MetaTrader 5 için hafif bir risk yönetim aracıdır.
Hesapta oluşan düşüşü (drawdown) gerçek zamanlı izler ve sizin belirlediğiniz sınır aşıldığında tüm pozisyonları otomatik olarak kapatır. Her tür ticaret stratejisi için basit ve güvenilir bir güvenlik katmanıdır. Ne yapar Sermaye (equity) ve bakiye oranını sürekli izler Drawdown belirlenen seviyeye ulaştığında tüm pozisyonları kapatır Yeniden girişleri önlemek için bekleyen e
FREE
DT DB TOPDOWNANALYSIS PRO-P EA (Türkçe) DT DB TOPDOWNANALYSIS PRO-P EA , EURUSD gibi döviz çiftleri, altın ve endeksler üzerinde yapılandırılmış ticaret için tasarlanmış bir Uzman Danışman (EA) sistemidir. Prop firm traderları, bireysel traderlar ve algoritmik ticaret meraklıları için özel olarak geliştirilen bu EA, fiyat hareketi desenlerine dayalı metodik bir yukarıdan aşağıya analiz stratejisi uygular ve trend değerlendirmesi ile dinamik kontrollerle güçlendirilmiştir. Otomatik yürütme ile ma

Solid Swing I, Support/Resistance Complete v5.01 - Buy 1 of Solid Strategies and get 2 of other Solid Strategies FREE Professional Multi-Timeframe Support and Resistance Trading Expert Advisor EA2 Support/Resistance Complete v5.01 is a sophisticated trading system that combines four powerful support and resistance strategies with advanced risk management and progressive trailing capabilities. This EA is designed for serious traders seeking consistent performance across multiple currency pairs

Türkçe (Turc) – Weekly Levels Pro Weekly Levels Pro – Haftalık Ana Seviyeler MetaTrader 5 için basit ama güçlü bir göstergedir ve her haftanın en önemli dört işlem seviyesini otomatik olarak gösterir: Haftalık Zirve (Weekly High) → doğal direnç seviyesi Haftalık Dip (Weekly Low) → doğal destek seviyesi Haftalık Açılış (Weekly Open) → trend referans noktası Haftalık Kapanış (Weekly Close) → boğa veya ayı gücünün göstergesi Ana Özellikler: Yeni haftanın başında otomatik güncelleme
Grafik
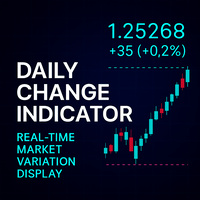
Günlük Değişim Göstergesi - Gerçek Zamanlı Piyasa Değişimi Görüntüleme Genel Bakış
Günlük Değişim Göstergesi, MetaTrader 5 için tasarlanmış profesyonel bir işlem aracıdır ve grafiğinizde doğrudan günlük fiyat değişimlerinin gerçek zamanlı izlenmesini sağlar. Bu hafif ancak güçlü gösterge, mevcut günün fiyat değişimini hem mutlak puan hem de yüzde olarak gösterir ve anlık piyasa değerlendirmesi için Bid fiyat çizgisinin yanında uygun şekilde konumlandırılır. Temel Özellikler Gerçek Zamanlı Günlü
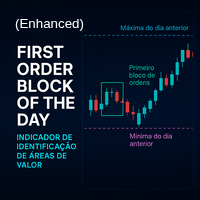
First Order Block of the Day Göstergesi - Değer Alanları Tanımlama Açıklama
First Order Block of the Day (Günün İlk Emir Bloğu) göstergesi, emir blokları ve piyasa profili analizi kavramına dayalı işlem yapan traderlar için temel bir araçtır. Bu gösterge, her günün ilk işlem saati içinde oluşan ilk emir bloğunu otomatik olarak tanımlar; bu alan stratejik karar alma için son derece önemlidir. Ana Özellikler Otomatik Tanımlama : 1sa mumuna dayalı olarak günün ilk emir bloğunun dikdörtgenini oto

Trigger Zone Elite EA – Gelişmiş Risk Yönetimi ile Dinamik Ticaret Trigger Zone Elite EA ile breakout ticaretinin gücünü açığa çıkarın – MetaTrader 5 için tamamen otomatik bir çözüm, disiplin, tutarlılık ve sermaye korumasını bir araya getirmek için tasarlandı. Bu EA, belirlenen dönemin en yüksek ve en düşük seviyelerindeki breakout noktalarını tespit eder, güçlü trend filtreleri uygular ve her işlemi özelleştirilebilir uyarlanabilir trailing stop ve gelişmiş risk yönetimi araçları ile yönetir.

Pin Bar Pro v1.0 – MQL5 Göstergesi Açıklama:
Pin Bar Pro, MetaTrader 5 için profesyonel bir göstergedir ve Pin Bar mumlarını otomatik olarak tespit eder, piyasadaki dönüşleri öngörmenize yardımcı olur. Mavi ok → Alış sinyali Kırmızı ok → Satış sinyali Özellikler: Pin Bar otomatik tespiti Özelleştirilebilir oklar ( Arrow_Up_Code , Arrow_Down_Code ) Dikey offset ayarı ( Arrow_Offset_Pts ) Tüm semboller ve zaman dilimlerinde çalışır Parametreler: Parametre Açıklama Varsayılan Arrow_Up_Code Alış ok

Sermaye koruması öncelikli, kâr da hedefleniyor Bu EA, sermaye korumasını en yüksek öncelik olarak tasarlanmıştır ve backtestlerde yıllık ortalama +%24,5 büyüme sağlamıştır (koşullara bağlı olarak).
Range tespiti dâhil dört sağlam filtre sayesinde, ayda yalnızca 0–birkaç adet özenle seçilmiş işlem üretir.
Uzun vadeli istikrarı garanti eder ve günlük kâr hedefine ulaşıldığında veya düşük hacimli piyasa dönemlerinde otomatik olarak **“Ultra-Sağlam Mod”**a geçerek gereksiz işlemlerden kaçınır.
Bu

An advanced Expert Advisor powered by artificial intelligence and machine learning, specifically designed for analyzing FOREX . It adapts to price movements and market fluctuations to detect potential trading opportunities. Contact me if you need the settings file, have any questions, or need any assistance. Artificial Intelligence Integration: At the heart of this EA les a sophisticated AI engine capable of recognizing complex patterns in FOREX price data. The system continuously processes

Historical Info Önemli işlem bilgilerini doğrudan grafiğinizde görüntülemek için basit, ücretsiz bir yardımcı program. Bu hafif araç, performansınızı bir bakışta takip etmenize yardımcı olur. Özellikler: Mevcut Açık İşlemler: Tüm aktif pozisyonlarınızın özetini anında görüntüleyin. Son İşlem Geçmişi: Son 30 gün içinden seçilen bir döneme ait kapatılmış işlemlerinizi analiz edin. Düzenli Veri Gösterimi: Geçmiş veriler, incelemek için seçtiğiniz günün (veya günlerin) başlangıcından itibaren düzenl
FREE

The AlgoCore MT5 Expert Advisor is a straightforward trading system developed for XAUUSD on the MetaTrader 5 platform. It applies a trend based methodology with additional filters to manage risk and adapt to market conditions. The system is designed with simplicity in mind, avoiding unnecessary complexity. AlgoCore Settings Currency Pair: XAUUSD Timeframe: M15 Recommended Balance: 500 USD minimum Recommended Lot Size: 0.01 (adjustable) Customizable Parameters Magic Number – unique ID for AlgoCor
FREE
FVG Auto Master, ünlü Inner Circle Trader (ICT) metodolojisine dayanan sofistike bir otomatik trading sistemidir. Bu Expert Advisor, Fair Value Gap'leri (FVG) otomatik olarak tanımlar ve işlem yapar - fiyat bu boşlukları doldurmak için geri döndüğünde yüksek olasılıklı trading fırsatları yaratan kurumsal fiyat dengesizlikleridir. Ana Özellikler Gelişmiş Fair Value Gap Tespiti Birden fazla zaman diliminde boğa ve ayı Fair Value Gap'lerini otomatik olarak tanımlar Hassas gap ölçümü ve doğrulam

Türkçe – Canal H Pro Adı: Canal H Pro – Destek, Direnç ve Breakout Kısa Açıklama:
Premium gösterge, üç dinamik çizgi (yüksek, düşük, orta) ve kırılmalarda otomatik BUY/SELL okları ile. Breakout, Range ve trend takip stratejileri için ideal. Ayrıntılı Açıklama: Kırmızı (Yüksek) → dinamik direnç Mavi (Düşük) → dinamik destek Sarı (Orta) → denge ve trend filtresi Grafik üzerinde otomatik BUY/SELL sinyalleri Periyot ve renkler özelleştirilebilir Tüm stratejiler ve zaman dilimleri ile uyumlu Cana

TÜRKÇE – Monthly Levels Pro v1.0 En İyi Aylık Piyasa Seviyeleri Göstergesi Önemli piyasa bölgelerini anında takip edin. Monthly Levels Pro , uzun vadeli trendleri analiz etmenize ve aylık mumun High, Low, Open ve Close seviyelerini otomatik göstererek kritik destek ve direnç noktalarını hızlıca görmenizi sağlar. Avantajlar:
Anında analiz
Akıllı trading
Net görselleştirme
Esnek kullanım
Basit ve etkili Uyumluluk: MT5, tüm zaman dilimleri

Kısa Açıklama Arızalardan sonra gelişmiş kurtarma sistemi ile iki seviyeli strateji kullanan ticaret danışmanı. DualForce Recovery, iki sabit fiyat seviyesi arasında progresif sermaye yönetimi ve otomatik ticaret bağlamı kurtarma ile ticaret yapma prensibi üzerine çalışır. Ana Özellikler İki Seviyeli Ticaret Sistemi İki sabit fiyat seviyesi arasında ticaret BUY ve SELL pozisyonları arasında geçiş Matematiksel formüle göre pozisyon boyutlarının progresif artışı Bekleyen emirlerin akıllı yönetimi

BUY INDICATOR AND GET NEW EXCLUSIVE EA FOR FREE AS A BONUS! ITALO ARROWS INDICATOR is the best reversal indicator ever created, and why is that? Using extreme reversal zones on the market to show the arrows and Fibonacci numbers for the Take Profit, also with a panel showing all the information about the signals on the chart, the Indicator works on all time-frames and assets, indicator built after 8 years of experience on forex and many other markets. You know many reversal indicators around t

The Golden PainX and GainX Spike Indicator is a cutting-edge, AI-powered trading tool engineered exclusively for the synthetic indices market. It masterfully combines proprietary spike detection algorithms and real-time price action analysis to generate high-probability, non-repainting trade signals with exceptional accuracy. Important( Use only on PainX 400and GainX 400 (M1 one minute timeframe) Identifies high-probability spikes with non-repainting buy/sell arrows. Automatically sets profit t

One Click Trading – Auto TP SL Developer TraderLinkz
Version 1.00
Category Utility What it does Adds missing TP and SL to your manual trades and pending orders
Sets them once per ticket
Lets you move TP and SL afterward
Works on hedging and netting accounts Scans on every tick and reacts on trade events Why you want it You place faster entries
You get consistent risk and exit targets
You reduce fat finger errors
You keep full manual control Quick start Attach the EA to any chart Keep TP and SL e
FREE

Trend Battle Indicator
Overview The Trend Battle Indicator is a professional technical analysis tool that reveals the battle between buyers (Bulls) and sellers (Bears) in the market through a comprehensive dashboard. Using an intuitive visual interface, the indicator offers a unique perspective on market power dynamics by analyzing the last twenty bars to provide precise insights into momentum and directional strength. Additionally, the panel provides automatic real-time updates for bars in for

Golden Zone OB Lock & Trail MT5 Golden Zone OB Lock & Trail MT5 is a proprietary Expert Advisor by William Kaumba Daka that trades from mapped order-block (OB) zones using a three-line trap— TOP , MED , and BOT —and then protects with a dynamic BE → lock → trail stack. OB bands are derived from swing structure with ATR-scaled offsets so the system adapts as volatility breathes. Core trade logic The engine maps internal/swing OB snapshots into a compact SMC model (bias + top/median/bottom), dete

GW News Filter Filter trading around high-impact news. Avoid entries/exits during risky time windows using MetaTrader’s Calendar API or your own CSV files. Works in live, demo and Strategy Tester · Source: API or CSV · Per-currency files · Entry/Exit flags · Diagnostics (0–4)
Features
Works in real accounts, demo, and Strategy Tester Choose between: 0 = Auto (API for live/demo, CSV for Strategy Tester) 1 = API (MetaTrader’s built-in calendar) 2 = CSV (per-currency files, e.g. EUR.csv, USD.csv,
FREE

The OCOBreakEven order is a simple EA that, upon identifying a buy/sell order, whether sent to the market or limit, sends the take and stop orders you define in the settings and also uses the breakeven to protect the trade.
This version does not have a trailing stop and does not calculate the average price to combine orders.
If you are interested, please contact us so we can add additional features.

Automatic calculation of lot size for the specified risk and order placement. A simple and concise interface, optimized for fast operation and taking up very little workspace in the instrument window. YouTube guide: https://www.youtube.com/watch?v=9aBKakAMdts
IMPORTANT: When installing Position Wizard, don’t forget to allow algorithmic trading in your terminal! Risk can be set as: An absolute value in dollars (deposit currency) A percentage of the deposit Supported order types: Market (Sell &

Introducing the "Fibonacci Retracement EA": A free, educational tool designed for new and aspiring traders. This Expert Advisor helps you understand a classic trading strategy by visually demonstrating its logic directly on your chart. It is based on a simple yet effective trend-following strategy. It uses the "EMA200" as a filter to determine the main trend (uptrend or downtrend). It then waits for the price to retrace to a specific "Fibonacci level" (default is 61.8%) before opening an order.
FREE
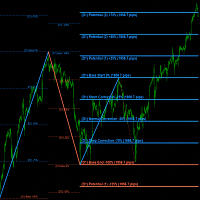
"Impulses and Corrections 5" is created to help traders navigate the market situation. The indicator shows multi-time frame upward and downward "Impulses" of price movements. These impulses are the basis for determining the "Base" , which is composed of zones of "Corrections" of price movements, as well as "Potential" zones for possible scenarios of price movement.
Up and down impulses are determined based on a modified formula of Bill Williams' "Fractals" indicator. The last impulse is always

Introducing the Elite Chart Navigator — your ultimate MetaTrader 5 Expert Advisor designed to revolutionize multi-symbol trading with seamless chart navigation and superior usability. Product Overview The Elite Chart Navigator EA is a sophisticated trading utility enabling rapid switching between multiple trading pairs through an intuitive on-chart button interface. Built for professional traders managing numerous instruments, this EA dramatically improves workflow efficiency, ensuring

This indicator is specifically designed for boom 1000 index. The indicator contains optimised trend filters to target buy spikes in an uptrend. The indicator also add a grid buy signal to recover some loss of the first buy signal. The indicator also provides exit signals for delayed spikes which can help with risk management .Also it analyses signals for historical data and displays percentage of good signals provided by the indicator. KEY FEATURES Non-lagging indicator. Non-repaint. Enable/d
FREE

Asia Trading Titans Asia Trading Titans bundles two independent execution engines into one MT5 Expert Advisor: an adaptive trend-pullback engine and a controlled reversal engine . Each engine runs and sizes trades independently (separate execution IDs, position controls and money-management) so you can use either engine alone or both together without cross-interference. Live signal & set files Live Signals: https://www.mql5.com/en/signals/2331149?source=Site+Signals+My Set files / custom tuni

Telegram Alert With Emoji Description and User Manual
EA Description Purpose:The Telegram Alert With Emoji sends real-time trading notifications to a Telegram chat or group for all trading activities in MT5, including new Positions (BUY/SELL), Pending Orders (BUY LIMIT, SELL LIMIT, BUY STOP, SELL STOP), Stop Loss/Take Profit (SL/TP) triggers, and closed Positions with profit/loss details. It includes a Rainbow Display on the chart and uses Global Variables to prevent duplicate notifications. [
FREE

This Expert Advisor is designed around a Trend Following strategy combined with Market Structure analysis to identify and follow reliable price movements. It avoids short-term noise and focuses on aligning trades with the broader market direction.
Trading Logic: The EA analyzes price structure and trend conditions to determine optimal entry and exit points. It is built to follow market momentum rather than predict sudden reversals. Risk Management: Equipped with a robust risk management system,

Zahav AI Trade: Transform the Gold Market into Your Cash-Flow Business The Zahav AI Trade is an intelligently designed automated trading system (Expert Advisor) built to generate returns from the volatility of the gold market (XAUUSD). It shifts the mindset from "occasional speculative trading" to "managing an investment portfolio like a business," with a core focus on creating a consistent stream of cash flow. Are you tired of simple EAs that perform well in trends but collapse during market c

ZPOWER BUY & SELL INDICATOR
Trade Smarter. Trade Confidently. Trade Profitably.
Are you tired of second-guessing your trades? Do you enter late and exit too early — leaving money on the table? It’s time to upgrade your strategy with the ZPOWER BUY & SELL INDICATOR, built with institutional-grade logic that helps you catch high-probability trade setups with precision.
Why ZPOWER is Different
Unlike ordinary indicators that flood your charts with noise, ZPOWER is engineered with advanced
FREE

Fund Trading Ultimate MT5 - Expert Advisor Elevate your trading experience with Fund Trading Ultimate MT5 !
A powerful Expert Advisor designed for traders of all levels
Optimized for MetaTrader 5 , combining efficient strategies with robust risk management Usage Details Main Currency Pair : EUR/USD or USD/JPY ️ Timeframe : M15 Starting Lot Size : 0.01 (for $200 capital) | 0.05 (for $1,000 capital) Prop Firm Compatible : Proven performance on Prop Firm accounts Recommende
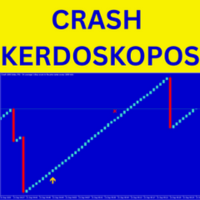
Crash Kerdoskopos Indicator – Buy Without Fear The Crash Kerdoskopos Indicator is the ultimate tool for scalping Crash markets on the M1 timeframe . Designed with precision entry and exit rules, it allows you to buy with confidence and capture 8–10 safe candles without being caught by spikes. With yellow up arrows for entry and a red cross for exit , the indicator removes all guesswork. You’ll also receive audible alerts, push notifications, and email signals so you never miss a profitable op

GoldRushTrader EA – Trade Smart Money Concepts Automatically on MT5
GoldRushTrader EA is a fully automated trading system built on Smart Money Concepts (SMC) .
It combines institutional trading logic with advanced market scanning to generate and manage trades automatically. Key Features: SMC Trading Engine – Detects liquidity grabs, order blocks, and structure breaks. Automated Execution – Places and manages trades directly without manual input. Multi-Symbol Capability – Monitor and trade up t

PropScalpX EA - Professional Prop Firm Challenge Solver Pass Prop Firm Challenges with Confidence
only 1 copy at 99 usd, next price 199 usd PropScalpX is a sophisticated scalping EA specifically engineered to pass prop firm challenges and maintain funded accounts. Successfully tested with major prop firms including FTMO, 5%ers, and compatible with virtually any prop firm's rules. Core Strategy Intelligent Breakout Scalping : Identifies key support/resistance levels using advanced price act
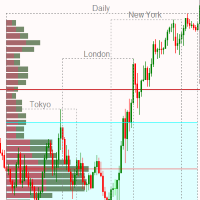
Market Session and Volume Profile Indicator A Professional Trading Tool for Advanced Market Analysis This sophisticated indicator combines Market Session Analysis with Volume Profile Technology to provide traders with critical market structure insights. Volume Profile is one of the most powerful analytical tools used by institutional traders and market makers to identify key price levels where significant trading activity occurs. Key Features: Volume Profile Analysis: POC (Point of Control) - I
English – Product Description (V1.42) SMC Workflow Auto EA — SR / OB / FVG with BOS–CHOCH Confirmation Smart-Money-Concepts Expert Advisor that trades only when a clean SMC setup appears: Order-Block retest after Break of Structure (BOS / CHOCH) confirmation, with optional SR and Fair Value Gap (FVG) confluence. The EA uses pending limit orders, fixed SL/TP or RR-based exits, step-lock trailing and strict risk-controls designed to pass broker validation. What it does Detects swing structure usi
FREE
What is the Chart Sync Indicator? This custom MQL5 tool enables multi-timeframe chart synchronization, addressing a common pain point in technical analysis: the inconsistencies when switching between chart windows or timeframes. Instead of managing each chart separately, this indicator links them so actions such as panning, zooming, drawing objects, or changing symbols are mirrored across all synced charts of the same symbol. The result is a smoother, unified analysis experience. Key Advantages:
FREE

The Smart FVG Statistics Indicator is a powerful MetaTrader 5 tool designed to automatically identify, track, and analyze Fair Value Gaps (FVGs) on your charts. Love it? Hate it? Let me know in a review! Feature requests and ideas for new tools are highly appreciated. :)
Try "The AUDCAD Trader":
https://www.mql5.com/en/market/product/151841
Key Features Advanced Fair Value Gap Detection Automatic Identification : Automatically scans for both bullish and bearish FVGs across specified histo
FREE

Trading assistant NewsRForestExpert v4.01 Purpose and principle of operation NewsRForestExpert is a trading assistant for MetaTrader 5, using the built-in economic calendar
and the machine learning model "Random Forest" of the ALGLIB library (hereinafter simply "model"). The assistant: in this version works only on the EURUSD currency pair timeframes M1 – M5; loads news history for the selected period and forms training and test samples; trains on the obtained data or loads an already trained
FREE

Unleash the power of portfolio trading with the Maka Maka Multi EA. This advanced Expert Advisor is designed to trade multiple currency pairs simultaneously from a single chart, diversifying your approach and capturing more opportunities across the market. Using a proven combination of classic indicators, the Maka Maka Multi EA identifies high-probability entry points and manages all trades with a sophisticated, automated system designed for steady growth Instead of relying on a single instrume
FREE

Live Signal (Real Account Forward) Colorful Long-tailed Tit is an Expert Advisor designed with a simple yet reliable trading logic.
It applies Gann HiLo for trend detection, uses the Bollinger Band range for entry conditions, and employs ATR-based dynamic risk management to control trades effectively. A key feature of this EA is its versatility to run on EURUSD, GBPUSD, and USDJPY with the exact same logic and parameters—no separate set files required. This makes it highly convenient for mult

Daily PnL Guard (MT5) — Profit Smasher Stop blowing your day. Start trading with discipline.
Daily PnL Guard is a clean on-chart HUD that gives you instant clarity on your trading session. It answers the only question that matters: Can I keep trading right now? This tool isn’t about signals. It’s about discipline . By tracking your current profit/loss against your starting balance and comparing it to your Daily Max Loss and Profit Target , Daily PnL Guard keeps you in check before the market do

RiskManagerOptimum for MetaTrader 5 – Your Ultimate Trading Safety Net!
RiskManagerOptimum is the most advanced and professional trade and account risk management Expert Advisor for MetaTrader 5.
It does not open trades. It monitors and manages existing positions in real time to control risk, drawdown, and exposure across all symbols. The EA is designed for manual traders, algorithmic traders, and portfolio traders who require strict and automated risk control across Forex, metals, crypto, indi

MAX XAUUSD – The Intelligent Trading System for the Gold Market Dear Traders,
I am MAX XAUUSD , the latest member of the trend-following intelligent trading system family, designed for exceptional performance. My specialty? Gold . That’s right, I trade the Gold/USD pair with precision and confidence, offering unparalleled trading opportunities in the shining gold market. Why Choose MAX XAUUSD? Intelligent Trend-Following System Utilizes advanced trend-following algorithms to minim

Trend Signals TP SL UAlgo
This professional trading indicator combines two T3 moving averages with automated take profit and stop loss calculations to provide accurate trend signals and comprehensive risk management on MetaTrader 5.
Main Algorithm
The indicator uses two independently configurable T3 (Triple Exponential Moving Average) calculations with customizable periods and hot values. The T3 algorithm offers superior smoothing compared to traditional moving averages while maintaining res

Fox Wave PSAR – PSAR Dashboard for Multiple Symbols and Timeframes Description:
Fox Wave PSAR is a powerful indicator for MetaTrader 5 that allows you to monitor the Parabolic SAR (PSAR) across multiple symbols and timeframes directly in a clear and convenient dashboard. It is ideal for scalping, intraday, and long-term trading strategies. Key Features: Clear dashboard with a list of symbols and their current PSAR status. Supports any number of symbols and customizable suffixes (e.g., ".m"). Di

MultiTimeframe Trend Pro shows you the market direction across 7 timeframes at a glance. Clear colors, no repainting, fully customizable. Perfect as a quick filter for any intraday or swing strategy.
Key Features Supports M1, M5, M15, H1, H4, D1 and W1
Colors MediumSeaGreen when the close is above the MA, and Red when below
No repainting → always based on the last closed candle for each timeframe
Fully customizable: MA period (200 by default) font, size and colors X/Y offsets, spacing
FREE

User Policy For REX MT5 EA Rental Plans --- 1. REX MT5 Description:
REX MT5: Advanced Algorithmic Trading Solution for XAUUSD
Where Technical Precision Meets Effective Risk Management
· REX MT5 is a professionally designed Expert Advisor for automated trading on the XAUUSD (Gold) pair. It employs a multi-layer confirmation system to identify high-probability trading opportunities, with a core philosophy focused on capital preservation and sustainable growth.
Trading Strategy and Mechanism:

Systematic long-only engine that builds into strength. Adaptive step (ATR/points/percent), add-only-in-profit pyramiding, near-entry TPs for frequent skims, and a basket trail to secure runs. Includes spread/time filters, RSI gate, volatility brake, margin/exposure guards, and auto-fix for missing TPs. What it does Opens first long when spread ok, inside trading window, RSI not overbought Adds only above highest entry, step scales with volatility or fixed rules Each layer gets a small, near-ent

AP DayTrader Impulse Box (MT5) What it does Intraday engine that combines a session “box” range (M5) with an impulse filter (EMA/RSI on M15). When price escapes the box with momentum confirmation, the EA places a single market order in that direction. Simple logic, few knobs Box + impulse confirmation No martingale, no grid, no averaging Works on netting accounts How entries are decided Build a time-window “box” from recent session hours (start/end inputs). Wait for price to escape the box by

THE ADVANCE PRICE PREDICTOR - GURU EDITION Tired of Guesswork?
Meet the AI-Powered "Almighty Predictor" – Pinpoints High-Probability Targets Before the Move, With Surgical Precision
Stop chasing pips. Start attracting them. Our proprietary algorithm fuses Multi-Timeframe Analysis + Smart Money Concepts + Real-Time Confluence Scoring to give you a clear, calculated edge on every trade.
Are You Constantly Wondering…
"Is this the top, or will it keep going?"
"Where should I real
FREE

**MA Distance Filter: Your Smart Trading Ally!** Discover the **MA Distance Filter**, a powerful MetaTrader 5 indicator designed to elevate your trading strategy! Easily spot precise **buy** and **sell** opportunities based on moving average crossovers and minimum distance thresholds.
**What it offers:** - **Striking visual signals**: Green arrows for buy and red for sell, displayed live on the latest candle. - **Dynamic moving averages**: Track the fast, slow, and optionally a third
FREE

Heiken Scalper EA Overview Heiken Scalper EA is a sophisticated Expert Advisor for MetaTrader 5, designed exclusively for trading XAUUSD (Gold) and its variants on low timeframes (M1–M15). This EA combines a custom Heiken Ashi indicator with a grid martingale scalping strategy to capitalize on short-term price movements. Optimized for fast-paced trading, it includes robust risk management, a news filter, and an interactive dashboard, making it ideal for traders seeking efficient gold market str
FREE

This EA is a trend-following expert advisor specifically designed for EURUSD, verified through 15 years of historical data, demonstrating exceptional stability and profitability. The EA adheres to the principles of 'one order one close, strict risk control', providing investors with a reliable and stable asset appreciation solution. Technical Features Platform: MetaTrader 5 Account Type: Suitable for any broker, best on ECN or Raw accounts Trading Instrument: EURUSD Time Frame: M10 Minimum Capit
The Absorption & Exhaustion Detector Professional indicator is a sophisticated volume analysis tool designed to identify critical market turning points by analyzing the relationship between price movement and cumulative volume delta (CVD). This indicator helps traders spot when price movements lack volume confirmation, indicating potential absorption or exhaustion zones. KEY FEATURES Real-time Cumulative Volume Delta (CVD) calculation and normalization Price-volume divergence gap measurement dis

Early-bird pricing! Discounted price for October from $300 to $150 for this month only
If you’ve ever wished your money could grow steadily every month instead of sitting still, this might interest you. From August 2024 to August 2025 , we traded gold with a moderate lot size and achieved a 66% return in just 12 months . That works out to about 5–6% growth per month on average — steady, consistent, and low stress. This approach is designed for people who want reliable monthly returns without t

Gold SR Breakout ATR MT5
Breakout Expert Advisor for XAUUSD (Gold) on M1 that trades Donchian Support/Resistance on closed candles and sizes positions by ATR-based risk % . It includes an optional EMA trend filter , volatility/spread guardrails , and smart management ( Break-Even by R , optional ATR trailing threshold , and a TP ratchet that locks progress). An independent Asian Range breakout (OCO) module is provided with its own MAGIC so both engines can run in parallel without conflicts. Rec

PriceZoneAlert V3 - Product Description
Main Description
PriceZoneAlert V3 is the most advanced trading tool for monitoring critical price levels with smart, customized alerts, delivered directly to your phone or tablet. This revolutionary version for MetaTrader 5 allows you to configure alerts on both support/resistance levels and price zones, with instant push notifications to stay informed in real time, wherever you are.
Whether you're trading according to SMC concepts, support/r

SRA (Support & Resistance Adaptive) Trade with Conviction, Not Guesswork Support & Resistance Adaptive is a professional-grade analytical engine for MetaTrader 5, designed to cut through market noise and automatically pinpoint the most statistically robust support and resistance levels. Move Beyond Basic Indicators: Forget outdated, single-method tools that litter your chart with irrelevant lines. Our indicator employs an advanced multi-source confluence engine , synthesizing data from four dis
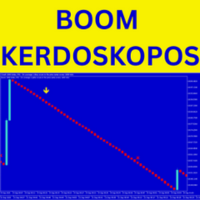
Boom Kerdoskopos Indicator – Sell With Confidence The Boom Kerdoskopos Indicator is a scalper’s dream for Boom markets on M1 timeframe . Built to protect you from spikes, it gives precise yellow down arrows for sell entries and red cross exit signals so you always know when to enter and leave the trade. With smart alerts (audible, push, email), you can trade stress-free and secure 8–10 safe candles every time. It’s perfect for scalpers who want fast, consistent profits. Why Traders Choose

Liquidity Seeker EA
Why You MUST Have This EA Unlock the power of ICT (Inner Circle Trader) methodology with the most advanced Smart Money Concept trading system available. This EA transforms complex institutional trading concepts into automated precision, giving you the unfair advantage that professional traders use to consistently profit from liquidity manipulation and market structure shifts. START trading WITH market makers using their own playbook. You don't need to do much other than to
FREE

TurnPoint Indicator – Market Reversal & Trend Signal Tool The TurnPoint Indicator is designed to help traders identify potential turning points and key levels in the market. By analyzing price action, it highlights areas where reversals or continuations are likely to occur, allowing traders to anticipate trend changes more effectively. This tool incorporates advanced logic to filter signals, reducing noise and false alerts. Users can choose between breakout and pullback modes, depending on their
FREE
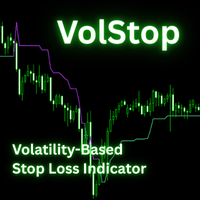
The VolStop Adaptive Volatility-Based Trailing Stop Indicator for MT5 VolStop is a precision volatility-stop indicator for MetaTrader 5, built for traders who want to stay in winning trades longer and exit with discipline. Instead of fixed pips or moving averages, VolStop dynamically tracks price action with ATR-based bands, automatically adapting to market turbulence. Key Features Adaptive Volatility Stops – Calculates a dynamic trailing stop using ATR and a user-set multiplier to match changi
FREE

Overview Magic 7 Indicator is a comprehensive MetaTrader 5 (MQL5) indicator that identifies seven different trading scenarios based on candlestick patterns and technical analysis. The indicator combines traditional price action patterns with modern concepts like Fair Value Gaps (FVG) to provide trading signals with precise entry points and stop loss levels. Features 7 Trading Scenarios : Each scenario identifies specific market conditions and trading opportunities Visual Signals : Clear buy/sell
FREE

EA Close All Set TPSL All Panel EA Close All Set TPSL All MT5 is a professional utility tool for MetaTrader 5 that helps traders manage orders quickly and efficiently.
With a clean on-chart control panel, you can close trades or set Take Profit / Stop Loss levels for all orders with just one click. [MT4 Version ---> click . ]
Key Features On-Chart Control Panel – Light gray background with simple and intuitive design. Close All Orders – Instantly close all active Buy, Sell, and
FREE

Hedging Grid EA – Adaptive Multi-Strategy Trading System Hedging Grid EA is a fully automated Expert Advisor designed for traders who want robust grid trading with dynamic hedging, adaptive lot sizing, and multiple protection mechanisms .
Built with flexibility and precision, it can be optimized for both aggressive growth and conservative risk-managed performance , making it suitable for a wide range of trading styles. Key Features Order Management Buy & Sell Modes – enable/disable Buy or Sell
MetaTrader mağazası - yatırımcılar için alım-satım robotları ve teknik göstergeler doğrudan işlem terminalinde mevcuttur.
MQL5.community ödeme sistemi, MetaTrader hizmetlerindeki işlemler için MQL5.com sitesinin tüm kayıtlı kullanıcıları tarafından kullanılabilir. WebMoney, PayPal veya banka kartı kullanarak para yatırabilir ve çekebilirsiniz.
Alım-satım fırsatlarını kaçırıyorsunuz:
- Ücretsiz alım-satım uygulamaları
- İşlem kopyalama için 8.000'den fazla sinyal
- Finansal piyasaları keşfetmek için ekonomik haberler
Kayıt
Giriş yap
Gizlilik ve Veri Koruma Politikasını ve MQL5.com Kullanım Şartlarını kabul edersiniz
Hesabınız yoksa, lütfen kaydolun
MQL5.com web sitesine giriş yapmak için çerezlerin kullanımına izin vermelisiniz.
Lütfen tarayıcınızda gerekli ayarı etkinleştirin, aksi takdirde giriş yapamazsınız.