YouTube'dan Mağaza ile ilgili eğitici videoları izleyin
Bir alım-satım robotu veya gösterge nasıl satın alınır?
Uzman Danışmanınızı
sanal sunucuda çalıştırın
sanal sunucuda çalıştırın
Satın almadan önce göstergeyi/alım-satım robotunu test edin
Mağazada kazanç sağlamak ister misiniz?
Satış için bir ürün nasıl sunulur?
MetaTrader 5 için yeni teknik göstergeler - 40
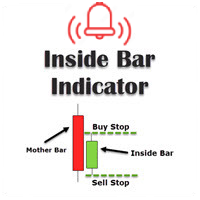
This inside bar indicator MT5 is suitable if you are doing inside bar trading. So what this MT5 inside bar indicator does is identifies inside bars for you as they form on your charts. Inside bar is a famous trading pattern in which the bar carry higher low and lower high compared with the previous bar, also known as mother bar. With, a lesser time frame like the 1 hour chart, daily inside bar chart will sometimes appears to be similar to a triangle pattern.
Inputs Settings for MA; AlertOn
FREE

Multi-Level Correlation Analysis of Currencies, Cryptocurrencies, Indices, and Stocks Discover hidden relationships between assets and make data-driven decisions using advanced correlation analysis. "Interaction and Correlation Indicator" is a professional trading tool designed for deep analysis of interdependencies across Forex, cryptocurrencies, indices, and stocks. The indicator calculates the dynamics between fast and slow moving averages (MA) for selected currency pairs, cross rates, and in
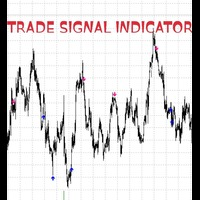
BUY & SELL ARROW INDICATOR - Professional Trading Signals! CRYSTAL CLEAR TRADING SIGNALS WITH PRECISION ACCURACY. WORKS ON ALL TIME FRAME, BEST ON 1HR TIME FRAME WHAT MAKES THIS INDICATOR REVOLUTIONARY? NO REPAINTING - NO GUESSWORK - NO REGRETS! 100% ACCURATE SIGNALS that never change or disappear ZERO OFFSET - Signals appear exactly when they should PERFECT PRECISION. INSTANT VISUAL CLARITY CRYSTAL CLEAR BLUE ARROWS for BUY signals STRIKING PINK ARROWS for SELL signals CLEAN CHART INTERF

This is a powerful indicator that groups multiple Expert Advisors (EAs) by strategy and displays aggregated performance results directly on the chart. Grouping is optional — you can use it even without organizing EAs into groups. It automatically calculates and visualizes performance within a specified aggregation period. You can exclude specific magic numbers or aggregate results across multiple magic numbers as a group. Additionally, by using partial string matching based on EA names, you can
Build your professional trading suite for less: I believe in providing high-quality tools for the community. If you find value in this free indicator, please consider leaving a 5-star review to support my work. You can also explore my full catalog of professional EAs and specialized indicators on my profile to find the perfect 'trigger' for your strategy.
What is this indicator? This Basic Support and Resistance Indicator -Free- is designed to help traders automatically identify key market
FREE
https://www.mql5.com/en/users/gedeegi/seller
GEN FXTrendZones GEN FXTrendZones is a technical analysis indicator designed to identify key price zones using Fibonacci retracement and extension levels, while also detecting market structure changes such as Break of Structure (BoS) and Change of Character (CHoCH). The indicator helps traders visualize critical swing areas and potential trend continuation or reversal zones. It includes a visual info panel and optional price alert system.
FREE

https://www.mql5.com/en/users/gedeegi/seller
GEN (Trend Fib Zones) GEN (Trend Fib Zones) is a professional technical analysis indicator that automatically detects trend structure shifts using swing highs/lows and dynamically plots key Fibonacci retracement and extension zones. Key Features: Automatic Trend Structure Detection Identifies market structure changes using CHoCH (Change of Character) and BOS (Break of Structure) logic. Highlights trend direction based on real swing high/low pivo
FREE
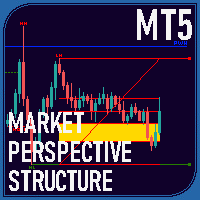
Overview The Market Perspective Structure Indicator is a comprehensive MetaTrader indicator designed to provide traders with a detailed analysis of market structure across multiple timeframes. It identifies and visualizes key price action elements, including swing highs and lows, Break of Structure (BOS), Change of Character (CHOCH), internal structures, equal highs/lows, premium/discount levels, previous levels from higher timeframes, and trading session zones. With extensive customization opt

Торговая панель с основной необходимой информацией на графике. Панель отображает: - Баланс и свободные средства - Маржу - Количество ордеров на продажу и их общий объем (по той паре на которой установлен) - Количество ордеров на покупку и их общий объем (по той паре на которой установлен ) - Количество отложенных ордеров и их направление (по той паре на которой установлен ) - Просадка в % и в деньгах на текущий момент - Расчет % стопа при указании лота и размер стопа в пунктах - Оповещения при с
FREE
Engulfing Zone Sniper MT5 — Multi-Timeframe Signal & Zone Indicator The Engulfing Zone Sniper MT5 is a technical analysis tool designed to highlight engulfing candlestick patterns in combination with adaptive support/resistance zones. It provides visual markers and optional alerts to assist traders in identifying market structure reactions across multiple timeframes. Key Features Multi-Timeframe Detection – Option to scan higher timeframe engulfing setups with lower timeframe confirmation. Su
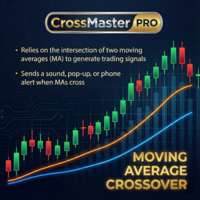
CrossMaster PRO – Where Trends Reveal Themselves CrossMaster PRO is a precision-built indicator designed to identify critical moments where market direction begins to shift. By monitoring the interaction between two moving averages, it delivers clear signals exactly when timing matters most. Built for traders who value clarity over noise, this tool transforms simple crossovers into actionable insights, supported by intelligent alerts and a clean visual structure. Core Advantages Real-time detec
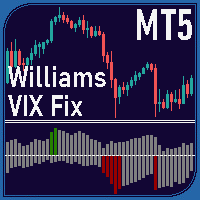
Overview The Williams VIX Fix Indicator is a MetaTrader 5 tool designed to help traders identify potential market tops and bottoms. By analyzing price extremes relative to recent highs and lows, it highlights overbought and oversold conditions using two histograms displayed in a separate window. The indicator combines the Williams VIX Fix calculation with Bollinger Bands and percentile-based thresholds to provide clear signals for potential reversals. Key Features Market Tops and Bottoms Market

True Volume: See the Story Behind the Price
Recommended Experience Level: Intermediate to Advanced True Volume is not just another histogram; it is a forensic analysis engine for price action. While standard volume indicators only tell you how much was traded, True Volume tells you who traded it and who won . By combining Geometric Decomposition , VSA (Volume Spread Analysis) , and Anomaly Detection , this indicator dissects every bar to reveal the hidden battle between Bulls
Dynamic Multi-Period S/R Indicator The Dynamic Multi-Period S/R is an advanced MetaTrader 5 indicator designed to automatically identify and display key Support and Resistance (S/R) levels across multiple timeframes directly on your chart. Unlike static indicators, this tool dynamically adjusts, providing you with relevant and up-to-date S/R zones from Hourly (H1), Daily (D1), and Weekly (W1) charts. This indicator goes beyond simple high/low analysis by incorporating Fractal patterns to refine

INDICATOR: GEN Smart Zone Developer: gedeegi General Description GEN Smart Zone is a MetaTrader 5 (MT5) indicator designed to automatically identify and visualize strong Support and Resistance (S/R) levels . It analyzes price movements on a higher timeframe to find significant S/R zones and then projects them onto the current chart. Its purpose is to provide traders with clear visual guidance on key areas that can be used for decision-making. Key Features Automatic S/R Zone Identification: The i

OBMatrix Pro is a professional indicator that combines market structure detection (Break of Structure/BOS and Change of Character/CHoCH) with automated Order Block (OB) identification. Built for traders using Smart Money Concepts (SMC) , this tool helps visualize institutional price zones and structural shifts directly on your chart. Key Features: Automatically detects BOS (Break of Structure) and CHoCH (Change of Character) Marks swing points: HH, LL, HL, LH Plots Bullish and Bearish O
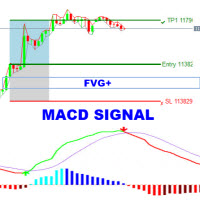
The MACD-FVG Signal System is a hybrid trading indicator that combines the power of momentum analysis through the MACD (Moving Average Convergence Divergence) with the precision of Fair Value Gap (FVG) detection to generate high-probability buy and sell signals. This indicator enhances traditional MACD signals by validating momentum shifts with market inefficiencies, offering traders a more refined entry strategy. Key Features: MACD with Histogram Display
Clearly visualizes the MACD line, Signa
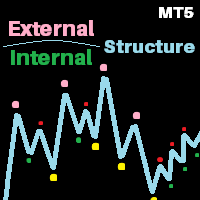
V2 of the Perfect structure.
What's Inherited from v1?
This is the finest structure marking you will ever find in any market. Indicator is coded considering the actual structure any trader would use. Indicator is coded based on actual candle breaks and not coded based on any pivot or predefined values or specific number of candles high and low. Please check out the screenshot. What's new in V2? AI based approach for High accuracy by calculating maximum bars with rapid switch algorithm. Dual tim

3 Trading Strategies to Exploit Market Structure (Without Overcomplicating It)
Trading isn’t about predicting the future—it’s about spotting patterns, managing risk, and acting when odds favor you. Below are two timeless strategies (and one hybrid) that align with how markets actually move, not how we wish they would. Some of the strategies you can trade with the indicator [ Note] Higher timeframe should be 15x of the lower timeframe, for eg. htf 15min, ltf 1min. 1. The Breakout Trap: Trad
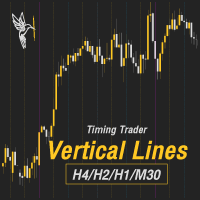
Trading hours, Market hours, Business hours, Forex trading hours, Trading schedule, Market open/close times, Trading time zones, Time zone indicators, Market clock, ICT, Asia KillZone, London Killzone, New York Killzone
**Prices tend to move and form every 2 - 4 hours.**
Traders should pay attention to the impact of trading time zones, as different market hours and trading volumes can directly affect the volatility and trading opportunities of a currency pair. To help traders understand the m

Trend Ai göstergesi, trend tanımlamasını işlem yapılabilir giriş noktaları ve geri dönüş uyarılarıyla birleştirerek bir yatırımcının piyasa analizini geliştirecek harika bir araçtır. Bu gösterge, kullanıcıların forex piyasasının karmaşıklıklarında güvenle ve hassasiyetle yol almalarını sağlar. Birincil sinyallerin ötesinde, Trend Ai göstergesi geri çekilmeler veya düzeltmeler sırasında ortaya çıkan ikincil giriş noktalarını belirleyerek, yatırımcıların belirlenen trend içindeki fiyat düzeltmele

Akıllı Otomatik Trend Çizgisi Göstergesi, MetaTrader 5 grafiğinizde otomatik olarak destek ve direnç trend çizgilerini çizer. İki yöntem kullanarak önemli fiyat seviyelerini belirler: İki Ekstrem (Tip 1) veya Ekstrem ve Delta (Tip 2). Trend çizgileri yalnızca yeni bir çubuk oluştuğunda güncellenir, böylece optimum performans sağlanır.
**Özellikler**
Çizgi kalınlığı, renkler ve ekstremum yan aralıkları için özelleştirilebilir parametreler.
Çizgiler, destek (pembe) ve direnç (mavi) olarak
FREE
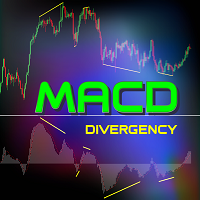
Bu gösterge, fiyat hareketleri ile MACD histogramı arasındaki yükseliş ve düşüş uyumsuzluklarını (divergence) doğru bir şekilde tespit eder. Kullanılan üssel hareketli ortalamalar (EMA) periyotları 5 (hızlı) ve 34 (yavaş), sinyal hattı periyodu ise 5’tir. Gösterge, momentumin zayıfladığı noktaları vurgulayarak muhtemel trend dönüşlerine işaret eder. Doğru uyumsuzluk tespiti kuralları Yükseliş uyumsuzluğu, fiyat daha düşük dipler oluştururken MACD histogramı sıfır çizgisinin üzerinde aynı anda da
FREE
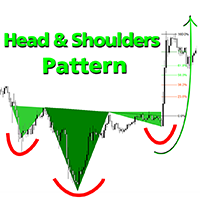
Hoş Geldin Fiyatı: 35 $ Baş ve Omuz Deseni , hem yükseliş hem de düşüş Baş ve Omuz formasyonlarını içeren güvenilir desen tanıma arayan traderlar için idealdir. Entegre Fibonacci seviyeleri, boyun çizgisi kırılım tespiti ve erken tahmin teknikleriyle donatılmıştır. Grafik yapılarını ve trend dönüşlerini belirlemede teknik analize ve hassasiyete önem verenler için güçlü bir MT5 aracıdır. Çift Tespit Yöntemi Yöntem 1 - Klasik Desen Tespiti
Tanımlanmış yapısal kurallar kullanarak standart Baş ve O
Introdução O Precision Spike Detector V2 é um indicador avançado para MetaTrader 5 (MT5) projetado para identificar potenciais picos de preço (movimentos bruscos de mercado) em índices sintéticos (DERIV: Boom, Crash; WELTRADE: GainX e PainX).
Ele combina análises de RSI (Índice de Força Relativa) e ATR (Amplitude Média Real) para fornecer sinais precisos e confiáveis. Funciona apenas no período M5 (5 minutos) . Em outros períodos, nenhuma seta será exibida. Principais características Filtro ba
Trader Dynamic Index_Pro Signal Added Geliştirilmiş Traders Dynamic Index (TDI) versiyonuna dayanan bu gösterge, bağlama duyarlı sinyal mantığı , çok katmanlı sinyal doğrulama yapısı ve frekans tabanlı döngü tespiti entegrasyonu ile hem manuel traderlar hem de Expert Advisor (EA) sistemleri için hassas bir çözüm sunar. I. Giriş Lütfen aşağıdaki ayrıntıları okumadan önce ekli görseli dikkatlice inceleyin ve bu göstergenin etkinliğini kendi gözlerinizle görün. Bu aracı mükemmelleştirmek için çok z

Hacim Tabanlı Destek ve Direnç Bölgeleri Volume-based Support and Resistance Zones , MetaTrader 5 için geliştirilmiş güçlü ve esnek bir göstergedir. Bu araç, fraktal zirve ve diplerdeki hacim artışlarını analiz ederek önemli piyasa seviyelerini belirlemenize yardımcı olur. Göstergemiz, fiyatın tepki verme olasılığının yüksek olduğu destek ve direnç bölgelerini otomatik olarak çizer. Böylece daha fazla güven ve netlikle işlem yapabilirsiniz.
Temel Özellikler Hacim tabanlı mantık : Bölgeler, yüks
FREE
ICONIC SMC Göstergesi — Kurumsal Düzeyde Netlikle İşlem Yapın Nihayet, manuel zahmet olmadan nesnel SMC . Grafikleri saatlerce işaretleyip girişinizi birkaç pip ile kaçırmaktan bıktınız mı? Gerçek para söz konusu olduğunda okumanızdan şüphe mi ediyorsunuz? Öznel ve zaman yiyen SMC devri bitti. ICONIC SMC Göstergesi “bir araç daha” değildir. Kurumsal seviyede bir analiz motorudur; Smart Money Concepts akışının tamamını otomatikleştirir ve grafiğinizi yüksek olasılıklı fırsatların canlı bir paneli
FREE

MarketCrack – Whale Detector: Akıllı Para ile Uyumlu Hareket Edin MarketCrack – Whale Detector , piyasanın büyük katılımcıları olan "balinaların" faaliyetlerini görsel ve önceden tespit etmek için tasarlanmış profesyonel bir göstergedir. Amacı, önemli kurumsal baskının kilit anlarını belirlemek, böylece yatırımcının akıllı paranın yönüyle uyumlu hareket etmesini ve daha güvenle stratejik kararlar almasını sağlamaktır. İşlevsellik ve Amaç MarketCrack – Whale Detector , kurumsal baskı modellerini

MetaTrader 5 için CycleTrackSwingPro ️ LÜTFEN AŞAĞIDAKİ DETAYLI BİLGİLERİ OKUMADAN ÖNCE EKLİ GÖRSELİ DİKKATLİCE İNCELEYİN. I. Genel Bakış Ticaret işlemlerinde yaşanan kayıpların büyük bir kısmı, piyasanın BAĞLAMI (CONTEXT) ve onun gizli ENERJİSİNİN (ENERGY) yeterince anlaşılamamasından kaynaklanır. CycleTrackSwingPro , bu kritik eksiklikleri gidermek amacıyla sağlam bir ÇERÇEVE (FRAMEWORK) ile geliştirilmiştir. Ticaret kararlarını aşağıdaki ana kategorilerle uyumlu hale getirir: Kısa Vadeli vs.
ICONIC REVERSAL PATTERN – Konfluans (Confluence) Motoru Sadece kalıpları tespit etmekle kalmayan, bir setup’ın kalitesini akıllı 0–100 Güven (Konfidenz) Skoru ile derecelendiren profesyonel bir dönüş (reversal) göstergesi. Tahmin etmeyi bırakın, değerlendirmeye başlayın. Genel Bakış Sizi yüzlerce zayıf ve çoğu kez hatalı sinyalle bombardımana tutan indikatörlerden bıktınız mı? ICONIC REVERSAL PATTERN , bu sorunu kökünden çözmek için tasarlandı. Profesyonel trader’ları amatörlerden ayıran tek bir
FREE
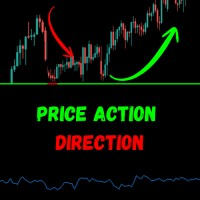
Akıllı trend tespiti ve gerçek zamanlı hassasiyet. Tek araç, birden fazla onay. Price Action Trend Direction , MetaTrader 5 için dinamik trend mantığını gelişmiş görsel netlik ve mobil bildirimlerle birleştiren güçlü ve sade bir göstergedir. İster scalper olun ister swing trader, bu araç size piyasa yönü ve trend gücünü temiz ve gürültüsüz bir şekilde sunmak için tasarlanmıştır. Özellikler & Avantajlar
Fiyat Eğimi Analizi
EMA eğimini kullanarak fiyat momentumunu doğru şekilde okuyarak tren
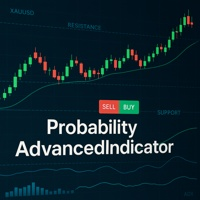
The ProbabilityAdvancedIndicator is a sophisticated trend probability analysis tool designed for scalping and day trading. It combines multiple technical indicators and multi-timeframe analysis to generate clear visual signals for buy/sell probabilities. The ProbabilityAdvancedIndicator is a comprehensive tool for traders looking for: Probability-based decision-making Consolidated technical analysis Flexibility for different trading styles Intuitive and customizable interface Pro Tip:

### Birleşik Göstergenin Temel Özellikleri:
1. **Gann Açı Sistemi**:
- Başlangıç noktasından çeşitli açılarda (45, 90 vb.) trend çizgileri çizer.
- Giriş sinyalleri ve fiyat seviyesi uyarıları içerir.
- Pivot noktalarını, Fibonacci seviyelerini ve salınım noktalarını gösterir.
2. **9'un Karesi Sistemi**:
- Fiyat karelerine göre yatay destek/direnç seviyeleri oluşturur.
- Açısal öneme göre renk kodlu seviyeler (0, 45, 90 vb.)
- Seviye dokunuşları için yapılandırılabilir uyarı sistemi.
3

Özel gösterge, hareketli ortalamanızı bir sonraki seviyeye taşıyarak 5 farklı sembolden MA'ları birleştirmenize olanak tanır! Neden? Bu şekilde kararlarınız tamamlayıcı piyasalara dayanır. Örnek: Nasdaq'ta işlem yapıyorsunuz ancak aynı anda Bitcoin ve Russell 2000'i takip ederek piyasa trendlerini bilmek istiyorsunuz. Ya da XRP ticareti yapıyorsunuz ancak küresel bir bakış açısına sahip olmak istiyorsunuz. Artık bu mümkün! Sembollerin brokerinizle eşleştiğinden emin olun, büyük/küçük harfe duya
FREE
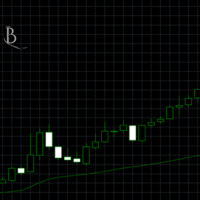
Indicator: VWAP Volume Weighted Average Price Platform: MetaTrader 5
Type: Custom Indicator
Display: Chart Window (Overlay) Functions: Calculates the Volume Weighted Average Price (VWAP) per trading day. Continuous VWAP calculation using the average of Open and Close prices and tick volume. Automatic reset of the VWAP calculation at the start of each new day. Limits data usage via the BufferSize parameter (number of candles stored in a circular buffer). Calculates the trend (slope) of the VWAP o
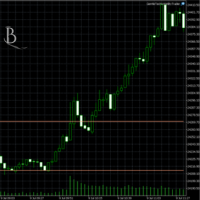
Last Day Support & Resistance Platform: MetaTrader 5
Type: Custom Indicator
Display: Chart Window (Overlay) Functions: Calculates Support and Resistance zones based on high/low patterns of the previous day. Uses a sliding sampling window ( SampleWindowSize ) to detect recent price ranges. Detects potential support if current price range is significantly below previous highs. Detects potential resistance if price range is significantly above previous lows. Updates four output buffers: LDResistanc
FREE

DrMoxQuant EA Ultimate Version (MT5) How It Works:
The DrMoxQuant EA Ultimate Version does not execute trades automatically. Instead, it analyzes the market chart and provides clear buy or sell signals, showing exact price levels for entry, pullback, take profit, and stop loss. It works as a trend tracker to help you make more accurate trading decisions. Advantages of DrMoxQuant EA Ultimate Version: Clear signals: Visual buy and sell alerts with precise price levels to guide your decisions. Ful
Pixel Minimalist Screener — Trade Smarter, Not Harder Clarity matters. In fast-moving markets, having a clean and focused workspace can make all the difference. The Pixel Minimalist Screener is built for traders who value precision, simplicity, and actionable information — all in one place. Key Features Multi-Timeframe Support
Monitor up to three customizable timeframes on a single screen. Whether you’re scalping, swing trading, or position trading, this screener helps you align with the b

The Trend Impulse Channels indicator is an advanced technical analysis tool that creates dynamic trend channels based on price impulses and volatility. It combines ATR (Average True Range) with adaptive algorithms to generate precise trend detection signals. Key Features: Adaptive Trend Line : Follows price with intelligent steps based on volatility Dynamic Channels : Upper and lower bands automatically adjust to market conditions Retest Signals : Triangle markers show important support/resistan

Opening Range Detection – Detects the opening range based on a configurable time period
Breakout Signals – Displays signals on breakouts of the OR levels
Targets – Calculates and shows target levels based on a percentage of the OR width
Daily Bias – Considers the daily trend for signal filtering
Moving Average – Optionally displays moving averages Important Adjustments for MQL5 :
Visualization : Line plots for ORH, ORL, and ORM (Opening Range High/Low/Middle) Graphical objects for targets, signa

Periodic Volume Profile Platform: MetaTrader 5
Type: Custom Indicator
Display: Chart Window (Overlay) Functions: Calculates Point of Control (POC) , Value Area High (VAH) , and Value Area Low (VAL) continuously over a rolling buffer of candles. Uses tick volume and close price to update volume distribution in real-time. Keeps a fixed-length circular buffer ( CleanUpAfter ) to remove old price-volume data. Automatically adjusts the volume profile range if price moves outside the current bounds. V
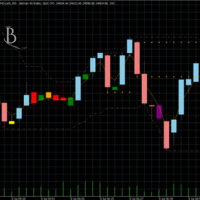
Key Candlepatterns Platform: MetaTrader 5
Type: Custom Indicator
Display: Chart Window (Candlestick Overlay) Functions: Detects and color-codes specific candlestick patterns based on candle shape, relative position, and ATR filters. Candles receive distinct colors depending on type (e.g. inside bar, outside bar, engulfing, hammer, shooting star, etc.). Visual patterns can help traders identify where buyers or sellers are likely active . Turning points (e.g., hammer followed by confirmation) are
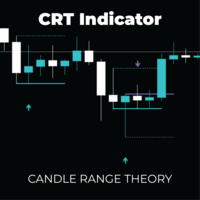
CRT Pro: Multi-Timeframe Reversal System Unlock high-probability reversal setups with the precision of Candle Range Theory (CRT) combined with Advanced DSL Trend Analysis. The CRT Multi-Timeframe System is not just a signal indicator; it is a complete trading framework designed to identify "Liquidity Sweeps" and false breakouts—the exact moments institutional money enters the market. By filtering these powerful reversal patterns through a customizable Multi-Timeframe (MTF) engine and DSL (Di

DoctorEdge V-LINE (Pump it & Dump it) Strategy Pro Confirms trend direction using smart momentum logic and key price behavior How It Works DoctorEdge V-LINE is a smart visual indicator designed to detect trend impulses and confirm their strength based on how price reacts around certain dynamic zones. Buy Trend: When price reaches level -20 , the line turns green , signaling a potential buy . If price breaks above level 0 and the line stays green, the uptrend is confirmed . If price doe
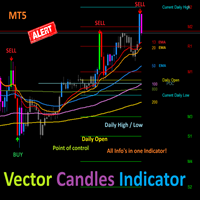
Vector Candles Indicator This is an easy and safe tool for MetaTrader 5 (MT5). It colors candles on your chart based on trading volume to spot trend changes.How to Spot Entry Signals Up Vector Candle: If a green candle with high volume closes (lime or blue color), sell. Price will likely drop back to where the candle started. Down Vector Candle: If a red candle with high volume closes (red or purple color), buy. Price will likely rise back to where the candle started. Detailed setup: Check http
FREE

Cloud Trend Matrix: The Trend Indicator That Adapts to the Market Tired of indicators that work well in strong trends but generate dozens of false signals in sideways markets? The Cloud Trend Matrix was designed to solve this exact problem. It's not just another trend follower; it's an intelligent system that reads market volatility and adapts its entry triggers to deliver signals with a higher probability of success. ️ The Concept: A Low-Latency Cloud Unlike traditional indicators, the Cloud T
FREE

Purpose of the Inside Bar and Outside Bar Breakout Scanner Indicator: The Inside Bar & Outside Bar Breakout Scanner is an advanced dashboard designed to scan multiple instruments and timeframes simultaneously. Its primary function is to identify two powerful candlestick patterns—the Inside Bar (IB) and the Outside Bar (OB) —and then to detect and classify breakouts from these formations. The indicator presents its findings in a clean, organized table, signaling potential trend continuation o

XAUUSD Heat Map Scalping Indicator Perfect for 1M, 3M, 5M, 15M Scalping on Gold (XAUUSD) Take your scalping to the next level with this exclusive Heat Map indicator , designed and optimized specifically for XAUUSD . This tool is a powerful visual assistant that helps you instantly identify market strength, pressure zones, and potential entry points in real time. Key Features: Optimized for Fast Scalping : Works best on 1-minute, 3-minute, 5-minute, and 15-minute timeframes Specializ
RSI Trendline Breakout Pro RSI indicator with automatic trendline detection and high-precision breakout signals.
Overview Transform your trading with the most advanced RSI trendline breakout system available on the market. This professional indicator combines sophisticated zone-based analysis with automatic trendline detection to deliver high-precision trading signals that work across all timeframes and market conditions. Key Features Advanced Signal Detection Zone-based RSI analysis with aut

How It Works DoctorEdge Asia-London-NY Buy & Sell Arrows Breakout is a professional indicator that identifies real breakout signals during the three most important trading sessions: Asia, London, and New York . The indicator automatically draws: Vertical lines showing the start and end of each session. Dashed horizontal lines marking the highs and lows formed within each session. Based on this session structure, it generates automatic BUY & SELL arrows , pointing to potential breakout zones ,

Double Fractal Entry generates precise entry signals based on smart fractal breakouts or rebounds. It visualizes market structure with dynamic channels and plots clear SL/TP levels. A powerful tool for trend and reversal traders. This product is also available for MetaTrader 4 => https://www.mql5.com/en/market/product/143602 The indicator generates entry points based on two configurable strategies: Fractal Breakout – when price breaks the last key fractal; Fractal Rebound – when price bounces
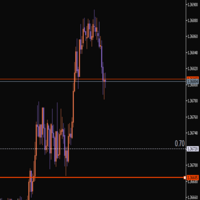
This indicator helps you set and adjust your stop-loss levels. Just move the line to where you usually place your stop, and a second line will automatically appear at a specified distance between the current price and your chosen level. Review your trades on historical data Measure the maximum drawdown from entry to exit Get data that allows you to optimize your stop-loss placement It’s a convenient way to train yourself to use more optimal stops, based on your own trading statistics.
FREE
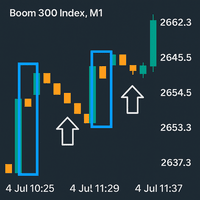
boom Spike Mitigation Zone Pro
A professional spike pattern indicator built for synthetic traders who scalp and swing Boom 500/300/1000/600/900with precision.
This indicator: Detects powerful 3-candle spike formations (Spike → Pullback → Spike) Automatically draws a clean box around the pattern Marks the entry price from the middle candle Extends a horizontal mitigation line to guide perfect sniper entries Automatically deletes & redraws the line once price touches it (mitiga
FREE
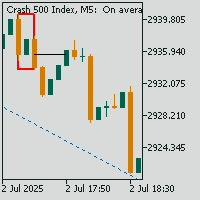
Crash Spike Mitigation Zone Pro
A professional spike pattern indicator built for synthetic traders who scalp and swing Crash 500/300/1000 with precision.
This indicator: Detects powerful 3-candle spike formations (Spike → Pullback → Spike) Automatically draws a clean box around the pattern Marks the entry price from the middle candle Extends a horizontal mitigation line to guide perfect sniper entries Automatically deletes & redraws the line once price touches it (mitigation)
FREE

AO-Alert mt5 — Professional Signal Indicator Based on Awesome Oscillator AO-Alert mt5 is an auxiliary tool for MetaTrader 4 based on the analysis of the Awesome Oscillator (AO, by Bill Williams — a visual modification of the classic MACD, included in MT5 by default). The indicator is designed to identify key moments of trend emergence and development, making it ideal for scalping, intraday, and swing trading. AO-Alert mt5 helps you catch critical shifts in market dynamics and speeds up your de

DoctorEdge X-MAN Intraday Vision The Smart Indicator for Catching Breakouts and Reversals with Precision How It Works DoctorEdge X-MAN Intraday Vision was designed to help intraday and scalping traders identify key price movements — especially true breakouts and potential false breakouts with reversal . When the price breaks above or below one of the indicator’s lines , the line automatically moves , following the new price direction. You can use this behavior as a kind of dynamic break-ev

Trend Hunter Beast MT5 Indicator Easy to follow the overall trend by looking at a higher timeframe. Simple entry when the arrow appears. Exits are made on the opposite arrow, or you can place a stop loss below the last low or high, and a stop loss as desired.
Applies to any Forex asset, although it is recommended to use pairs with low spreads.
You can also use it on crypto assets or indices such as the SP500, etc.
Check the trend on higher timeframes such as D1 and H1, and enter in the same d
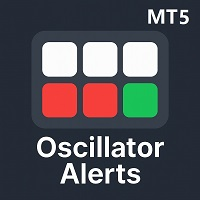
Oscillator Alerts MultiPanel All oscillator signals — in a single panel!
A professional multi-panel tool for market control, based on major oscillators with a flexible alert system and unique interactive management features. Description Oscillator Alerts MultiPanel is an innovative tool for traders that brings together multi-symbol and multi-timeframe analysis, flexible notifications, and the most convenient interactive control — all right on your chart. Key Advantages Interactive Oscillator Se
https://www.mql5.com/en/users/gedeegi/seller
The "RSI+ with 123 Fractals" logo is designed to provide a clear and professional visual representation of a complex technical indicator, focused on precise market analysis and reliable patterns. Each element in the design is crafted to reflect the philosophy and strengths of the indicator within the trading world. Design Elements: "RSI+" Text in Bold and White:
The main "RSI+" text is chosen to be the focal point, with a bold and clear font. The us
FREE

WPR Scalper Indicator for MetaTrader 5 Now for free! The WPR Scalper is a powerful indicator designed for traders seeking precise entry and exit signals based on the Williams %R oscillator. Optimized for volatile markets like BTCUSD on the H1 timeframe, it combines three Williams %R calculations (Fast, Slow, and Tortle) to identify overbought and oversold conditions with high accuracy. In the context of the WPR Scalper indicator, “Tortle” refers to a user-defined term for a third, slow Williams
FREE
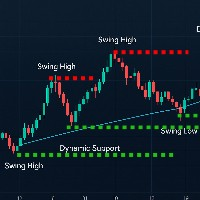
A professional swing point detection indicator that identifies key highs and lows with precision. Features include: Smart Detection : Identifies swing highs/lows based on customizable left/right bar analysis Visual Alerts : Clear arrows and labels (optional) mark swing points Dynamic Lines : Draws support/resistance lines that disappear when price touches them (toggle on/off) Real-Time Alerts : Sound and popup notifications for new swings Non-Intrusive : Preserves all manual chart drawings Perfe
FREE

RSI Momentum Shift Detector - Momentum Change Indicator Maximize your accuracy: Divergences are powerful, but they are even stronger when combined with professional volume analysis. If you like the logic behind this indicator, you will love the Volume Structure Nexus , which identifies where the big players are entering. For fast-paced traders, pair these divergences with Accuracy M1 Scalper to catch explosive moves in lower timeframes.
RSI Momentum Shift Detector is a technical indicator desi
FREE
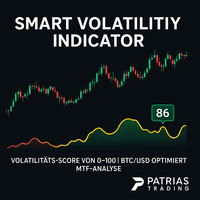
Smart Volatility Indicator – Precise Volatility Detection for MetaTrader 5 The Smart Volatility Indicator is an innovative tool for accurately measuring market volatility – specifically developed for MetaTrader 5. It combines candle range, wick ratios, and smart filtering logic into a clear, scalable volatility score from 0 to 100 . Perfect for traders who want to respond to breakouts, trend dynamics, or consolidating markets – manually or via Expert Advisors (EAs). Key Features Smart Volatility
FREE

https://www.mql5.com/en/users/gedeegi/seller
The design features a bold orange countdown timer icon set against a dark gray background, with the clock hands pointing toward the upper right. Below the timer, a candlestick chart displays green and red bars that represent price movements across different time periods, with sharp detailing and balanced composition. The countdown time of "05:17" is prominently displayed next to the clock, adding a dynamic and informative element to the image.
FREE

"Blow It Up!" – The Trading Indicator That Questions Your Life Choices Tired of boring indicators? Meet your new market companion that delivers: "YOLO BUY!" arrows when you should probably panic
Explosive rectangle confetti (because why not?)
200+ soul-crushing quotes like "Your stop loss is imaginary" and "This isn’t trading, it’s donating to whales"
Random alerts that roast your strategy This Indicator is like Therapy – Because daytrading shouldn’t feel
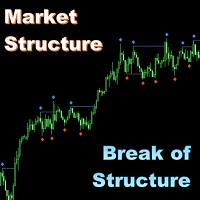
Market Structure - Break of Structure (MS-BOS) for MT5 Added simple dashboard in the right center of the chart - indicating direction of last cancelled BOS level for main set of Timeframes. This panel can be switched off in parameters
All my indicators work only at closed bars, they do not repaint any values (if it is not otherwise mentioned in the description). So that they are fully compatible with autotrading, and are ready for making qualitative technical analysis. Market Structure - Bre
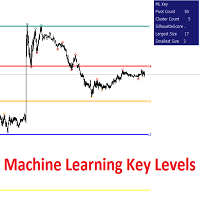
OVERVIEW
This script plots Machine Learning Key Levels on your chart by detecting historical pivot points and grouping them using agglomerative clustering to highlight price levels with the most past reactions. It combines a pivot detection, hierarchical clustering logic, and an optional silhouette method to automatically select the optimal number of key levels, giving you an adaptive way to visualize price zones where activity concentrated over time.
CONCEPTS
Agglomerative cluster

INDICATOR: GEN TARGET TREND Signal Developer: gedeegi General Description GEN TARGET TREND Signal is an advanced trend-following indicator, designed to identify potential trading signals and provide comprehensive target visualization. This indicator uses a combination of Simple Moving Average (SMA) and Average True Range (ATR) to detect trend changes, then generates clear BUY or SELL signals. This system enhances the trading experience with powerful visualization features, including a real-time

indikator Visual Panel Strengt MultiTimeframe : English Description Visual Panel Strength MultiTimeframe is a real-time trend strength indicator panel that displays the buy/sell pressure across multiple selected timeframes—such as M1, M3, and M5. The indicator utilizes ATR-based volatility analysis and a smoothed trend algorithm to calculate trend signals. Visually presented as a horizontal bar chart at the corner of your main chart, this tool helps traders instantly identify the prevailing
MetaTrader mağazasının neden alım-satım stratejileri ve teknik göstergeler satmak için en iyi platform olduğunu biliyor musunuz? Reklam veya yazılım korumasına gerek yok, ödeme sorunları yok. Her şey MetaTrader mağazasında sağlanmaktadır.
Alım-satım fırsatlarını kaçırıyorsunuz:
- Ücretsiz alım-satım uygulamaları
- İşlem kopyalama için 8.000'den fazla sinyal
- Finansal piyasaları keşfetmek için ekonomik haberler
Kayıt
Giriş yap
Gizlilik ve Veri Koruma Politikasını ve MQL5.com Kullanım Şartlarını kabul edersiniz
Hesabınız yoksa, lütfen kaydolun
MQL5.com web sitesine giriş yapmak için çerezlerin kullanımına izin vermelisiniz.
Lütfen tarayıcınızda gerekli ayarı etkinleştirin, aksi takdirde giriş yapamazsınız.