Multi Macd HD MT5
- Индикаторы
-
Mostafa Ghanbari
 ✅ Основатель MGH Products
✅ Инженер-программист | Разработчик пользовательских индикаторов и советников (EA)
✅ Опубликованный автор на MQL5.com - Версия: 1.0
Сигнал продолжения тренда, который большинство трейдеров не замечают — теперь обнаруживается автоматически на 6 таймфреймах.
Обзор
Обычная дивергенция говорит вам, когда тренд может развернуться. Скрытая дивергенция говорит, когда он вот-вот продолжится — и это сигнал, на который больше всего полагаются профессиональные трендовые трейдеры. Проблема в том, что скрытую дивергенцию заметить значительно сложнее, чем обычную, и практически ни один индикатор на MQL5 Market не обнаруживает её точно одновременно на нескольких таймфреймах.
MGH-MultiMACD-HD полностью меняет это. Построенный на том же фирменном мультитаймфреймовом движке, что и MGH-MultiMACD-RD, этот индикатор посвящён исключительно обнаружению скрытых дивергенций — отслеживает до 6 таймфреймов одновременно, рисует точные линии дивергенции как на ценовом графике, так и в окне MACD, и оповещает вас в момент формирования подтверждённой настройки. И всё это без перерисовки.
Что такое скрытая дивергенция и почему она важна?
Большинство трейдеров изучают обычную дивергенцию в начале обучения. Меньше тех, кто изучает скрытую дивергенцию. И почти ни у кого нет инструмента, который надёжно её обнаруживает.
Скрытая бычья дивергенция возникает, когда цена формирует более высокий минимум, а MACD — более низкий минимум. Это сигнализирует о том, что базовый бычий импульс сохраняется несмотря на поверхностный откат, и что тренд, вероятно, возобновится вверх.
Скрытая медвежья дивергенция возникает, когда цена формирует более низкий максимум, а MACD — более высокий максимум. Это сигнализирует о том, что давление продавцов остаётся доминирующим под кратким коррекционным отскоком, и что нисходящий тренд, вероятно, продолжится.
Это не сигналы разворота. Это сигналы продолжения тренда — среди наиболее вероятных настроек, доступных техническим трейдерам, последовательно появляющиеся на всех инструментах и всех таймфреймах. Сложность всегда заключалась в их точном обнаружении в реальном времени. MGH-MultiMACD-HD полностью решает эту задачу.
Почему большинство инструментов скрытой дивергенции не работают
Причина, по которой обнаружение скрытой дивергенции редко реализовано хорошо, сводится к трём ключевым проблемам, которые большинство индикаторов никогда не решают:
- Слепота одного таймфрейма — они показывают скрытую дивергенцию только на текущем графике, упуская структурный контекст старших таймфреймов.
- Перерисовка — сигналы, появившиеся на формирующихся свечах, исчезают при закрытии свечи, из-за чего историческая эффективность выглядит лучше, чем есть на самом деле.
- Неточное определение разворотных точек — неверная идентификация опорных точек, определяющих скрытую дивергенцию, что приводит к ложным сигналам и упущенным настройкам.
MGH-MultiMACD-HD создан специально для решения всех трёх. Алгоритм определения разворотных точек точен. Подтверждение сигнала свободно от перерисовки при установке на свечу 1. А мультитаймфреймовый движок делает его единственным инструментом скрытой дивергенции на рынке, который отслеживает шесть таймфреймов одновременно.
Ключевые возможности
Скрытая дивергенция на нескольких таймфреймах — полный обзор
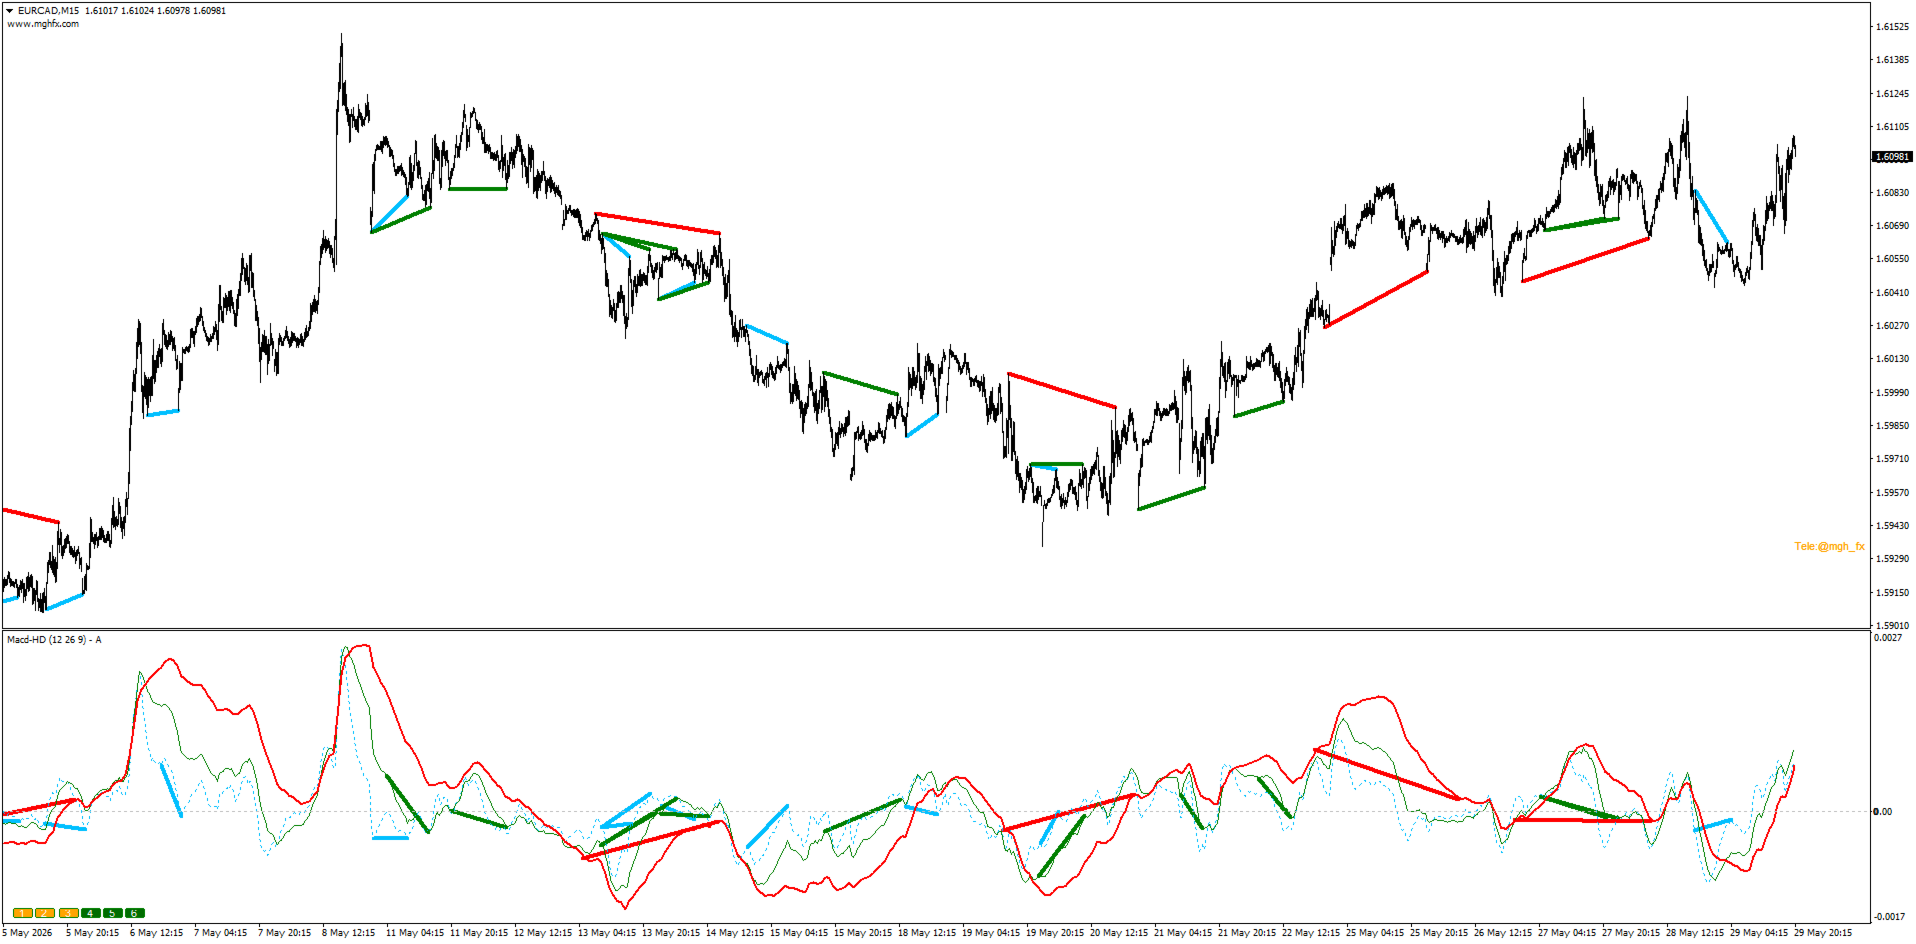
Отслеживайте текущий таймфрейм плюс до 5 старших таймфреймов одновременно. MACD каждого таймфрейма отображается своим отдельным цветом, и каждая обнаруженная скрытая дивергенция — на любом активном таймфрейме — немедленно отмечается на графике. Цвет каждой линии дивергенции на ценовом графике соответствует соответствующей линии MACD в окне индикатора, поэтому связь между сигналом на графике и контекстом осциллятора всегда понятна.
Шесть слоёв автоматически сопоставляются с таймфреймом вашего текущего графика плюс 5 стандартных старших таймфреймов над ним — поэтому простое изменение таймфрейма графика соответственно сдвигает весь набор отслеживаемых таймфреймов. Вы можете мгновенно включать или отключать любой слой кнопками на графике (1–6) или из панели Inputs. (Ручной выбор произвольного таймфрейма для каждого слоя доступен в версии для MT5, которая поддерживает более широкий диапазон таймфреймов.)
Нулевая перерисовка — торгуйте с уверенностью
Signal Candle Shift даёт вам полный контроль: установите 1 для подтверждённых сигналов на закрытой свече, которые никогда не будут перерисованы, или 0 для сигналов в реальном времени на формирующейся свече, если предпочитаете более быстрый вход. При установке на 1 каждый сигнал, который вы видите, окончательный — индикатор не может и не будет изменять исторический вывод.
Точное определение разворотных точек
Базовый алгоритм определяет точные максимумы и минимумы разворотов, которые определяют действительную скрытую дивергенцию — не приближения, не упреждающее смещение, не косметические линии, нарисованные задним числом. Линии дивергенции соединяют точные опорные точки, где цена и MACD расходятся, давая вам ясную и точную картину структурной связи между ценовым движением и импульсом.
Расширенный диапазон дивергенции
Параметр Increase Divergence Range расширяет окно анализа, позволяя обнаруживать скрытые дивергенции, сформированные между далеко отстоящими во времени разворотными точками. Стандартные индикаторы их полностью упускают. MGH-MultiMACD-HD их находит.
Гибкость отображения
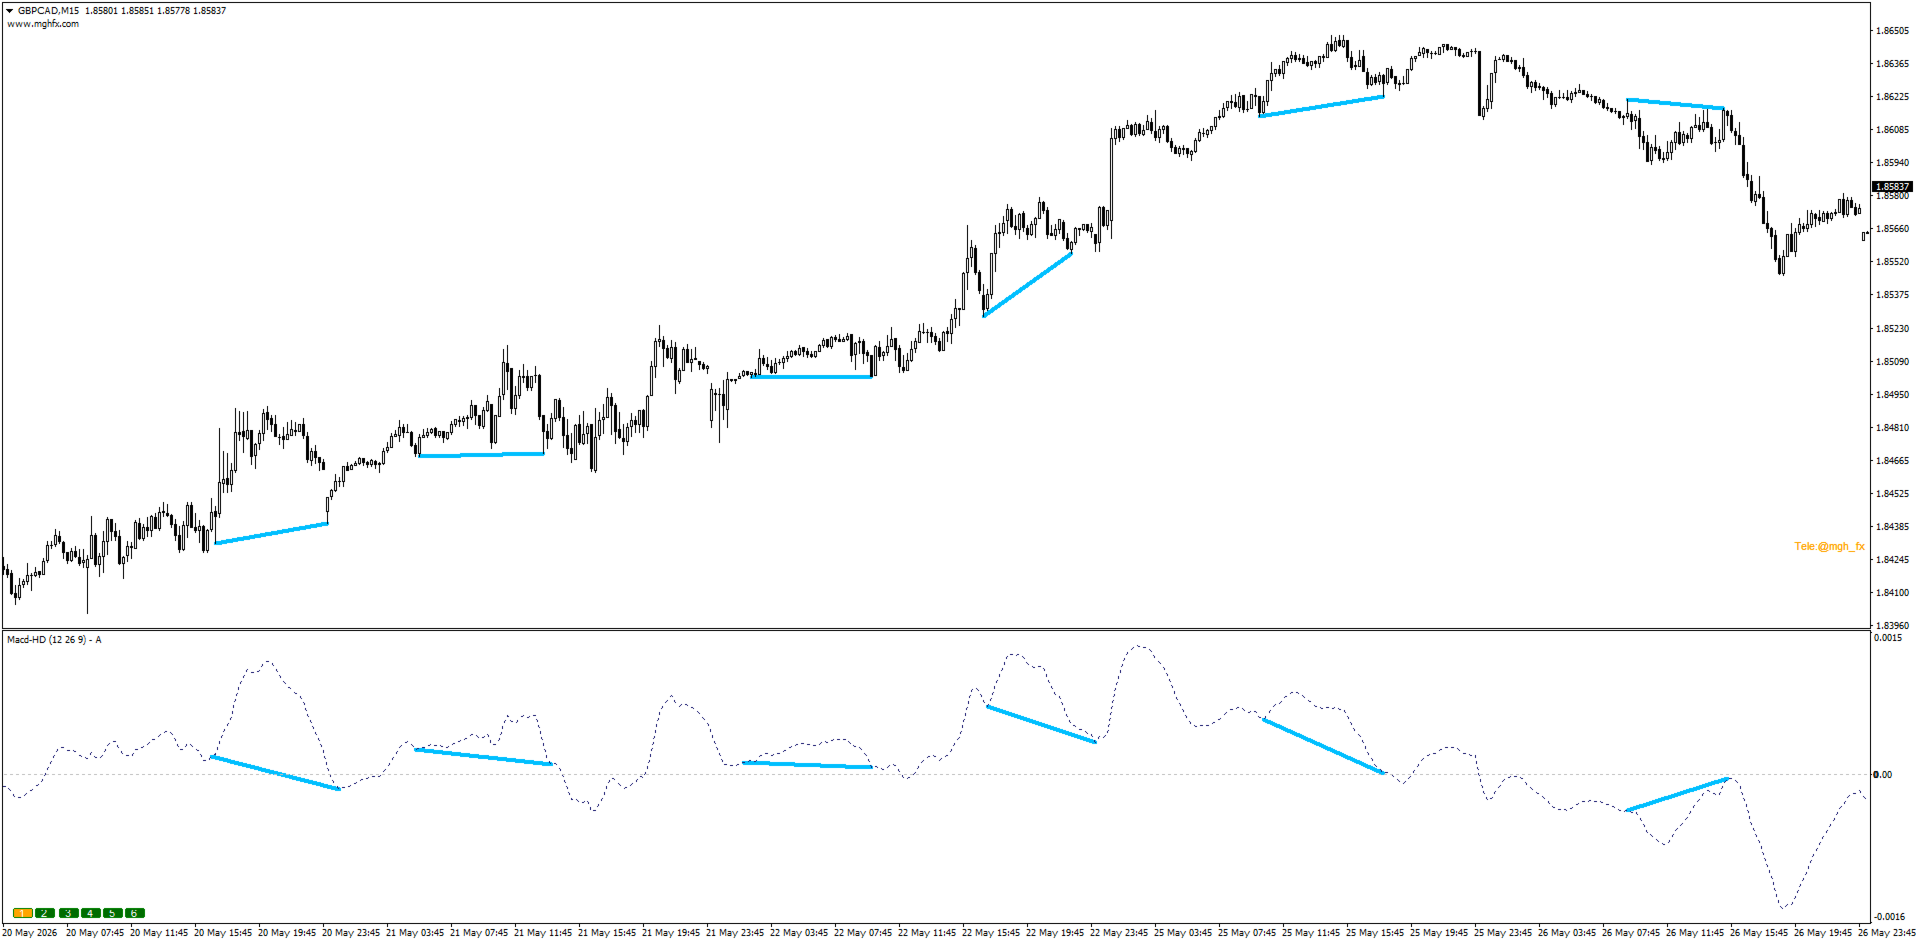
Выберите отображение линий дивергенции только на ценовом графике, только в окне индикатора или одновременно в обоих. Режим «Only Price» создаёт наиболее чистую компоновку графика — структура дивергенции видна прямо на цене без какого-либо загромождения индикатором снизу.
Полная система оповещений
- Оповещение о дивергенции — срабатывает в момент подтверждения скрытой дивергенции на любом активном таймфрейме
- Оповещение о смене фазы — срабатывает при пересечении MACD нулевой линии
- Оповещение о пересечении гистограммы/сигнала — срабатывает при пересечениях импульса
- Доставка через всплывающее окно, звук (.wav), электронную почту и push-уведомление — все настраиваются независимо
Скрытая дивергенция на разных таймфреймах — преимущество схождения
Скрытая дивергенция на одном таймфрейме — уже значимый сигнал. Когда то же направленное смещение появляется как скрытая дивергенция одновременно на двух или трёх таймфреймах — например, на M15, H1 и H4 одновременно — вероятность продолжения тренда существенно возрастает.
MGH-MultiMACD-HD делает эти зоны схождения видимыми и оповещает вас при их формировании. Это мультитаймфреймовое выравнивание — одна из настроек с наибольшей убеждённостью в техническом анализе, и это то, что ни один индикатор одного таймфрейма никогда не сможет вам показать.
Как практический подход: используйте скрытые дивергенции одного таймфрейма как подтверждение продолжения тренда в рамках существующей стратегии. Используйте зоны мультитаймфреймового схождения — где два или более таймфреймов одновременно показывают скрытую дивергенцию в одной ценовой области — как самостоятельные входы продолжения тренда с высокой вероятностью.
Практические сценарии использования
Внутридневная торговля по тренду — Торгуете M5 или M15 в чётком тренде и не уверены, является ли откат разворотом или возможностью продолжения? Включите H1 или H4 как второй слой. Когда цена M15 формирует более высокий минимум и MACD H1 также показывает скрытую бычью дивергенцию, откат почти наверняка является настройкой продолжения.
Следование тренду на дневном таймфрейме — Включите слои Daily и Weekly для обнаружения скрытых дивергенций на основных структурных уровнях. Эти сигналы появляются нечасто, но последовательно предшествуют значительным движениям продолжения тренда.
Скальпинг с контекстом старшего ТФ — Запустите M1 или M5 как Слой 1 и H1 как Слой 2. Когда старший таймфрейм подтверждает направление тренда через скрытую дивергенцию, скальпинговые входы в этом направлении имеют структурное преимущество.
Отсеивание ловушек разворота — Скрытая дивергенция в направлении преобладающего тренда — прямое подтверждение того, что тренд сохраняется. Используйте её, чтобы избегать контртрендовых сделок и оставаться на правильной стороне импульса.
Режим интерполяции
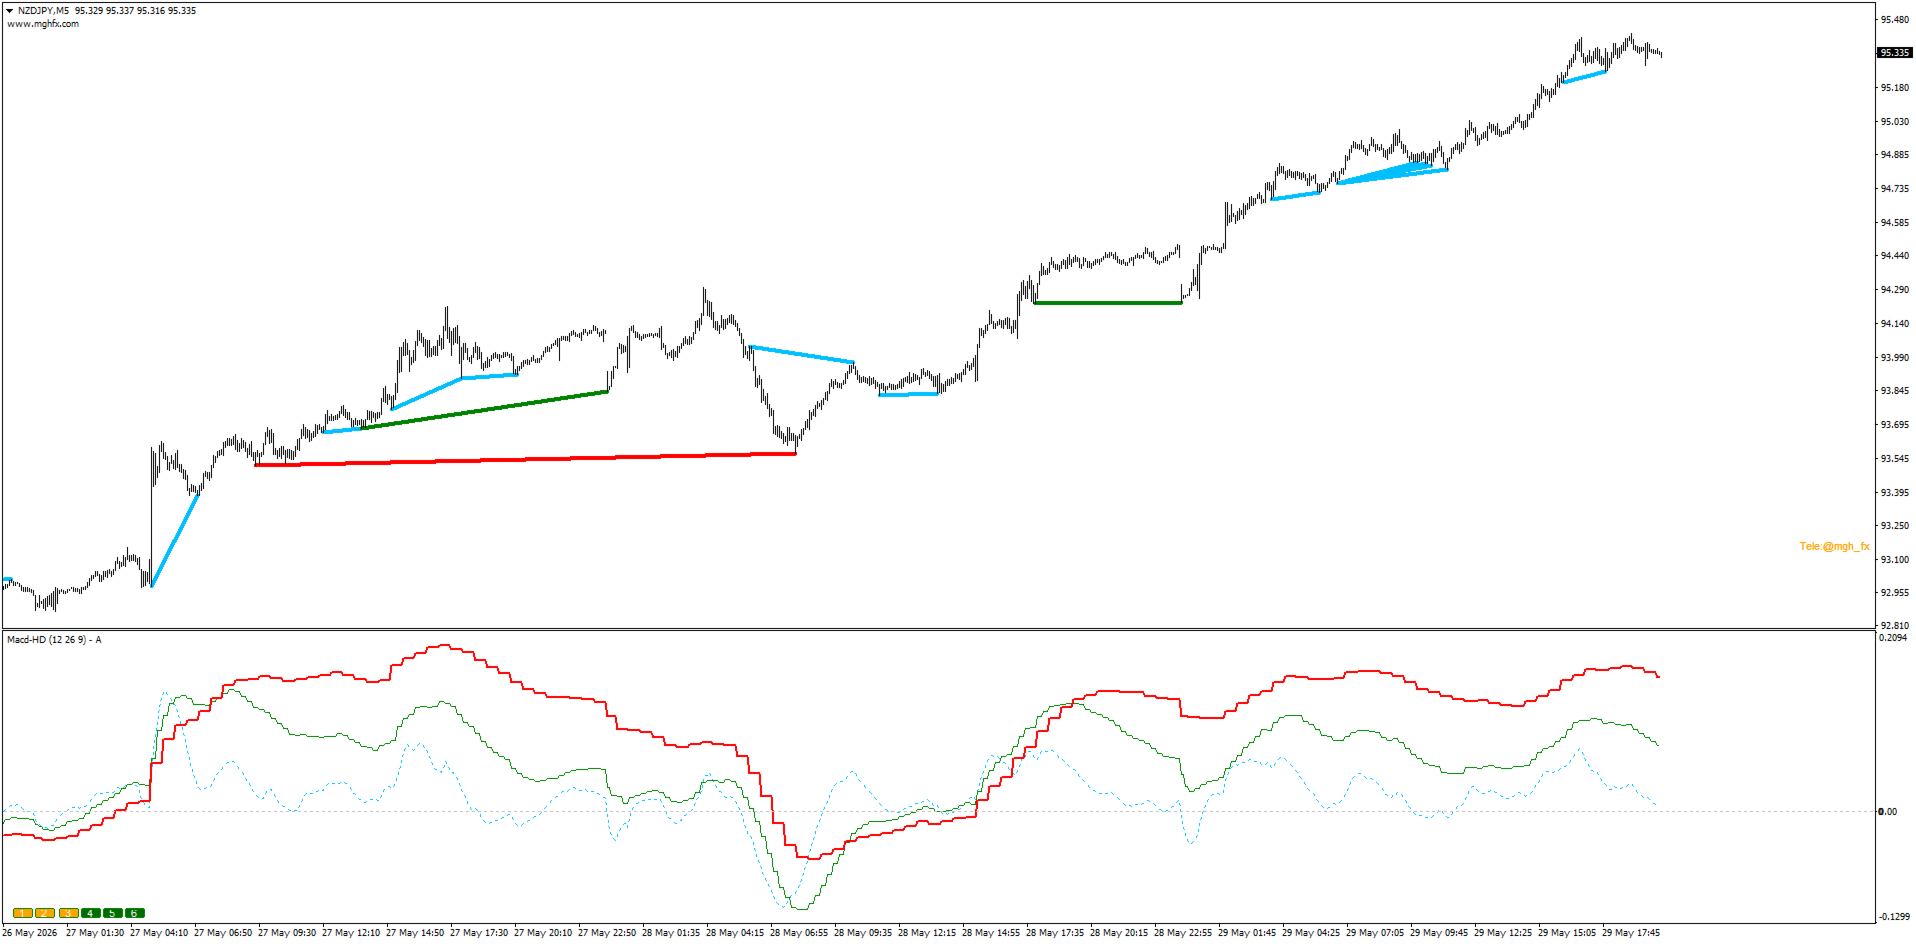
Включите Interpolate in MTF Mode, чтобы сгладить линии MACD старших таймфреймов в чистые, непрерывные кривые вместо ступенчатых графиков. Это визуальное предпочтение — базовая логика сигнала идентична — но оно создаёт значительно более чистый вывод графика при одновременном отображении нескольких таймфреймов.
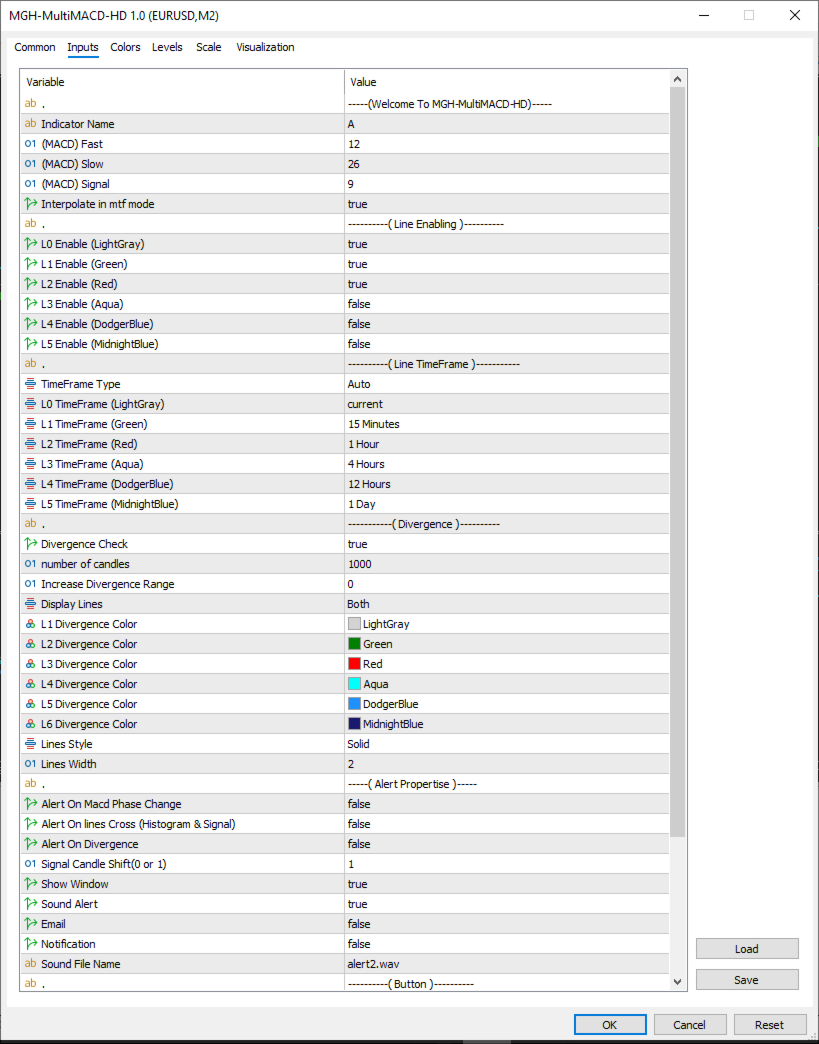
Справочник настроек
| Параметр | Описание |
|---|---|
| Indicator Name | Метка в заголовке подокна индикатора |
| Number of Candles | Период анализа (0 = вся история) |
| MACD Fast / Slow / Signal | Стандартные параметры MACD — по умолчанию 12, 26, 9 |
| Interpolate in MTF Mode | Сглаживание линий MACD старших ТФ для более чистого вида |
| L1 – L6 Enable | Независимое включение каждого слоя таймфрейма. Слои автоматически сопоставляются с текущим таймфреймом графика и 5 старшими над ним (MT4). Ручной выбор таймфрейма для каждого слоя доступен в версии MT5. |
| Divergence Check | Главный переключатель обнаружения скрытых дивергенций |
| Increase Divergence Range | Расширяет анализ для широкодиапазонных скрытых дивергенций |
| Display Lines | Только график / только окно индикатора / оба |
| L1 – L6 Divergence Color | Индивидуальный цвет линии дивергенции для каждого таймфрейма |
| Lines Style / Width | Визуальный стиль и толщина всех линий дивергенции |
| Alert On Phase Change | Оповещение при пересечении MACD нулевой линии |
| Alert On Lines Cross | Оповещение при пересечении гистограммы/сигнальной линии |
| Alert On Divergence | Оповещение при подтверждённой скрытой дивергенции |
| Signal Candle Shift (0 or 1) | 0 = реальное время; 1 = подтверждённый, без перерисовки |
| Show Window | Включение/выключение подокна индикатора |
| Sound Alert / Email / Notification | Способ(ы) доставки оповещений |
| Sound File Name | Путь к пользовательскому .wav файлу |
| Display Button | Показать или скрыть кнопки таймфреймов на графике |
| X / Y Position | Положение панели кнопок на графике |
Экосистема MGH MultiMACD
MGH-MultiMACD-HD — часть системы из двух индикаторов, созданной для полного охвата дивергенций:
| Индикатор | Тип | Назначение |
|---|---|---|
| MGH-MultiMACD-RD | Обычная дивергенция | Выявляет потенциальные развороты тренда |
| MGH-MultiMACD-HD | Скрытая дивергенция | Подтверждает настройки продолжения тренда |
Используемые вместе, эти два индикатора дают полную картину дивергенции MACD на всех таймфреймах — сигналы разворота, когда тренд заканчивается, и сигналы продолжения, когда он возобновляется. Никакая другая комбинация индикаторов на MQL5 Market не предлагает такого уровня мультитаймфреймового охвата дивергенций в единой, цветокодированной визуальной системе.
Технические характеристики
- Платформа: MetaTrader 4/5
- Тип индикатора: скрытая дивергенция на основе MACD, мультитаймфреймовый
- Перерисовка: Нет (при Signal Candle Shift = 1)
- Оповещения: звук, электронная почта, push-уведомление, всплывающее окно
- Настройки MACD по умолчанию: 12 / 26 / 9
- Поддерживаемые таймфреймы: текущий ТФ + 5 старших ТФ одновременно (автоматическое сопоставление). Ручной выбор таймфрейма для каждого слоя доступен в версии MT5.
Попробуйте бесплатно
Демо-версия доступна для загрузки прямо с MQL5 Market. Прикрепите её к любому графику, включите два или три таймфрейма и посмотрите, сколько скрытых дивергенций — сигналов продолжения тренда, которые упускали ваши текущие инструменты — появляется на ваших активных парах. Разница видна в течение нескольких минут после загрузки индикатора.
Если вы торгуете по тренду, это индикатор, который удержит вас в нём.
Разработано MGHFX | Telegram: @mgh_fx
Версия для MT5: https://www.mql5.com/en/market/product/179985


Thank you so much its good