Multi Macd HD MT5

Multi-Timeframe MACD Hidden Divergence Detector

The trend continuation signal most traders never see — now detected automatically across 6 timeframes.

Overview

Regular divergence tells you when a trend may be reversing. Hidden divergence tells you when it is about to continue — and it is the signal that professional trend-following traders rely on most. The problem is that hidden divergence is significantly harder to spot than regular divergence, and virtually no indicator on MQL5 Market detects it accurately across multiple timeframes simultaneously.

MGH-MultiMACD-HD changes that entirely. Built on the same proprietary multi-timeframe engine as MGH-MultiMACD-RD, this indicator is dedicated exclusively to hidden divergence detection — monitoring up to 6 timeframes at once, drawing precise divergence lines on both the price chart and the MACD window, and alerting you the moment a confirmed setup forms. All without repainting.

What Is Hidden Divergence — And Why Does It Matter?

Most traders learn regular divergence early in their education. Fewer learn hidden divergence. And almost none have a tool that detects it reliably.

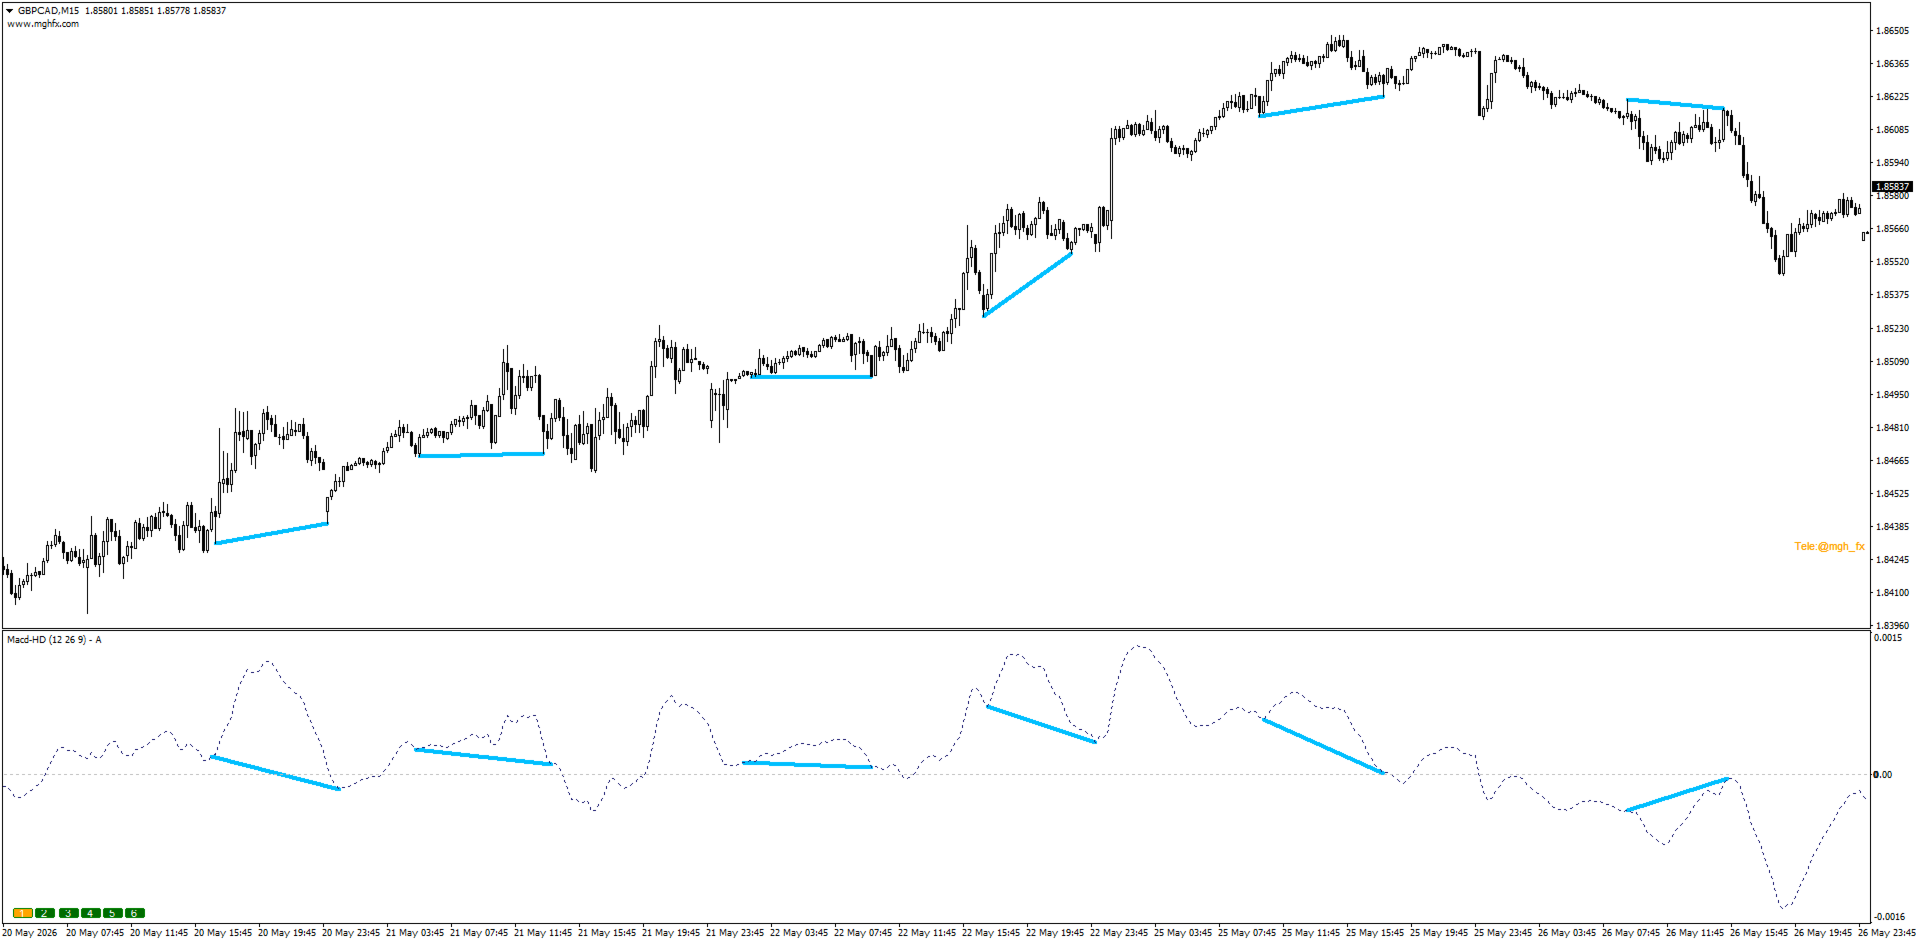
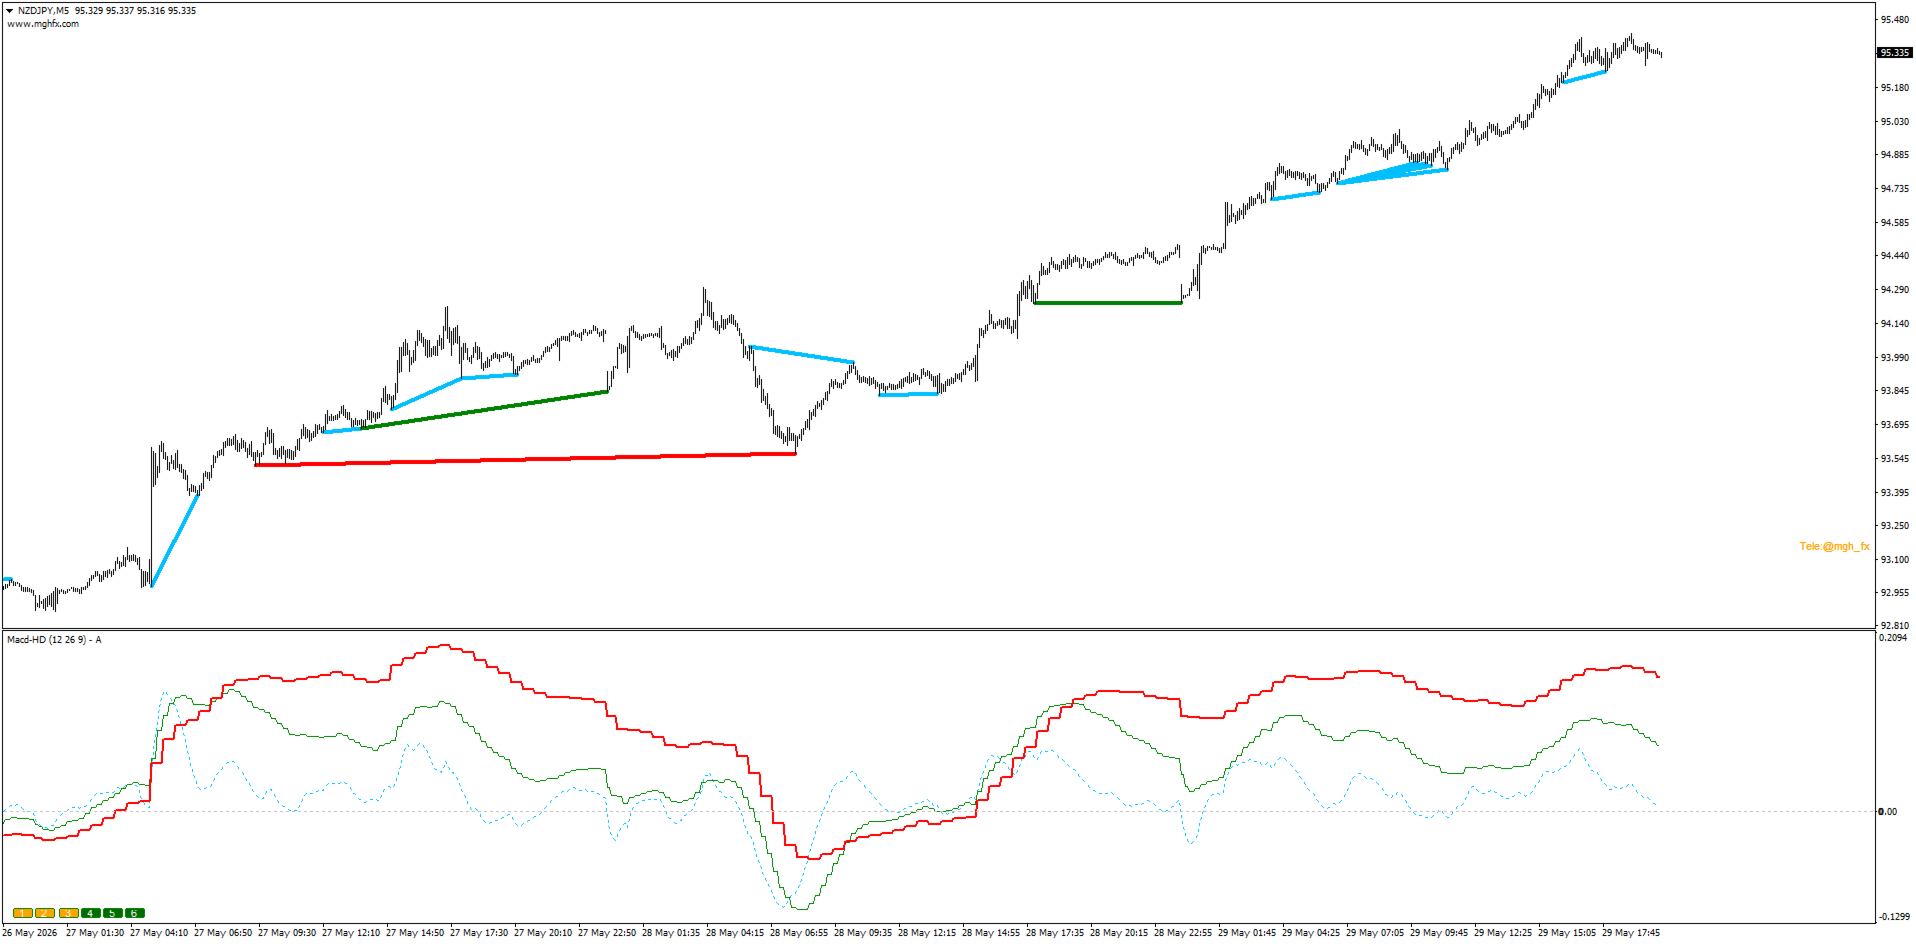
Hidden bullish divergence occurs when price makes a higher low while MACD makes a lower low. It signals that the underlying bullish momentum is intact despite a surface-level pullback — and that the trend is likely to resume upward.

Hidden bearish divergence occurs when price makes a lower high while MACD makes a higher high. It signals that selling pressure remains dominant beneath a brief corrective bounce — and that the downtrend is likely to continue.

These are not reversal signals. They are trend continuation signals — among the highest-probability setups available to technical traders, appearing consistently across all instruments and all timeframes. The challenge has always been detecting them accurately and in real time. MGH-MultiMACD-HD solves that challenge completely.

Why Most Hidden Divergence Tools Fail

The reason hidden divergence detection is rarely implemented well comes down to three core problems that most indicators never address:

  • Single-timeframe blindness — they show you hidden divergence on the current chart only, missing the structural context available from higher timeframes.
  • Repaint — signals that appeared on forming candles disappear when the candle closes, making historical performance appear better than it actually is.
  • Imprecise swing detection — incorrect identification of the pivot points that define hidden divergence, leading to false signals and missed setups.

MGH-MultiMACD-HD was built specifically to solve all three. The swing detection algorithm is precise. The signal confirmation is repaint-free when set to candle 1. And the multi-timeframe engine makes it the only hidden divergence tool on the market that watches six timeframes simultaneously.

Key Features

Multi-Timeframe Hidden Divergence — The Complete View

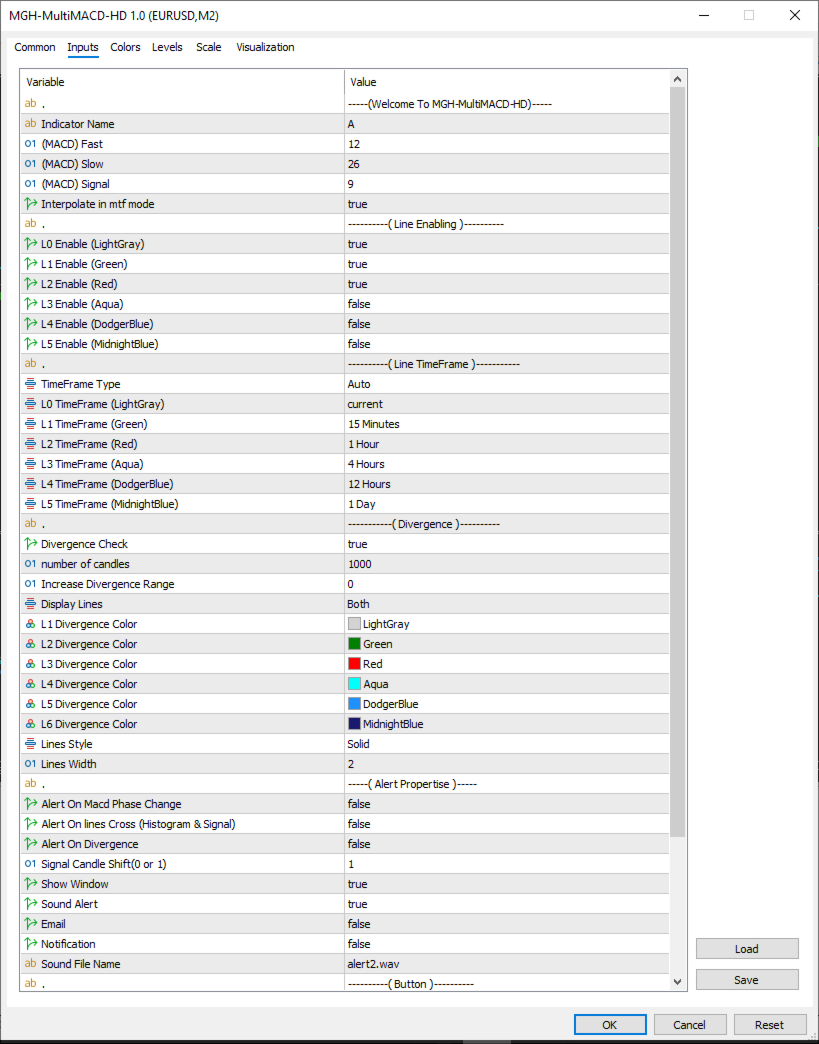
Monitor the current timeframe plus up to 5 higher timeframes at once. Each timeframe's MACD is displayed in its own distinct color, and every hidden divergence detected — on any active timeframe — is marked immediately on the chart. The color of each divergence line on the price chart matches the corresponding MACD line in the indicator window, so the relationship between chart signal and oscillator context is always clear.

Toggle any timeframe on or off instantly using the on-chart buttons (1–6) or from the Inputs panel — no need to re-open settings to switch your active timeframe combination.

Zero Repaint — Trade With Confidence

Signal Candle Shift gives you full control: set it to 1 for confirmed, closed-candle signals that will never be redrawn, or 0 for real-time signals on the forming candle if you prefer faster entry. When set to 1, every signal you see is final — the indicator cannot and will not alter historical output.

Precision Swing Detection

The core algorithm identifies the precise swing highs and lows that define valid hidden divergence — not approximations, not lookahead bias, not cosmetic lines drawn after the fact. The divergence lines connect the exact pivot points where price and MACD disagree, giving you a clear, accurate picture of the structural relationship between price action and momentum.

Extended Divergence Range

The Increase Divergence Range parameter extends the lookback window, allowing detection of hidden divergences formed between swing points that are far apart in time. Standard indicators miss these entirely. MGH-MultiMACD-HD finds them.

Display Flexibility

Choose to display divergence lines on the price chart only, the indicator window only, or both simultaneously. The "Only Price" mode produces the cleanest chart layout — divergence structure is visible directly on price without any indicator clutter below.

Full Alert System

  • Divergence alert — fires the moment a hidden divergence is confirmed on any active timeframe
  • Phase change alert — fires when MACD crosses the zero line
  • Histogram/Signal cross alert — fires on momentum crossovers
  • Delivery via popup, sound (.wav), email, and push notification — all independently configurable

Hidden Divergence Across Timeframes — The Confluence Advantage

A hidden divergence on a single timeframe is already a meaningful signal. When the same directional bias appears as hidden divergence simultaneously on two or three timeframes — for example, on M15, H1, and H4 at the same time — the probability of trend continuation increases substantially.

MGH-MultiMACD-HD makes these confluence zones visible and alerts you when they form. This multi-timeframe alignment is one of the highest-conviction setups in technical analysis, and it is something no single-timeframe indicator can ever show you.

As a practical framework: use single-timeframe hidden divergences as trend-continuation confirmation within your existing strategy. Use multi-timeframe confluence zones — where two or more timeframes show hidden divergence simultaneously in the same price area — as standalone, high-probability trend-continuation entries.

Practical Use Cases

Intraday trend trading — Trading M5 or M15 in a clear trend and unsure whether a pullback is a reversal or a continuation opportunity? Enable H1 or H4 as a second layer. When M15 price makes a higher low and H1 MACD also shows hidden bullish divergence, the pullback is almost certainly a continuation setup.

Daily timeframe trend following — Enable the Daily and Weekly layers to catch hidden divergences on major structural levels. These signals appear infrequently but consistently precede significant trend continuation moves.

Scalping with higher-TF context — Run M1 or M5 as Layer 1 and H1 as Layer 2. When the higher timeframe confirms the trend direction via hidden divergence, scalp entries in that direction carry a structural edge.

Filtering out reversal traps — Hidden divergence in the direction of the prevailing trend is a direct confirmation that the trend is intact. Use it to avoid counter-trend trades and stay on the right side of momentum.

Interpolation Mode

Enable Interpolate in MTF Mode to smooth the MACD lines from higher timeframes into clean, continuous curves rather than step-function plots. This is a visual preference — the underlying signal logic is identical — but it produces significantly cleaner chart output when multiple timeframes are displayed simultaneously.

Settings Reference

Parameter Description
Indicator Name Label shown in the indicator sub-window header
Number of Candles Lookback period (0 = full history)
MACD Fast / Slow / Signal Standard MACD parameters — defaults are 12, 26, 9
Interpolate in MTF Mode Smooth higher-TF MACD lines for cleaner visual output
L1 – L6 Enable Independently enable or disable each timeframe layer
Divergence Check Master on/off switch for hidden divergence detection
Increase Divergence Range Extends lookback for detecting wide-range hidden divergences
Display Lines Price chart only / indicator window only / both
L1 – L6 Divergence Color Individual divergence line color per active timeframe
Lines Style / Width Visual style and thickness of all divergence lines
Alert On Phase Change Alert when MACD crosses the zero line
Alert On Lines Cross Alert on histogram / signal line crossover
Alert On Divergence Alert on confirmed hidden divergence detection
Signal Candle Shift (0 or 1) 0 = real-time; 1 = confirmed, no-repaint
Show Window Toggle the indicator sub-window on or off
Sound Alert / Email / Notification Alert delivery method(s)
Sound File Name Custom .wav file path for sound alerts
Display Button Show or hide on-chart timeframe toggle buttons
X / Y Position Position of the on-chart button panel

The MGH MultiMACD Ecosystem

MGH-MultiMACD-HD is part of a two-indicator system designed to give traders complete divergence coverage:

Indicator Type Purpose
MGH-MultiMACD-RD Regular Divergence Identifies potential trend reversals
MGH-MultiMACD-HD Hidden Divergence Confirms trend continuation setups

Used together, these two indicators provide a complete picture of MACD divergence across all timeframes — reversal signals when the trend is ending, continuation signals when it is resuming. No other indicator combination on MQL5 Market offers this level of multi-timeframe divergence coverage in a unified, color-coded visual system.

Technical Specifications

  • Platform: MetaTrader 4
  • Indicator Type: MACD-based hidden divergence, multi-timeframe
  • Repaint: No (when Signal Candle Shift = 1)
  • Alerts: Sound, Email, Push Notification, Popup
  • Default MACD Settings: 12 / 26 / 9
  • Timeframes Supported: Current TF + 5 higher TFs simultaneously

Try It Free

A demo version is available for download directly from MQL5 Market. Attach it to any chart, enable two or three timeframes, and watch how many hidden divergences — trend continuation signals your current tools have been missing — appear across your active pairs. The difference is visible within minutes of loading the indicator.

If you trade with the trend, this is the indicator that keeps you in it.

Developed by MGHFX | Telegram: @mgh_fx

MT4 Version : https://www.mql5.com/en/market/product/179159
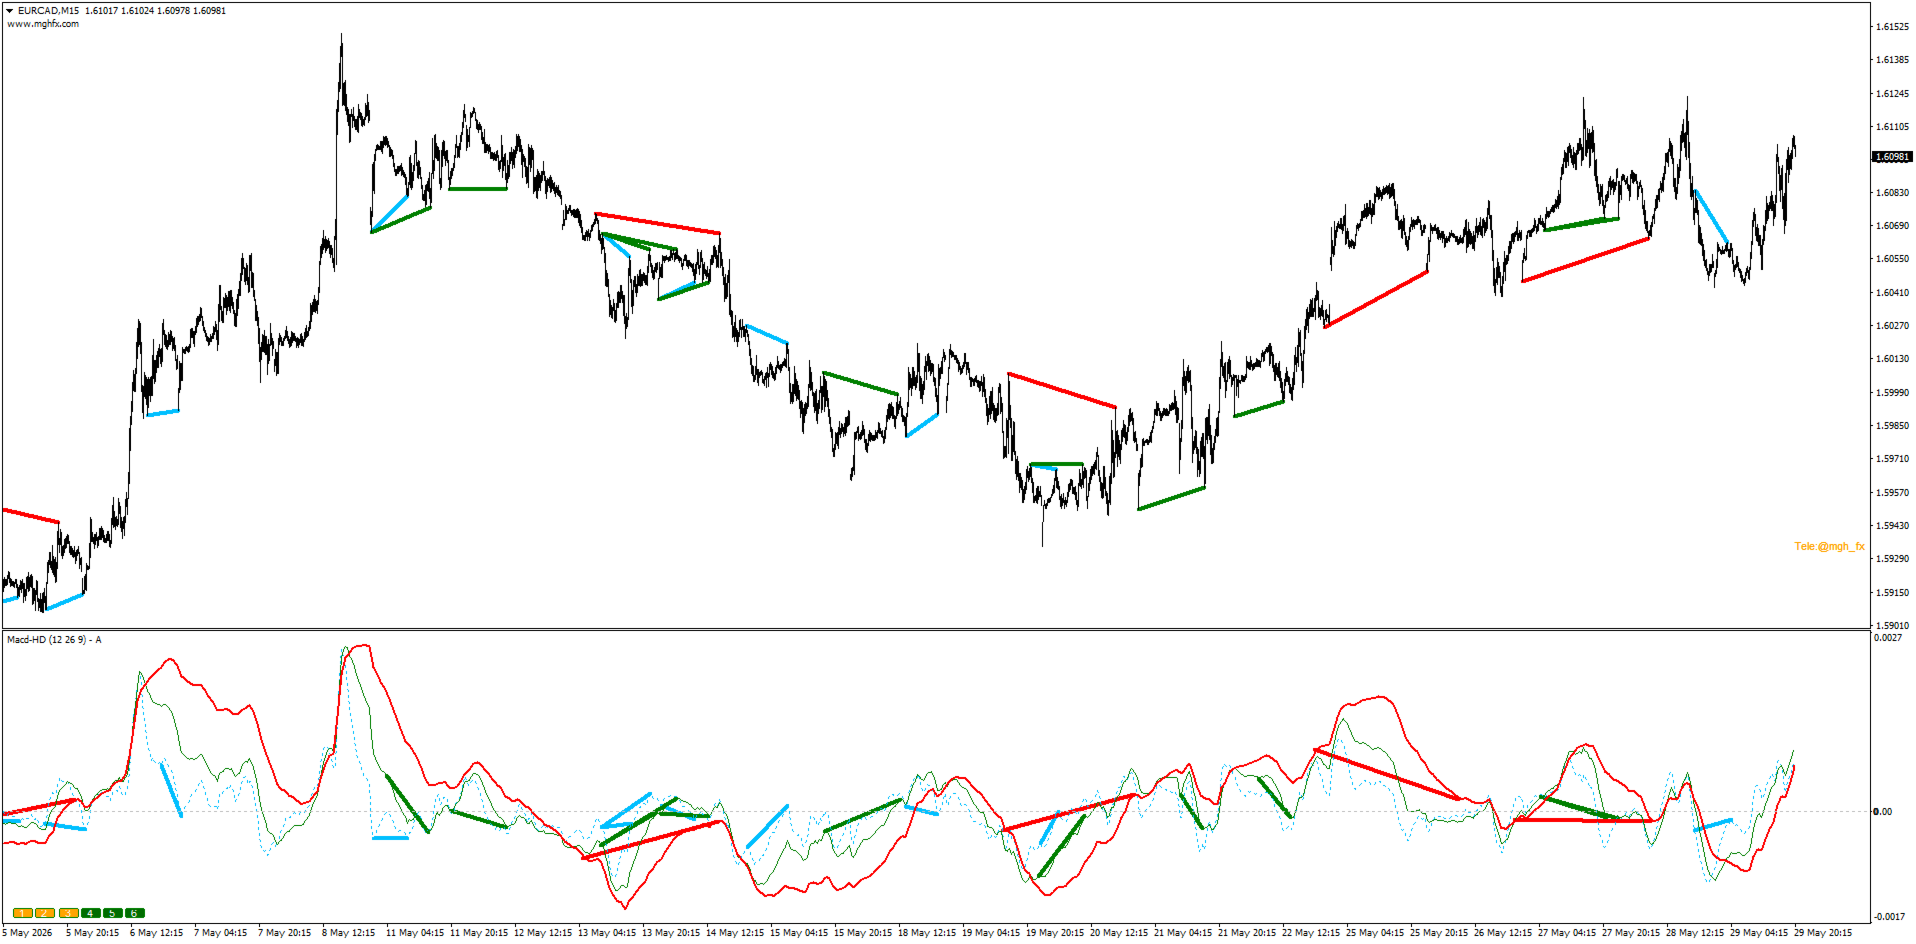
おすすめのプロダクト
TANIN ICHIMOKU CLOUD (EA20): The Ultimate Trend Rider & Prop Firm Shield Trading the Ichimoku Kinko Hyo system manually can be complex and emotionally draining. Are you tired of getting shaken out of massive trends by market noise? Meet EA20 Tanin Ichimoku Cloud , a fully automated trend-following system. It takes the guesswork out of Ichimoku by executing sniper entries and riding the mega trends with zero emotions.   ENTER YOUR KEY HERE:   [  EA20_99999D_TANINCODER_598259741005 ] --
FREE
Multi-Timeframe MACD Divergence Detector Never miss a divergence again — across 6 timeframes, all at once. Overview Most MACD divergence indicators on the market are either inaccurate, overly simplistic, or plagued with repaint issues.   MGH-MultiMACD-RD   was built to solve all of that — and go much further. This is not just another MACD indicator. It is a   multi-timeframe divergence engine   that simultaneously monitors up to 6 timeframes on a single chart, detects every divergence with preci
Crypto_Forex MT5用インジケーター「HTF移動平均線クロス」 - 強力なMT5用HTF移動平均線クロスインジケーターで、トレード手法をアップグレードしましょう。HTFとは、より長い時間枠での取引を意味します。 - このインジケーターは、プライスアクションエントリーを行うトレンドトレーダーに最適です。 - より長い時間枠の高速移動平均線と低速移動平均線を現在のチャートに貼り付けることができます。これはプロフェッショナルな手法です。 - HTF移動平均線クロスには、モバイルとPCの両方に対応したアラート機能が組み込まれています。 - このインジケーターは、低リスクで十分な利益を得る機会を提供します。 高品質のトレーディングロボットとインジケーターをご覧になるにはここをクリックしてください! これは、このMQL5ウェブサイトでのみ提供されるオリジナル製品です。
**  All Symbols  x  All Timeframes  scan just by pressing scanner button ** *** Contact me  to send you instruction and add you in "Wolfe Wave Scanner group" for sharing or seeing experiences with other users. Introduction: A Wolfe Wave is created with five-wave patterns in price. It shows supply and demand and a fight towards a balance price. T hese waves of price actions can help traders identify the boundaries of   the trend . Also  It helps forecast how the price will move in the near futur
MACD Ultimate MTF PRO is a MetaTrader 5 indicator built for traders who use MACD but want more context than a simple crossover. A common issue with the standard MACD is that a crossover may look clear, while momentum is still weak, the histogram is fading, or higher timeframes are not aligned. This can happen often on XAUUSD, M5/M15 charts, and other fast-moving symbols. This Pro version keeps the classic MACD structure and adds a practical decision-support layer with multi-timeframe confirmatio
Detect divergence (classic, hidden) price and all oscillator indicator include: RSI, CCI, MACD, OSMA, Stochastic, Momentum, Awesome Oscillator (AO), Accelerator Oscillator (AC), Williams Percent Range (WPR), Relative Vigor Index (RVI), Rate of Change (ROC). Confirm reversal with dochian channel for to improve signal quality. Divergence is when the price of an asset is moving in the opposite direction of a technical   indicator , such as an oscillator, or is moving contrary to other data. Diverge
Price Magnet — Price Density and Attraction Levels Indicator Price Magnet is a professional analytical tool designed to identify key support and resistance levels based on statistical Price Density. The indicator analyzes a specified historical period and detects price levels where the market spent the most time. These zones act as “magnets,” attracting price action or forming a structural base for potential reversals. Unlike traditional Volume Profile tools, Price Magnet focuses on price-time d
Ichimoku Kinko Hyo is a purpose-built trend trading charting system that has been successfully used in nearly every tradable market. It is unique in many ways, but its primary strength is its use of multiple data points to give the trader a deeper, more comprehensive view into price action. This deeper view, and the fact that Ichimoku is a very visual system, enables the trader to quickly discern and filter "at a glance" the low-probability trading setups from those of higher probability. This i
ADVANCED FUNCTIONALITIES: Trend Score (0-100) with visual bar Intelligent signals with adjustable strength (1-10) Risk management with automatic TP/SL Audible and visual alerts Price zones with smooth filling Multi-indicator analysis (RSI, ATR, BB, EMAs) DESIGN FEATURES Modern Visual: Smooth and well-spaced lines (EMA with 2-3px width) Vibrant and professional colors (Sky Blue, Orange, Gold) Modern arrows (code 233/234) for buy/sell signals Configurable dark/light theme Adjustable transparency f
Технический индикатор Universal Oscillator является комбинацией торговых сигналов самых популярных и широко используемых осцилляторов. Индикатор представлен гистограммами, а также линиями fast и slow MA, что позволяет расширить список получаемых торговых рекомендаций и работать как по тренду, так и в боковом движении рынка. Таким образом, гистограммы позволяют определить момент пробоя ценовых значений и движение в новой фазе рынка, а линии указывают на зоны перекупленности и перепроданности.  Ос
RSI Currency Strength Meter is a powerful and elegant multi-currency indicator that measures the real-time relative strength of the 8 major currencies using RSI logic. By calculating the smoothed performance of each currency across its major pairs and applying the RSI formula, it delivers clean and responsive strength lines that make it easy to spot which currencies are truly strong or weak at any moment. This indicator is particularly useful for visualizing currency correlations and divergence
The main advantage of this indicator is filtering of buy and sell signals in the direction of the market impulse and ranking them by strength. Configuration of the indicator is simple and intuitive. All you need to do is to react only to strong signals. Adhere to the money management rules. Description The Color Stochastic with an analytical panel indicator consists of the Stochastic indicator itself and the information/analytics panel. The indicator provides options for configuring the paramet
Cvd Divergence
Thalles Nascimento De Carvalho
CVD Divergence ― オーダーフローとダイバージェンスのプロフェッショナル分析 CVD Divergence は、価格と Cumulative Delta Volume(CVD)との間に発生する信頼性の高いダイバージェンスを検出するために開発されたテクニカル指標です。実際の注文フローが価格の動きを確認していない局面を正確に捉え、反転、勢いの減衰、そして機関投資家による操作の可能性を示します。 このインジケーターは、アグレッシブボリュームの読み取りと価格構造の分析を組み合わせ、明確で客観的かつ先行性のあるシグナルを提供します。 インジケーターの機能 CVD Divergence は、累積デルタボリュームを用いて注文フローの方向と価格の方向を比較します。両者が大きく乖離した際、チャート上にマーカーを表示し、ダイバージェンスの方向を視覚的に示します。 検出できる内容: 強気ダイバージェンス(価格が下落しているが CVD が上昇している場合) 弱気ダイバージェンス(価格が上昇しているが CVD が下降している場合) 買い手・売り手の勢いの枯渇 機関投資家の不均衡によるフェイクムーブ
Introducing "X Marks the Spot" – Your Ultimate MetaTrader 5 Indicator for Perfect Trades! Are you tired of the guesswork in trading? Ready to take your MetaTrader 5 experience to a whole new level? Look no further – "X Marks the Spot" is here to revolutionize your trading strategy! What is "X Marks the Spot"? "X Marks the Spot" is not just another indicator – it's your personal trading compass that works seamlessly on all timeframes . Whether you're a beginner or an experienced trader,
Neon Stoch Div — World Investor Neon Stoch Div is an advanced indicator for MetaTrader 5 that detects regular and hidden divergences using the Stochastic Oscillator (%K/%D). Designed to accurately identify price exhaustion zones, it combines high-quality technical analysis with a Midnight Neon visual interface optimized for extended trading sessions. What does it do? It compares price pivots with those of the Stochastic Oscillator to detect bullish and bearish divergences, both regular and hi
The Optimized MACD Divergence indicator is a powerful tool designed to identify potential trading opportunities by detecting divergences between price action and the MACD indicator. It combines classic divergence analysis with candlestick pattern recognition and volume filtering to provide more accurate and reliable signals. How it Works The indicator operates on the following principles: MACD Calculation:   It calculates the MACD indicator using user-defined parameters for fast EMA, slow EMA,
このインジケーターは、価格と移動平均収束拡散(MACD)および相対力指数(RSI)テクニカル指標との間のダイバージェンスを検出します。 このインジケーターのシグナルはリペイントされません。エントリーシグナルは、矢印付きのバーが閉じた後に表示されます。 ダイバージェンスは以下のように定義されます。 価格チャートが高値を更新し、MACDまたはRSIの値が以前の水準を下回っている場合、これは弱気のダイバージェンスです。 価格チャートが安値を更新し、MACDまたはRSIの値が以前の水準を上回っている場合、これは強気のダイバージェンスです。 通常、このインジケーターのシグナルはトレンドの反転前に表示されます。より長い時間軸でトレンドの方向別にシグナルをフィルタリングすることをお勧めします。 設定 バー数 - インジケーターの計算に使用するバーの数 ダイバージェンスインジケーター - ダイバージェンスを検出するためのインジケーター。 MACD FastEMA、MACD SlowEMA、MACD SMA、MACD適用価格 - MACDインジケーター設定 RSI期間、RSI買われすぎ、RSI
Noize Absorption Index - is the manual trading system that measures the difference of pressure between bears forces and bulls forces. Green line - is a noize free index that showing curent situation. Zero value of index shows totally choppy/flat market.Values above zero level shows how powerfull bullish wave is and values below zero measures bearish forces.Up arrow appears on bearish market when it's ready to reverse, dn arrow appears on weak bullish market, as a result of reverse expectation.
This indicator shows bands (flexible corridor) for a current price movement and the change of trend. The indicator can be used on any time frames and currency pairs. The following input parameters can be easily changed for your needs: nPeriod = 13; - number of bars which the indicator will use for calculation Deviation = 1.618; - coefficient for bands distance from the middle line MaShift = 0; - shift from current bar
KT MACD ダイバージェンスは、価格とオシレーターの間に形成される通常のダイバージェンスと隠れたダイバージェンスを表示します。トレンドの反転を予測する戦略を用いている場合、MACD の通常のダイバージェンスを利用して転換点を特定できます。トレンドの継続に基づく戦略では、MACD の隠れたダイバージェンスが有効です。 KT MACD ダイバージェンスの制限事項 MACD ダイバージェンスを単体のエントリーシグナルとして使うのはリスクがあります。すべてのダイバージェンスが反転を示すとは限りません。より良い結果を得るためには、プライスアクションや他の分析手法と併用することをおすすめします。 主な機能 価格とオシレーターの間の通常および隠れたダイバージェンスを表示します。 非対称なダイバージェンスは精度向上とチャートの見やすさのために除外されます。 トレンド反転戦略およびトレンド継続戦略の両方に対応。 エキスパートアドバイザーへの組み込みに完全対応。 エントリーおよびエグジットの両方で使用可能です。 すべてのMetaTraderアラートに対応。 そもそもダイバージェンスとは? 一般的
Advanced ideas of the popular MACD indicator: It detects and displays classic and reverse divergences (two methods of detecting divergences). It uses different color to highlight an uptrend and a downtrend. Two methods of determining a trend: а) MACD crosses the 0 level (classic signal); б) MACD crosses its own average (early signal). This is a multi-timeframe indicator: it can display MACD data from other timeframes. Two methods of drawing: classic histogram and line. It generates sound and vis
Supertrend   indicator uses a combination of a moving average and average true range to detect the trend of a trading instrument. Supertrend indicator for MetaTrader 5 easily shows the trend as a line following the price. You can use the second my indicator: You will see 3 supertrends and EMA 200 lines on the screen. Working with my product : https://www.mql5.com/en/market/product/80692
Trend Direction ADX indicator Trend Direction ADX is part of a serie of indicators used to characterize market conditions. Almost any strategy only work under certain market conditions. Therefore it is important to be able to characterize market conditions at any time: trend direction, trend strength, volatility, etc.. Trend Direction ADX is an indicator to be used to characterize trend direction: trending up trending down ranging Trend Direction ADX is based on ADX standard indicator. Tre
HiperCube VIX へようこそ Darwinex Zero 25%割引コード: DWZ2328770MGM この指標は、sp500 / us500 の市場のボリュームに関する実際の情報を提供します 定義 CBOE ボラティリティ インデックスとして知られる HiperCube VIX は、市場の恐怖やストレスを測る広く認知された指標です。株式市場の不確実性とボラティリティのレベルを示し、S&P 500 インデックスを広範な市場の代理として使用します。VIX インデックスは、S&P 500 インデックスのオプション契約の価格に基づいて計算されます。 機能: カスタムカラー カスタムチャートカラー メイングラフを明瞭に保つためにサブウィンドウにインジケーターを表示 解釈が簡単 完全にカスタマイズ可能 Chat gptとAIが開発に使用されました 使用例: VIX は実際の市場に関する優れた情報を提供するボリュームインジケーターです。このインジケーターの値が高いということは、ボラティリティが高いことを意味します ボラティリティが高いということは、市場の動きにアプローチし、市場
FREE
MFI Divergence for MetaTrader 5 MFI Divergence is a practical and easy-to-use MT5 indicator that detects regular and hidden divergences using the Money Flow Index (MFI) . It is built for traders who want a cleaner way to spot possible reversals , continuation setups , and momentum weakness directly from chart structure. The indicator runs in a separate window and automatically analyzes MFI pivot highs and lows against price highs and lows . When divergence conditions are found, it draws cle
Type: Oscillator This is Gekko's Cutomized Moving Average Convergence/Divergence (MACD), a customized version of the famous MACD indicator. Use the regular MACD and take advantage of several entry signals calculations and different ways of being alerted whenever there is potential entry point. Inputs Fast MA Period: Period for the MACD's Fast Moving Average (default 12); Slow MA Period: Period for the MACD's Slow Moving Average (default 26); Signal Average Offset Period: Period for the Signal A
CosmiCLab SMC FIBO CosmiCLab SMC FIBO is a professional trading indicator designed for traders who use Smart Money Concepts (SMC), market structure analysis and Fibonacci retracement levels. The indicator automatically detects market swings and builds Fibonacci levels based on the latest impulse movement. It also identifies market structure changes such as BOS (Break of Structure) and CHOCH (Change of Character), helping traders understand the current market direction. CosmiCLab SMC FIBO also pr
Fibo Daily Channel Indicator The  Indicator is a powerful tool for traders, providing precise daily support and resistance levels based on Fibonacci retracement and extension calculations. This indicator automatically draws key pivot points (PP, R1, R2, S1, S2) as well as additional extension levels (R3, R4, S3, S4), helping traders identify potential reversal and breakout zones with ease. It includes customizable alerts and push notifications, allowing traders to receive updates whenever the pr
FXC iMACD-DivergencE MT5 Indicator This is an advanced MACD indicator that finds trend-turn divergences on the current symbol. The indicator detects divergence between the MACD and the price movements as a strong trend-turn pattern. Main features: Advanced divergence settings Price based on Close, Open or High/Low prices Give Buy/Sell open signals PUSH notifications E-mail sending Pop-up alert Customizeable Information panel Input parameters: MACD Fast-EMA: The Fast-EMA variable of the MACD indi
RBreaker Gold Indicatorsは、金先物の短期日内取引戦略であり、トレンドフォローと日内反転の2つの取引手法を組み合わせたものです。トレンド相場での利益を捉えるだけでなく、相場が反転した際には迅速に利確し、その流れに沿ってポジションを反転させることができます。 この戦略は、アメリカの雑誌『Futures Truth』において、15年連続で最も収益性の高い取引戦略トップ10に選ばれた実績を持ち、非常に長いライフサイクルを誇り、現在も国内外で広く使用・研究されています。 本インディケーターは、2026年の金先物の値動きに対応し、14日間のATR指標に基づいて、ブレイクアウト係数A、観察係数B、リバーサル係数Rをより合理的な値で定義しています。非常に優れたインディケーターであり、安定的な年間収益を実現しています。ぜひおすすめします〜
このプロダクトを購入した人は以下も購入しています
Neuro Poseidon is a new indicator by Daria Rezueva. It combines precise trading signals with adaptive TP/SL levels - creating best possible trades as a result! Message me and get  Neuro Poseidon Assistant  as a gift to automize your trading process! What makes it stand out? 1. Proven profitability on all assets and timeframes 2. Only confirmed BUY and SELL signals present on the chart 3. Adaptive TP & SL levels generated by the software for each trade 4. Easy to understand - suitable for al
PrimeScalping is a powerful trading companion designed to generate high-probability entry signals with dynamic TP/SL/DP levels based on volatility. Built-in performance tracking shows win/loss stats, PP1/PP2 hits, and success rates — all updated live. Key Features: Buy/Sell signals with adaptive volatility bands Real-time TP/SL/DP levels based on ATR Built-in MA Filter with optional ATR/StdDev volatility Performance stats panel (Success, Profit/Loss, PP1/PP2) Alerts via popup, sound, push, or e
SuperScalp Pro
Van Minh Nguyen
4.65 (26)
SuperScalp Pro – 高度なマルチフィルタースキャルピングインジケーターシステム SuperScalp Pro は、クラシックな Supertrend と複数のインテリジェント確認フィルターを組み合わせた高度なスキャルピングインジケーターです。M1 から H4 まで複数の時間足で効率的に動作し、XAUUSD、BTCUSD、主要 Forex 通貨ペア向けに最適化されています。 このインジケーターは明確な Buy / Sell シグナルを提供し、ATR に基づいてエントリー価格、Stop Loss、Take Profit を自動計算します。Fibonacci Take Profit 機能により、重要な価格帯で早期決済し、到達時に通知を送信します。 初期設定では Fibonacci Take Profit が有効化されており、より安定した取引体験を重視しています。チャートに適用するだけですぐ利用可能です。上級者向けに、すべてのパラメータは自由にカスタマイズできます。 完全なドキュメントは製品ブログにあります: [User Guide] SuperScalp Pro Auto T
このインジケーターを購入された方には、以下の特典を 無料 で提供しています: 各トレードを自動で管理し、ストップロスとテイクプロフィットを設定し、戦略ルールに基づいてポジションを決済する補助ツール 「Bomber Utility」 様々な銘柄に合わせたインジケーターの設定ファイル(セットファイル) 「最小リスク」、「バランスリスク」、「待機戦略」 の3つのモードで使用できる Bomber Utility 用の設定ファイル このトレーディング戦略をすぐに導入・設定・開始できる ステップバイステップのビデオマニュアル ご注意: 上記の特典を受け取るには、MQL5のプライベートメッセージシステムを通じて販売者にご連絡ください。 オリジナルのカスタムインジケーター 「Divergence Bomber(ダイバージェンス・ボンバー)」 をご紹介します。これは、MACDのダイバージェンス(乖離)戦略に基づいた 「オールインワン」型のトレーディングシステム です。 このテクニカルインジケーターの主な目的は、価格とMACDインジケーターの間に発生するダイバージェンスを検出 し、将来の価格の動きを示す
Entry In The Zone and SMC Multi Timeframe is a real-time 2-in-1 market analysis tool that combines market structure analysis and a No Repaint BUY / SELL signal system into a single indicator, built on Smart Money Concepts (SMC) — a widely adopted framework used by professional traders to understand market structure. This indicator helps you see the market more clearly, make decisions based on structure rather than guesswork, and focus on high-probability zones where price is more likely to react
SignalTech MT5 is an unique fully rule based trading system for EURUSD, USDCHF, USDJPY, AUDUSD, NZDUSD, EURJPY, AUDJPY, NZDJPY, CADJPY.  All the winning trades with chart setups are published on the comments page. 2026-05 4107 Pips (Until 05-29 NY Closed) 2026-04 2243 Pips 2026-03 2165 Pips 2026-02 2937 Pips 2026-01 2624 Pips 2025-12 1174 Pips It can generate signals with Buy/Sell Arrows and Pop-Up/Sound Alerts. Each signal has clear Entry and Stop Loss levels, which should be automatically flag
Power Candles V3 - 自己最適化型強弱インジケーター Power Candles V3は 、通貨や銘柄の強さを、適用されたすべてのチャート上で実行可能なトレードプランに変換します。単にローソク足を色分けするだけでなく、バックグラウンドでリアルタイムの自動最適化を実行し、目の前の銘柄に対して最適なストップロス、テイクプロフィット、およびシグナルの閾値を提示します。ワンクリックで実取引に適用でき、エントリーポイント、ストップロス、テイクプロフィットのラインが正確な価格位置にチャート上に表示され、方向性を示すアラートがリアルタイムで発動します。 このツールは、Stein Investmentsのエコシステムの一部です。  18種類以上のツールをすべて閲覧し、AIを活用したセットアップの推奨事項を入手し、  https://stein.investments でコミュニティに参加しましょう クローズしたバーごとに3,000回以上のトレードシミュレーション。9つの強さの状態。2つの戦略を並行してテスト。勝率の高い設定をワンクリックで適用。 なぜこれが必要なのか ほとんどの強
この製品は 2026 年の市場向けに更新され、最新の MT5 ビルドに最適化されています。 価格更新のお知らせ: Smart Trend Trading System は現在 $99 で提供されています。 次の 30 件の購入 後、価格は $199 に上がります。 特別オファー: Smart Trend Trading System を購入後、私にプライベートメッセージを送ることで、 Smart Universal EA を無料 で受け取り、Smart Trend のシグナルを自動売買に変えることができます。 Smart Trend Trading System は、リペイントなし、再描画なし、遅延なしの完全なトレーディングシステムです。よりクリーンなシグナル、より明確なトレンド方向、そしてより整理された取引方法を求めるトレーダー向けに作られています。 Online course , manual and download presets . このシステムは、トレンド検出、反転ゾーン、Smart Cloud、トレーリングストップロジック、サポートとレジスタンス、ローソク足の色分け、ア
ご紹介     Quantum Breakout PRO は 、ブレイクアウト ゾーンの取引方法を変革する画期的な MQL5 インジケーターです。 13年以上の取引経験を持つ経験豊富なトレーダーのチームによって開発されました。     クォンタム ブレイクアウト プロ   は、革新的でダイナミックなブレイクアウト ゾーン戦略により、あなたのトレーディングの旅を新たな高みに押し上げるように設計されています。 クォンタム ブレイクアウト インジケーターは、5 つの利益ターゲット ゾーンを備えたブレイクアウト ゾーン上のシグナル矢印と、ブレイクアウト ボックスに基づいたストップロスの提案を提供します。 初心者トレーダーにもプロのトレーダーにも適しています。 量子EAチャネル:       ここをクリック 重要!購入後、インストールマニュアルを受け取るためにプライベートメッセージを送ってください。 推奨事項: 時間枠: M15 通貨ペア: GBPJPY、EURJPY、USDJPY、NZDUSD、XAUUSD アカウントの種類: ECN、Raw、またはスプレッドが非常に低い R
Azimuth Pro
Ottaviano De Cicco
5 (7)
Azimuth Pro V2:MT5向けシンセティック・フラクタル構造分析と確認済みエントリー 概要 Azimuth Pro は Merkava Labs によるマルチレベルスイング構造インジケーターです。4つのネストされたスイングレイヤー、スイングアンカーVWAP、ABCパターン検出、3タイムフレーム構造フィルタリング、そして確定バーでの確認済みエントリー — 1つのチャートで、ミクロスイングからマクロサイクルまでを網羅するワークフロー。 これはブラインドシグナル製品ではありません。ロケーション、コンテキスト、タイミングを重視するトレーダーのための構造ファーストワークフローです。 V2発売記念オファー — Azimuth Pro V2をUSD 399で(次の100本)。最終価格:USD 499。 1. V2での変更点 シンセティック・マルチタイムフレームエンジン 上位タイムフレーム分析をMeridian Proと同じ独自のシンセティックアーキテクチャで一から再構築。よりクリーンなHTFコンテキスト、安定したライブ動作、従来のMTF同期問題なし。シンセティックエンジンは 固定比率タ
Quantum TrendPulse を ご紹介します。これは、   SuperTrend   、   RSI   、および Stochastic のパワーを 1 つの包括的なインジケーターに組み合わせて、取引の可能性を最大限に引き出す究極の取引ツールです。精度と効率を求めるトレーダー向けに設計されたこのインジケーターは、市場のトレンド、勢いの変化、最適なエントリー ポイントとエグジット ポイントを自信を持って特定するのに役立ちます。 主な特徴: SuperTrend 統合: 現在の市場動向に簡単に追従し、収益性の波に乗ることができます。 RSI精度: 買われすぎと売られすぎのレベルを検出し、市場の反転のタイミングに最適で、SuperTrendのフィルターとして使用されます。 確率的精度: 確率的振動を活用して、変動の激しい市場で隠れたチャンスを見つけます。SuperTrend のフィルターとして使用されます。 マルチタイムフレーム分析:   M5 から H1 または H4 まで、さまざまなタイムフレームで市場を常に把握します。 カスタマイズ可能なアラート: カスタム取引条件が満たされ
FX Trend NG:次世代マルチマーケット・トレンドインテリジェンス 概要 FX Trend NG は、複数の時間足に対応したプロフェッショナル向けトレンド分析およびマーケット監視ツールです。 市場全体の構造を数秒で把握することができます。 複数のチャートを切り替える必要はありません。どの銘柄がトレンド中なのか、どこでモメンタムが弱まっているのか、そしてどの時間足で強い整合性があるのかを瞬時に確認できます。 ローンチ特別オファー – FX Trend NG を $30(6ヶ月) または $80 永久ライセンス でご利用いただけます。 すでに Stein Investments のユーザーですか? -> メッセージを送信 して、プライベートグループへアクセスしてください。 セットアップや詳細情報が必要ですか? -> Stein Investments 公式ページ をご覧ください。 1. FX Trend NG が他と異なる理由 3ステート・トレンドロジック ― Buy と Sell だけではない • 多くのインジケーターは Buy または Sell の2状態のみを表示します。
トレンドキャッチャーインジケーター トレンドキャッチャーインジケーターは、開発者独自の適応型トレンド分析指標を組み合わせることで、市場価格の動きを分析します。短期的なノイズを除去し、根底にあるモメンタムの強さ、ボラティリティの拡大、価格構造の挙動に焦点を当てることで、真の市場方向性を特定します。また、移動平均線、RSI、ボラティリティフィルターなどの平滑化およびトレンドフィルタリング機能を備えたカスタマイズ指標も使用します。 実際の運用状況のモニタリングやその他の製品については、こちらをご覧ください: https://www.mql5.com/en/users/mechanic/seller ご注意ください。私はTelegramでEAや設定を販売していません。詐欺です。すべての設定はブログで無料で公開しています。 重要!ご購入後すぐにご連絡ください。手順とボーナスをお送りします!
Gann Made Easy   は、ミスター・ギャンの理論を使用した取引の最良の原則に基づいた、プロフェッショナルで使いやすい外国為替取引システムです。 W・D・ガン。このインジケーターは、ストップロスとテイクプロフィットレベルを含む正確な買いと売りのシグナルを提供します。 PUSH通知を利用して外出先でも取引可能です。 ご購入後、取引方法の説明と優れた追加インジケーターを無料で入手するには、私にご連絡ください! おそらく、ギャンの取引手法についてはすでに何度も聞いたことがあるでしょう。通常、ギャンの理論は初心者のトレーダーだけでなく、すでにある程度の取引経験がある人にとっても非常に複雑なものです。なぜなら、ギャンの取引手法は理論的にはそれほど簡単に適用できるものではないからです。私はその知識を磨き、最良の原則を私の外国為替インジケーターに組み込むために数年を費やしました。 このインジケーターは非常に簡単に適用できます。必要なのは、それをチャートに添付し、簡単な取引推奨事項に従うだけです。このインジケーターは常に市場分析の仕事を行い、取引の機会を探します。適切なエントリーポイントを検
この製品は 2026 年の市場向けに更新され、最新の MT5 ビルドに最適化されています。 価格更新のお知らせ: Smart Price Action Concepts は現在 $200 で提供されています。 次の 30 件の購入 後、価格は $299 に上がります。 特別オファー: 購入後、私にプライベートメッセージを送ることで、 無料ボーナス + ギフト を受け取ることができます。 まず、このトレーディングツールはリペイントなし、再描画なし、遅延なしのインジケーターであり、プロフェッショナルな取引に最適であることを強調しておきます。 Online course , and manual Smart Price Action Concepts Indicator は、初心者から経験豊富なトレーダーまで使える非常に強力なツールです。20 種類以上の便利なインジケーターを 1 つにまとめ、Inner Circle Trader Analysis や Smart Money Concepts Trading Strategies などの高度な取引アイデアを組み合わせています。このインジケ
RelicusRoad Pro: 定量的市場オペレーティングシステム 【期間限定】無制限アクセス 70% OFF - 2,000人超のトレーダーと共に なぜ多くのトレーダーは「完璧な」インジケーターを使っても失敗するのでしょうか? それは、文脈を無視して 単一の概念 だけでトレードしているからです。文脈のないシグナルは単なるギャンブルです。勝ち続けるには、 根拠の重なり(コンフルエンス) が必要です。 RelicusRoad Proは単なる矢印インジケーターではありません。完全な 定量的市場エコシステム です。独自のボラティリティモデリングを用いて、価格が推移する「適正価値の道(Fair Value Road)」をマッピングし、ノイズと真の構造的ブレイクを判別します。 推測はやめましょう。機関投資家レベルの「ロード・ロジック」でトレードを。 コアエンジン:「Road」アルゴリズム システムの中心となる Road Algo は、市場環境にリアルタイムで適応するダイナミックなボラティリティチャネルです。 安全ライン(平衡点) と、価格が数学的に反転しやすい 拡張レベル を投影します。 Si
ARIPoint
Temirlan Kdyrkhan
1 (1)
ARIPoint is a powerful trading companion designed to generate high-probability entry signals with dynamic TP/SL/DP levels based on volatility. Built-in performance tracking shows win/loss stats, PP1/PP2 hits, and success rates all updated live. Key Features: Buy/Sell signals with adaptive volatility bands Real-time TP/SL/DP levels based on ATR Built-in MA Filter with optional ATR/StdDev volatility Performance stats panel (Success, Profit/Loss, PP1/PP2) Alerts via popup, sound, push, or email Cu
メタトレンドプロ   これは、トレードにおける推測を排除し、市場が既に決定を下したポイントを示すトレンドフォローツールです。この指標は、トレンド、動向、構造が変化する重要なポイントを特定し、主要プレーヤーがポジションを取るべき価格の戻り領域を強調表示します。 単に値動きを見るだけでなく、その背後にある論理を理解できます。すべてのシグナルはローソク足が確定した後に記録され、再描画されることなくチャートに保存されるため、自信を持って状況を分析し、意思決定を行うことができます。トレード目標(利益確定)も表示されます。 この指標の有効性について完全に確信を持っていただくために、自動統計機能をご利用いただけます。 方向転換のたびに、インジケーターはストップロスレベルとそのインテリジェントな段階的移動(Move SL)も表示します。これは非常に重要です。     削減   リスク   ポジション別。 損切り/利益確定/リスクリワード 右側の内蔵パネルには、現在の世界的なトレンドの方向における市場参入ポイントが表示され、過去のデータからもこれらのシグナルが確認できます。 任意の時間枠/ツール この指
M30/H1/H4スイング版もあります M5/M15では取りきれない大きな波を狙いたい方へ。 Gold Signal Swing Pro(M30/H1/H4対応)を販売中。 1トレードで$20〜$80+の値幅を狙う。 https://www.mql5.com/en/market/product/177643 KURAMA GOLD SIGNAL PRO(MT5版)— 7層フィルター搭載 XAUUSD完全トレードシステム リペイントなし。リドローなし。ラグなし。すべてのサインは確定後に変わりません。 購入者限定特典:買い切りライセンスをご購入いただいた方に、AI Zone Radar($59相当)+PDFマニュアルを無料プレゼント。購入後にMQL5でメッセージをお送りください。 AI Zone Radar: https://www.mql5.com/en/market/product/175834 ゴールドトレーダーのコミュニティで実際に使用され、精度と使いやすさで高評価。 あなたの問題
この製品は 2026 年の市場向けに更新され、最新の MT5 ビルドに最適化されています。 価格更新のお知らせ: Atomic Analyst は現在 $99 で提供されています。 次の 30 件の購入 後、価格は $199 に上がります。 特別オファー: Atomic Analyst を購入後、私にプライベートメッセージを送ることで、 Smart Universal EA を無料 で受け取り、Atomic Analyst のシグナルを自動売買に変えることができます。 Atomic Analyst は、リペイントなし、再描画なし、遅延なしの Price Action トレーディングインジケーターで、手動取引、シグナルの明確化、EA 自動化のために設計されています。 User manual: settings, inputs and strategy. 価格行動、強さ、モメンタム、マルチタイムフレーム方向、高度なフィルターを分析し、トレーダーがノイズを減らし、弱いセットアップを避け、より構造化された取引判断を行えるようにします。 このインジケーターは、複雑な市場計算をシンプルな視覚シ
FX Power: 通貨の強弱を分析して、より賢い取引を実現 概要 FX Power は主要通貨と金の実際の強弱をあらゆる市場状況で理解するための必須ツールです。強い通貨を買い、弱い通貨を売ることで、 FX Power は取引の意思決定を簡素化し、高い確率の取引機会を見出します。トレンドを追従する場合でも、極端なデルタ値を使用して反転を予測する場合でも、このツールはあなたの取引スタイルに完全に適応します。ただ取引するだけではなく、 FX Power で賢く取引をしましょう。 1. なぜ FX Power がトレーダーにとって非常に有益なのか 通貨と金のリアルタイム強弱分析 • FX Power は主要通貨と金の相対的な強弱を計算し、マーケットダイナミクスに関する明確な洞察を提供します。 • どの資産がリードしているか、または後れを取っているかを監視して、取引するペアを賢く選びましょう。 マルチタイムフレームの包括的なビュー • 短期、中期、長期のタイムフレームで通貨と金の強弱を追跡し、マーケットトレンドに基づいて取引戦略を調整できます。 • スキャルピングからスイングトレード
Meridian Pro
Ottaviano De Cicco
5 (2)
Meridian Pro 2.00:MT5向けプロ仕様マルチタイムフレーム・トレンドマトリクス Meridian Pro 2.00 は、MetaTrader 5 向けのプロ仕様の適応型トレンドマトリクスです。オリジナルの Meridian トレンドエンジン、クリーンなチャート ribbon、確定足ベースのシグナル矢印、8時間足 dashboard、Fuel momentum、weighted consensus、synthetic HTF processing、そしてチャート上に直接表示される上位足コンテキストラインを統合します。 目的はシンプルです。現在のトレンド、マルチタイムフレーム構造、強度、momentum、EA-ready 状態を、複数チャートに無関係なインジケータを重ねるのではなく、1つの整理された workflow で読むことです。 Meridian Pro の違い 1つの適応型エンジン - 同じ volatility-aware Meridian ロジックを M1 から W1 まで適用します。 Synthetic HTF architecture - 上位足行は下位足デ
M1 Quantum は、M1専用のプロフェッショナルトレーディングシステムであり、ストップロス、テイクプロフィット、スマートな資金管理を内蔵した、迅速かつ正確な取引シグナルを提供します。 M1 Quantum は、 連続勝利 に重点を置いて口座を素早く成長させるために設計されたプロフェッショナルな資金管理を備えています。 M1 Quantum インジケーター の主な特徴 M1時間足 およびすべての 主要通貨ペア 向けに設計 すべての取引にストップロスとテイクプロフィットを設定 資金管理 を実装し、トレーダーが簡単に取引できるようサポート 高い勝率と高い 連続勝利 リペイントなし、遅延なし あらゆるトレーダーにとって理解しやすい M1 Quantum を使用するには、 M1 Quantum Assistant が必要です。この強力なツールは、M1 Quantum をご購入いただいたすべてのお客様に 無料 で提供されています。 M1 Quantum Assistant をダウンロード 私のMQL5 チャンネルに参加して、最新のアップデートや新製品のリリース情報を入手してください。
Crystal Heikin Ashi Signals - Professional Trend & Signal Detection Indicator Advanced Heikin Ashi Visualization with Intelligent Signal System for Manual & Automated Trading Final Price: $149 ---------> Price goes up $10 after every 10 sales . Limited slots available — act fast . Overview Crystal Heikin Ashi Signals is a professional-grade MetaTrader 5 indicator that combines pure Heikin Ashi candle visualization with an advanced momentum-shift detection system. Designed for both manual traders
MetaForecast M5
Vahidreza Heidar Gholami
5 (3)
MetaForecastは、価格データのハーモニクスに基づいて、どんな市場の未来を予測し視覚化します。市場が常に予測可能ではありませんが、価格にパターンがある場合、MetaForecastは可能な限り正確な未来を予測できます。他の類似製品と比較して、MetaForecastは市場のトレンドを分析することでより正確な結果を生成することができます。 入力パラメータ Past size (過去のサイズ) MetaForecastが将来の予測を生成するために使用するバーの数を指定します。モデルは選択したバー上に描かれた黄色の線で表されます。 Future size (将来のサイズ) 予測すべき将来のバーの数を指定します。予測された将来は、ピンクの線で表示され、その上に青い回帰線が描かれます。 Degree (程度) この入力は、MetaForecastが市場で行う分析のレベルを決定します。 Degree 説明  0 Degree 0の場合、価格の全てのピークや谷、そして詳細をカバーするために、「Past size」の入力に大きな値を使用することが推奨されています。  1 (推奨) Degre
マーケットメーカーのためのツール。 Meravith は次の機能を提供します: すべての時間足を分析し、現在有効なトレンドを表示します。 強気と弱気の出来高が等しくなる流動性ゾーン(出来高均衡)を強調表示します。 異なる時間足のすべての流動性レベルをチャート上に直接表示します。 テキスト形式の市場分析を生成し、参考情報として表示します。 現在のトレンドに基づいて目標値、サポートレベル、ストップロスを計算します。 取引のリスクリワード比を算出します。 口座残高に基づいてポジションサイズを計算し、潜在的な利益を推定します。 また、市場に大きな変化があった場合には警告を表示します。 インジケーターの主要ライン: 強気/弱気の出来高エグゾーストライン ― 目標値として機能します。 市場のトレンドを示すライン。市場が強気か弱気かによって色が変わり、トレンドのサポートとして機能します。主にその色が市場センチメントを示します。 出来高均衡ライン(Eq)。Eq(Volume Equilibrium)ラインはシステムの中核です。これは買い手と売り手の出来高のバランスポイントを表します。市場の流動性を示し
多くの矢印インジケーターは、シグナルだけを表示して、その後の判断をすべてトレーダーに任せてしまいます。KT Alpha Hunter Arrows は、完整なトレードプランをチャート上に提示します。 各シグナル矢印が表示されるたびに、エントリーライン、ストップロス、4つのテイクプロフィット水準、そして現在の銘柄と時間足が今トレードに値するかどうかを示すリアルタイムのエッジ判定が、すでに描画された状態で表示されます。付属の Trade Manager EA は、あなたが手動でエントリーした後の実行管理を担当し、相場が荒れて判断がぶれやすい場面でも規律あるトレードを保ちやすくします。リペイントなし。確定足シグナルのみ。Forex、ゴールド、指数、その他あなたが取引するあらゆる銘柄に対応します。 主な機能 リペイントしない買い矢印と売り矢印を、足の確定後にのみ表示。 各シグナルに、エントリーライン、構造的ストップロス、4つのテイクプロフィット水準を表示。 Edge Dashboard が、現在のチャートで買いセットアップと売りセットアップを別々に評価。 判定システム:No Edge、Mar
このダッシュボードは、選択されたシンボルの最新の利用可能なハーモニックパターンを表示するので、時間を節約し、より効率的に /   MT4バージョン 。 無料インジケーター:   Basic Harmonic Pattern インジケーター列 Symbol : 選択したシンボルが表示されます。 Trend :   強気または弱気 Pattern : パターンの種類(ガートレー、バタフライ、バット、カニ、サメ、サイファー、ABCD) Entry : エントリー価格 SL: ストップロス価格 TP1: 1回目の利食い価格 TP2: 2回目の利食い価格 TP3:   3回目の利食い価格 Current price :   現在値 Age (in bars):    最後に描画されたパターンの年齢 主な入力項目 Symbols:   "28 Major Currency Pairs "または "Selected Symbols "から選択。 Selected Symbols:   カンマで区切られた監視したいシンボル("EURUSD,GBPUSD,XAUUSD")。ブローカーがペアに接
スイングトレーディング は、トレンドの方向のスイングと可能な反転スイングを検出するように設計された最初のインジケーターです。トレーディングの文献で広く説明されているベースラインスイングトレーディングアプローチを使用します。インディケータは、いくつかの価格と時間のベクトルを調査して、全体的なトレンドの方向を追跡し、市場が売られ過ぎまたは買われ過ぎて修正の準備ができている状況を検出します。 [ インストールガイド | 更新ガイド | トラブルシューティング | よくある質問 | すべての製品 ] むち打ちを起こさずに市場スイングの利益 インジケーターは常にトレンドの方向を表示します 色付きの価格帯は機会のベースラインを表します 色付きのダッシュは、可能な反転スイングを表します この指標は、独自の品質とパフォーマンスを分析します 複数時間枠のダッシュボードを実装します カスタマイズ可能なトレンドおよびスイング期間 電子メール/サウンド/プッシュアラートを実装します インジケータは再描画またはバックペインティングではありません Swing Tradingとは Swing Tradingは
BTMM State Engine Pro is a MetaTrader 5 indicator for traders who use the Beat The Market Maker approach: Asian session context, kill zone timing, level progression, peak formation detection, and a multi-pair scanner from a single chart. It combines cycle state logic with a built-in scanner dashboard so you do not need the same tool on many charts at once. What it does Draws the Asian session range; session times can follow broker server offset or be set in inputs. Tracks level progression (L
作者のその他のプロダクト
Unlock the power of "Psychological Numbers" with RoundLevel . Large financial institutions, banks, and hedge funds don't place orders at random prices; they prefer round numbers (e.g., 1.1000, 105.00, 2000). These levels act as invisible magnets for price action, serving as high-probability support and resistance zones. Key Features: Universal Compatibility: Works perfectly on Forex, Gold (XAUUSD), Indices, and Stocks. Clean Visualization: Automatically draws horizontal levels without cluttering
Persian Ichimoku: The Next Generation of Fibonacci-Enhanced Trading Elevate your Ichimoku strategy with the most advanced and customizable Ichimoku indicator on the Market. The Persian Ichimoku is not just another Ichimoku cloner; it is a professional-grade trading powerhouse designed for traders who demand precision, flexibility, and deeper market insights. By merging classic Ichimoku Kinko Hyo logic with Fibonacci ratios and the innovative Quality Line , this tool redefines trend analysis. ###
Cross Alert Pro: The Ultimate Multi-Line & Multi-Timeframe Crossover Solution Are you tired of missing critical market entries because you couldn’t monitor multiple indicators and timeframes at once? Meet Cross Alert Pro — the most comprehensive and flexible crossover notification tool designed for serious traders who demand precision and versatility. Why Cross Alert Pro? In modern trading, a simple crossover is often the spark of a massive trend. Whether it’s an Ichimoku Kumo breakout, a Moving
MGH-CrossAlert Histogram — Know the Trend Direction at a Glance What if you could see the relationship between any two lines — not just as a crossover, but as a continuous, color-coded histogram right below your chart? MGH-CrossAlert Histogram is the visual companion to the CrossAlert Cloudy indicator. Instead of watching lines on the price chart, this version gives you a dedicated sub-window histogram that tells you — bar by bar — which line is dominant, how strong that dominance is, and exact
Multi-Timeframe MACD Divergence Detector Never miss a divergence again — across 6 timeframes, all at once. Overview Most MACD divergence indicators on the market are either inaccurate, overly simplistic, or plagued with repaint issues. MGH-MultiMACD-RD was built to solve all of that — and go much further. This is not just another MACD indicator. It is a multi-timeframe divergence engine that simultaneously monitors up to 6 timeframes on a single chart, detects every divergence with precision, an
Multi-Timeframe MACD Hidden Divergence Detector The trend continuation signal most traders never see — now detected automatically across 6 timeframes. Overview Regular divergence tells you when a trend may be reversing. Hidden divergence tells you when it is about to continue — and it is the signal that professional trend-following traders rely on most. The problem is that hidden divergence is significantly harder to spot than regular divergence, and virtually no indicator on MQL5 Market detects
Elevate your trading with the precision of "Big Figures." Financial markets are not driven by random numbers; they are driven by institutional liquidity. Central banks, hedge funds, and major commercial traders consolidate their orders at whole integer levels (e.g., 1.1000, 2000.00, 150.00). These are the "Psychological Magnets" where the real price action happens. RoundLevel Pro for MetaTrader 5 is a high-performance tool designed to visualize this invisible grid of institutional interest with
Persian Ichimoku Pro: The Fibonacci Evolution for MT5 Why settle for 1930s formulas when you can trade with 21st-century precision? Most traders fail with Ichimoku because they use static, outdated settings. Persian Ichimoku Pro breaks these limits by integrating Advanced Fibonacci Mathematics and the exclusive Future Quality Line —a combination never seen before in standard indicators. ### THE "UNFAIR ADVANTAGE": WHAT’S INSIDE? 1. The Quality Line (Your Trend Sentinel) This is the "Secret Sauce
MGH-CrossAlert (Cloudy Edition) — The Last Cross Alert Indicator You'll Ever Need What if every meaningful crossover on your chart came with an instant alert — no matter what lines you trade? Most cross-alert tools are built around a single idea: MA crosses MA. That's fine — until you need something more. MGH-CrossAlert was designed for traders who demand more : more flexibility, more signal types, more intelligence in how lines interact across time frames. This is not another moving average cro
MGH-CrossAlert Histogram — Know the Trend Direction at a Glance What if you could see the relationship between any two lines — not just as a crossover, but as a continuous, color-coded histogram right below your chart? MGH-CrossAlert Histogram is the visual companion to the CrossAlert Cloudy indicator. Instead of watching lines on the price chart, this version gives you a dedicated   sub-window histogram   that tells you — bar by bar — which line is dominant, how strong that dominance is, and e
Multi-Timeframe MACD Divergence Detector Never miss a divergence again — across 6 timeframes, all at once. Overview Most MACD divergence indicators on the market are either inaccurate, overly simplistic, or plagued with repaint issues.   MGH-MultiMACD-RD   was built to solve all of that — and go much further. This is not just another MACD indicator. It is a   multi-timeframe divergence engine   that simultaneously monitors up to 6 timeframes on a single chart, detects every divergence with preci
フィルタ:
レビューなし
レビューに返信