Multi Macd HD MT5
- 指标
- 版本: 1.0

MGH-MultiMACD-HD — 多周期 MACD 隐藏背离检测器
大多数交易者从未看到的趋势延续信号——现在可在 6 个时间周期上自动检测。
概述
常规背离告诉您趋势何时可能反转。隐藏背离告诉您趋势何时即将延续——这是专业趋势跟踪交易者最依赖的信号。问题在于,隐藏背离比常规背离明显更难发现,而 MQL5 Market 上几乎没有任何指标能够在多个时间周期上同时准确检测它。
MGH-MultiMA
CD-HD 彻底改变了这一点。它构建于与 MGH-MultiMACD-RD 相同的专有多周期引擎之上,专门致力于隐藏背离检测——同时监控最多 6 个时间周期,在价格图表和 MACD 窗口上绘制精确的背离线,并在确认的形态形成时立即提醒您。这一切均无重绘。
什么是隐藏背离——它为何重要?
大多数交易者在学习初期就掌握了常规背离。学习隐藏背离的人较少。而几乎没有人拥有能够可靠检测它的工具。
隐藏看涨背离出现于价格创出更高的低点而 MACD 创出更低的低点时。它表明:尽管表面上出现回调,潜在的看涨动能依然完好——趋势很可能向上恢复。
隐藏看跌背离出现于价格创出更低的高点而 MACD 创出更高的高点时。它表明:在短暂的修正反弹之下,卖压依然占主导——下跌趋势很可能延续。
这些不是反转信号。它们是趋势延续信号——是技术交易者可用的最高概率形态之一,在所有品种和所有时间周期上稳定出现。挑战始终在于准确且实时地检测它们。MGH-MultiMACD-HD 彻底解决了这一挑战。
为什么大多数隐藏背离工具会失败
隐藏背离检测很少被良好实现,原因归结为大多数指标从未解决的三个核心问题:
- 单周期盲区——它们仅在当前图表上显示隐藏背离,错失了来自更高周期的结构性背景。
- 重绘——出现在形成中 K 线上的信号会在 K 线收盘后消失,使历史表现看起来比实际更好。
- 摆动点检测不精确——对定义隐藏背离的枢轴点识别错误,导致虚假信号和错失形态。
MGH-MultiMACD-HD 专为解决这三个问题而构建。摆动点检测算法精确。当设为 K 线 1 时,信号确认无重绘。而多周期引擎使其成为市场上唯一同时监控六个时间周期的隐藏背离工具。
主要功能
多周期隐藏背离——完整视图
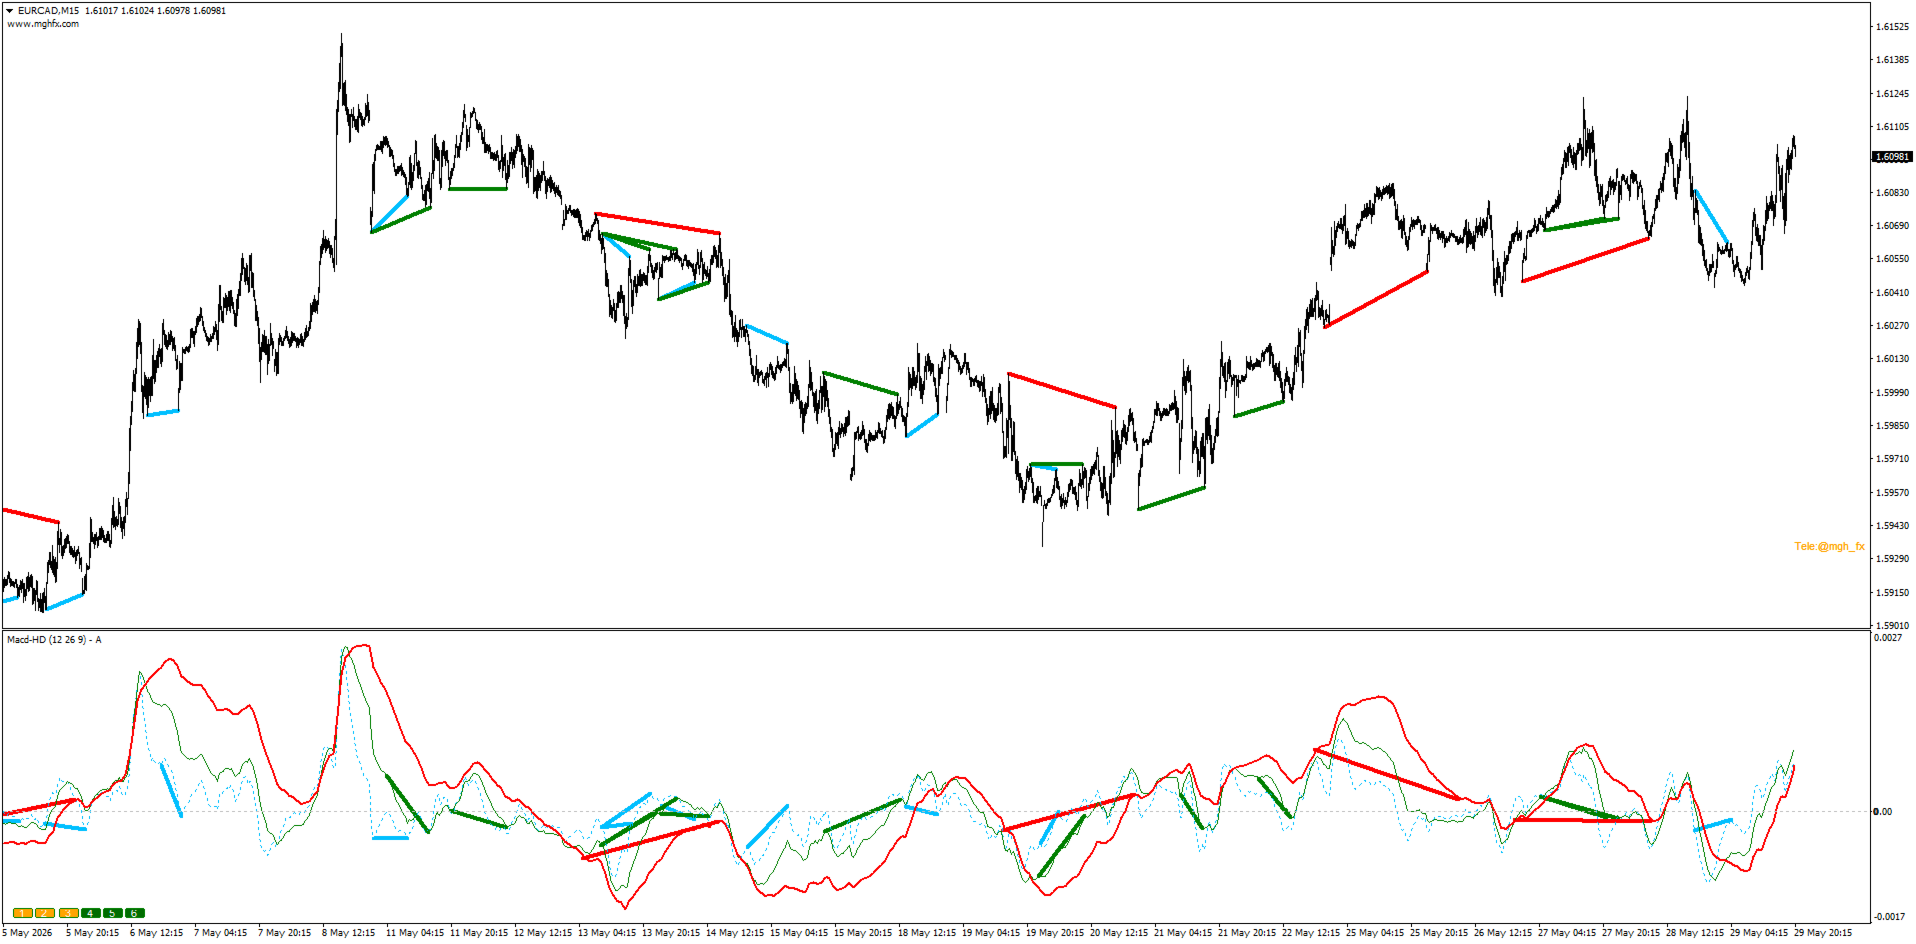
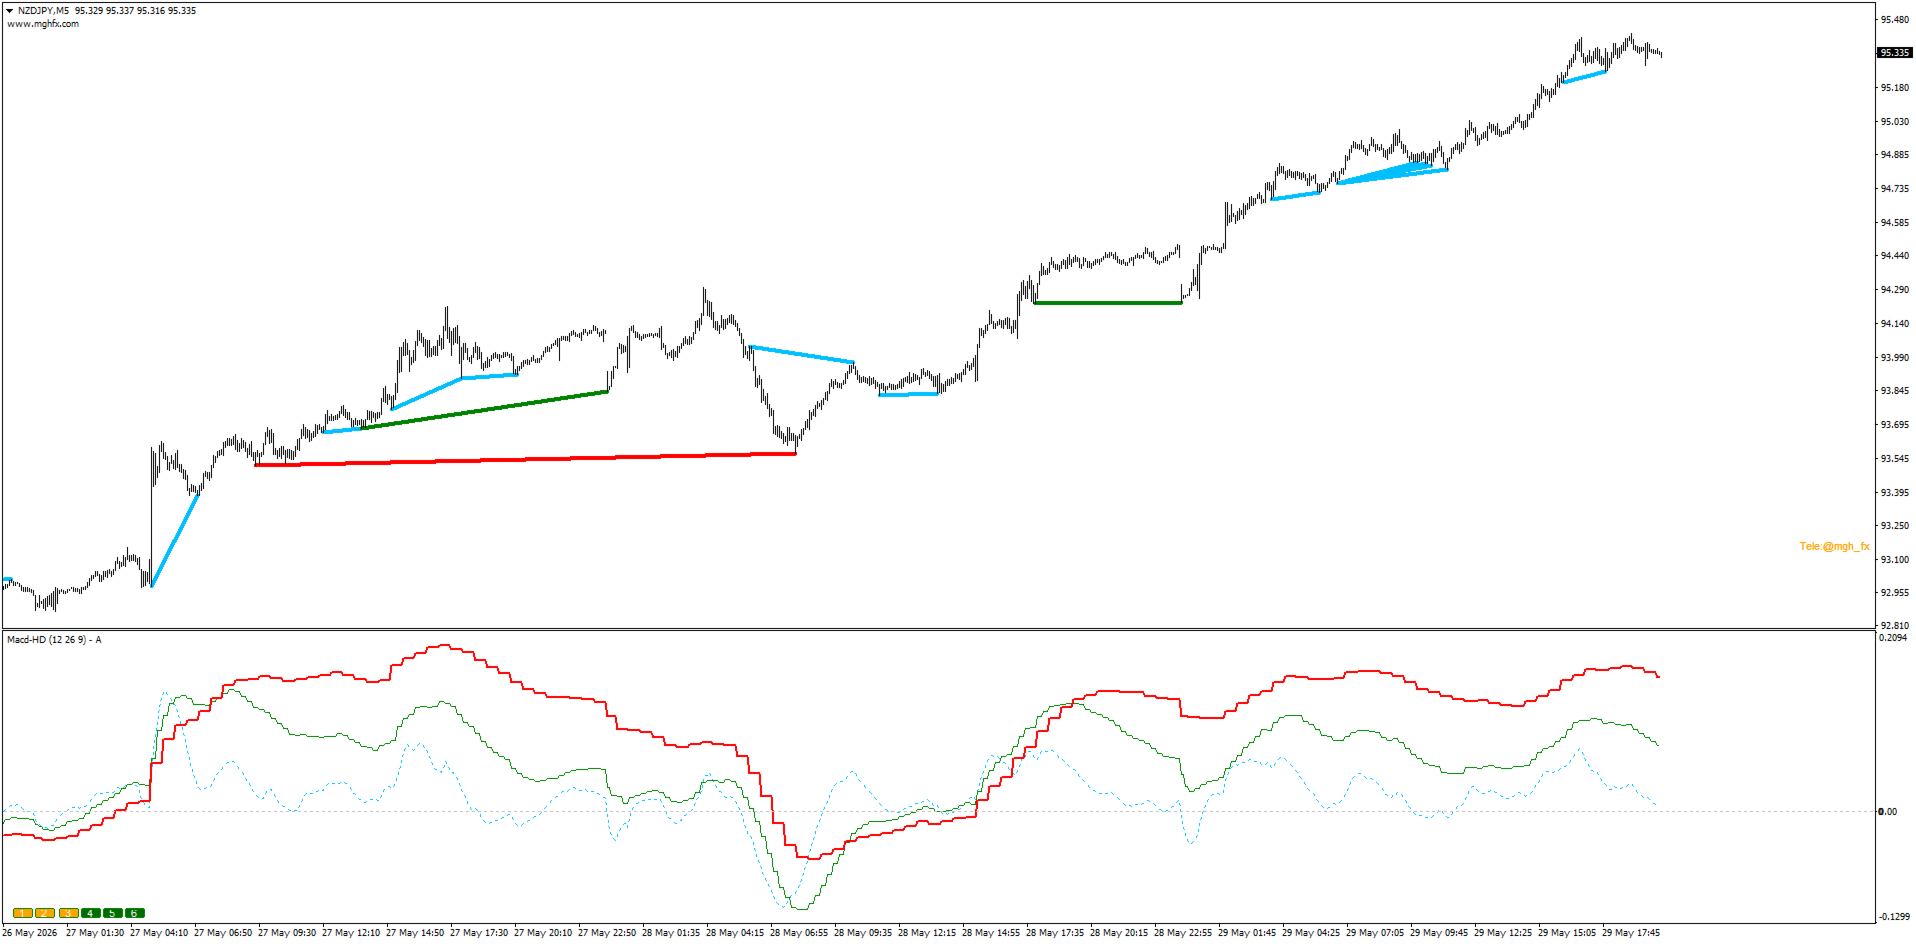
同时监控当前周期以及最多 5 个更高周期。每个周期的 MACD 以其独特的颜色显示,且在任何活动周期上检测到的每一个隐藏背离都会立即在图表上标记。价格图表上每条背离线的颜色与指标窗口中对应的 MACD 线相匹配,因此图表信号与振荡器背景之间的关系始终清晰。
六个图层自动映射到您当前图表周期以及其上方的 5 个标准更高周期——因此只需更改图表周期,即可相应地移动整组被监控的周期。您可以使用图表按钮(1–6)或从 Inputs 面板即时开关任意图层。(在支持更广泛周期范围的 MT5 版本中,可为每个图层手动选择任意周期。)
零重绘——自信交易
Signal Candle Shift 让您完全掌控:设为 1 可获得永不重绘的已确认收盘 K 线信号,或设为 0 可在形成中的 K 线上获得实时信号(若您偏好更快入场)。设为 1 时,您看到的每个信号都是最终的——指标无法也不会更改历史输出。
精确摆动点检测
核心算法识别定义有效隐藏背离的精确摆动高点和低点——而非近似值、非前视偏差、非事后绘制的装饰性线条。背离线连接价格与 MACD 出现分歧的精确枢轴点,为您呈现价格行为与动能之间结构关系的清晰、准确图景。
扩展背离范围
Increase Divergence Range 参数扩展回溯窗口,可检测在时间上相距甚远的摆动点之间形成的隐藏背离。标准指标会完全错失这些。MGH-MultiMACD-HD 能够找到它们。
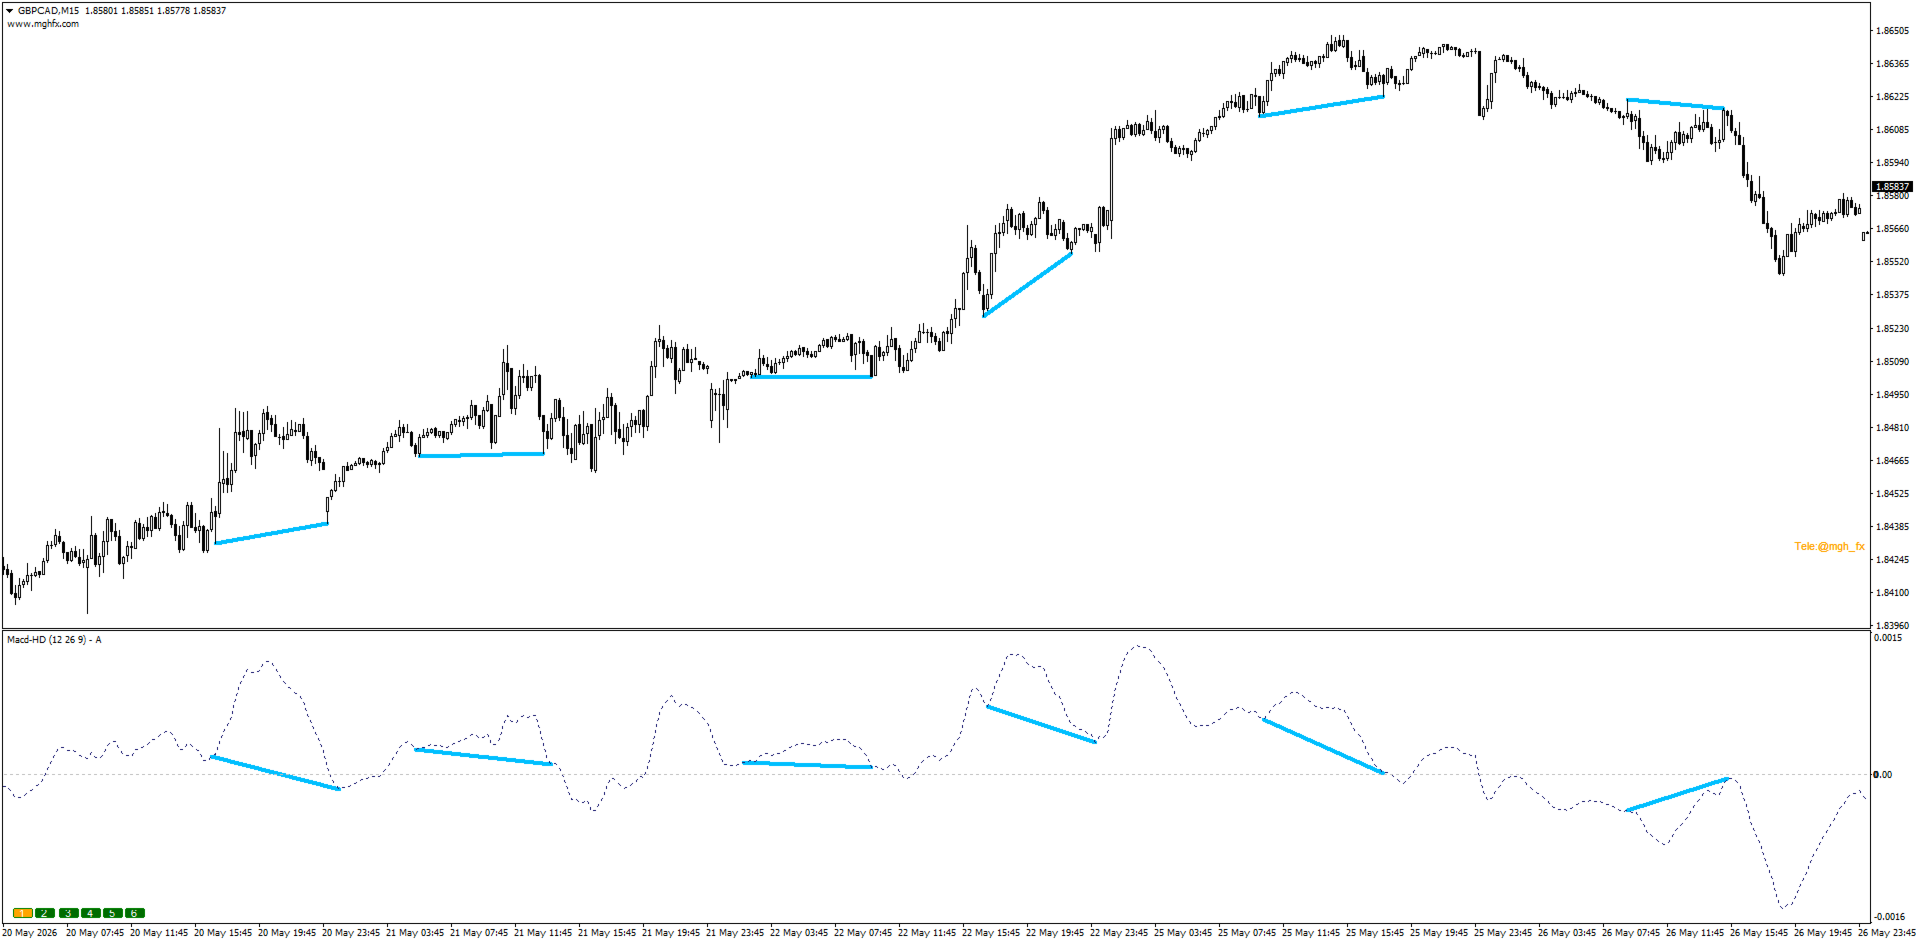
显示灵活性
可选择仅在价格图表、仅在指标窗口或两者同时显示背离线。「Only Price」模式产生最简洁的图表布局——背离结构直接显示在价格上,下方没有任何指标杂乱。
完整提醒系统
- 背离提醒——在任何活动周期上确认隐藏背离时立即触发
- 相位变化提醒——MACD 穿越零轴时触发
- 柱状图/信号线穿越提醒——在动能交叉时触发
- 通过弹出窗口、声音(.wav)、电子邮件和推送通知传递——均可独立配置
跨周期隐藏背离——共振优势
单个周期上的隐藏背离已是有意义的信号。当相同的方向性倾向作为隐藏背离同时出现在两个或三个周期上时——例如同时出现在 M15、H1 和 H4 上——趋势延续的概率大幅提升。
MGH-MultiMACD-HD 使这些共振区域可见,并在它们形成时提醒您。这种多周期一致性是技术分析中最具确信度的形态之一,也是任何单周期指标永远无法向您展示的。
作为实用框架:将单周期隐藏背离用作现有策略中的趋势延续确认。将多周期共振区域——两个或更多周期在同一价格区域同时显示隐藏背离之处——用作独立的高概率趋势延续入场点。
实用场景
日内趋势交易 — 在清晰趋势中交易 M5 或 M15,但不确定回调是反转还是延续机会?启用 H1 或 H4 作为第二图层。当 M15 价格创出更高低点且 H1 MACD 同样显示隐藏看涨背离时,该回调几乎可以肯定是延续形态。
日线周期趋势跟踪 — 启用 Daily 和 Weekly 图层,以捕捉主要结构性水平上的隐藏背离。这些信号出现频率不高,但稳定地先于重大趋势延续行情。
结合更高周期背景的剥头皮 — 将 M1 或 M5 作为图层 1、H1 作为图层 2 运行。当更高周期通过隐藏背离确认趋势方向时,沿该方向的剥头皮入场具有结构性优势。
过滤反转陷阱 — 沿主导趋势方向的隐藏背离是趋势依然完好的直接确认。用它来避免逆势交易,并保持在动能的正确一侧。
插值模式
启用 Interpolate in MTF Mode,可将更高周期的 MACD 线平滑为简洁、连续的曲线,而非阶梯函数图。这是一种视觉偏好——底层信号逻辑完全相同——但在同时显示多个周期时,它能产生明显更简洁的图表输出。
设置参考
| 参数 | 说明 |
|---|---|
| Indicator Name | 指标子窗口标题中显示的标签 |
| Number of Candles | 回溯周期(0 = 全部历史) |
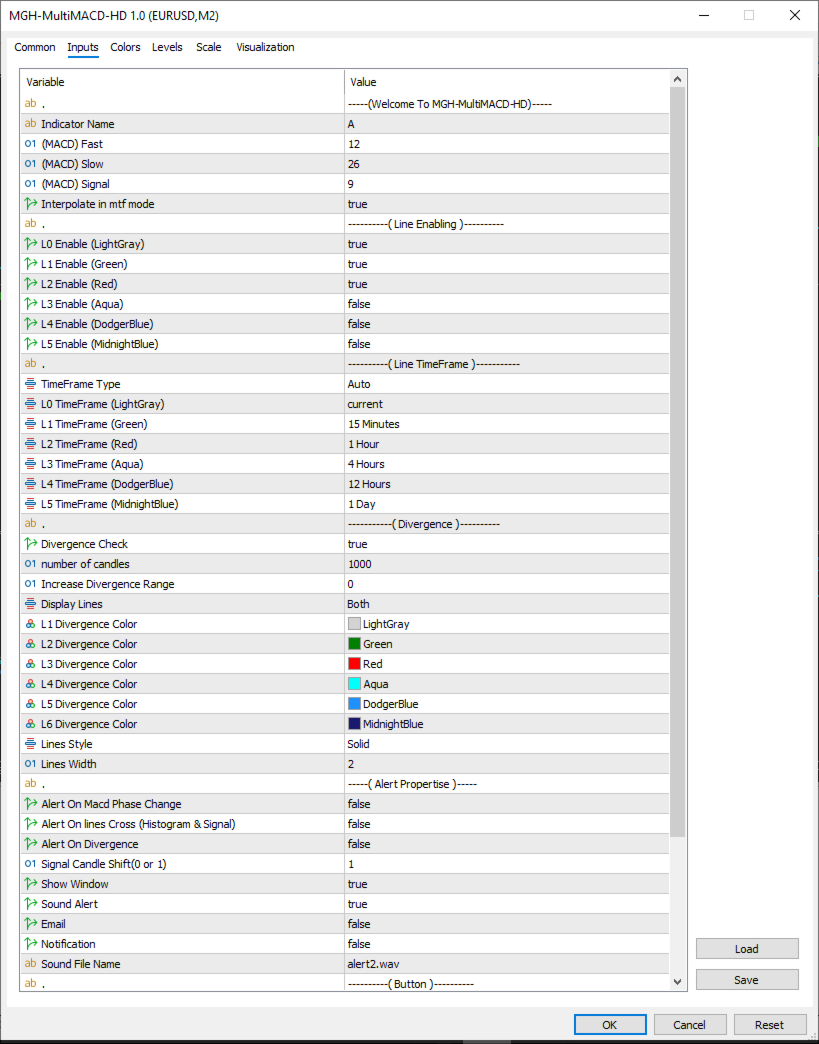
| MACD Fast / Slow / Signal | 标准 MACD 参数——默认 12、26、9 |
| Interpolate in MTF Mode | 平滑更高周期的 MACD 线以获得更简洁的视觉效果 |
| L1 – L6 Enable | 独立启用或禁用每个周期图层。图层自动映射到当前图表周期及其上方的 5 个更高周期(MT4)。MT5 版本支持手动按图层选择周期。 |
| Divergence Check | 隐藏背离检测的主开关 |
| Increase Divergence Range | 扩展回溯以检测宽范围隐藏背离 |
| Display Lines | 仅价格图表 / 仅指标窗口 / 两者 |
| L1 – L6 Divergence Color | 每个活动周期的独立背离线颜色 |
| Lines Style / Width | 所有背离线的视觉样式和粗细 |
| Alert On Phase Change | MACD 穿越零轴时提醒 |
| Alert On Lines Cross | 柱状图/信号线交叉时提醒 |
| Alert On Divergence | 确认隐藏背离检测时提醒 |
| Signal Candle Shift (0 or 1) | 0 = 实时;1 = 确认,无重绘 |
| Show Window | 开关指标子窗口 |
| Sound Alert / Email / Notification | 提醒传递方式 |
| Sound File Name | 声音提醒的自定义 .wav 文件路径 |
| Display Button | 显示或隐藏图表周期切换按钮 |
| X / Y Position | 图表上按钮面板的位置 |
MGH MultiMACD 生态系统
MGH-MultiMACD-HD 是一个双指标系统的一部分,旨在为交易者提供完整的背离覆盖:
| 指标 | 类型 | 用途 |
|---|---|---|
| MGH-MultiMACD-RD | 常规背离 | 识别潜在的趋势反转 |
| MGH-MultiMACD-HD | 隐藏背离 | 确认趋势延续形态 |
两者结合使用,这两款指标可提供所有周期上 MACD 背离的完整图景——趋势结束时的反转信号,趋势恢复时的延续信号。MQL5 Market 上没有任何其他指标组合能在统一的、颜色编码的视觉系统中提供如此程度的多周期背离覆盖。
技术规格
- 平台: MetaTrader 4/5
- 指标类型: 基于 MACD 的隐藏背离,多周期
- 重绘: 无(当 Signal Candle Shift = 1 时)
- 提醒: 声音、电子邮件、推送通知、弹出窗口
- 默认 MACD 设置: 12 / 26 / 9
- 支持的周期: 当前周期 + 5 个更高周期同时显示(自动映射)。MT5 版本支持手动按图层选择周期。
免费试用
演示版本可直接从 MQL5 Market 下载。将其附加到任意图表,启用两到三个周期,看看您当前工具一直错失的趋势延续信号——有多少隐藏背离会出现在您的活动货币对上。加载指标后几分钟内即可看到差异。
如果您顺势交易,这就是让您持续留在趋势中的指标。
由 MGHFX 开发 | Telegram: @mgh_fx
MT5 版本: https://www.mql5.com/en/market/product/179985


Thank you so much its good