Automating Trading Strategies in MQL5 (Part 31): Creating a Price Action 3 Drives Harmonic Pattern System

Introduction
In our previous article (Part 30), we developed an AB=CD Pattern system in MetaQuotes Language 5 (MQL5) that detected bullish and bearish AB=CD harmonic patterns using Fibonacci ratios, automating trades with calculated entry, stop loss, and take-profit levels, visualized through chart objects like triangles and trendlines. In Part 31, we create a 3 Drives pattern system that identifies bullish and bearish 3 Drives harmonic patterns through pivot points and specific Fibonacci retracements and extensions. The system executes trades with customizable take-profit and stop-loss options, enhanced by visual triangles, trendlines, and labels for clear pattern representation. We will cover the following topics:
By the end, you’ll have a robust MQL5 strategy for 3 Drives harmonic pattern trading, ready for customization—let’s dive in!
Understanding the 3 Drives Harmonic Pattern Framework
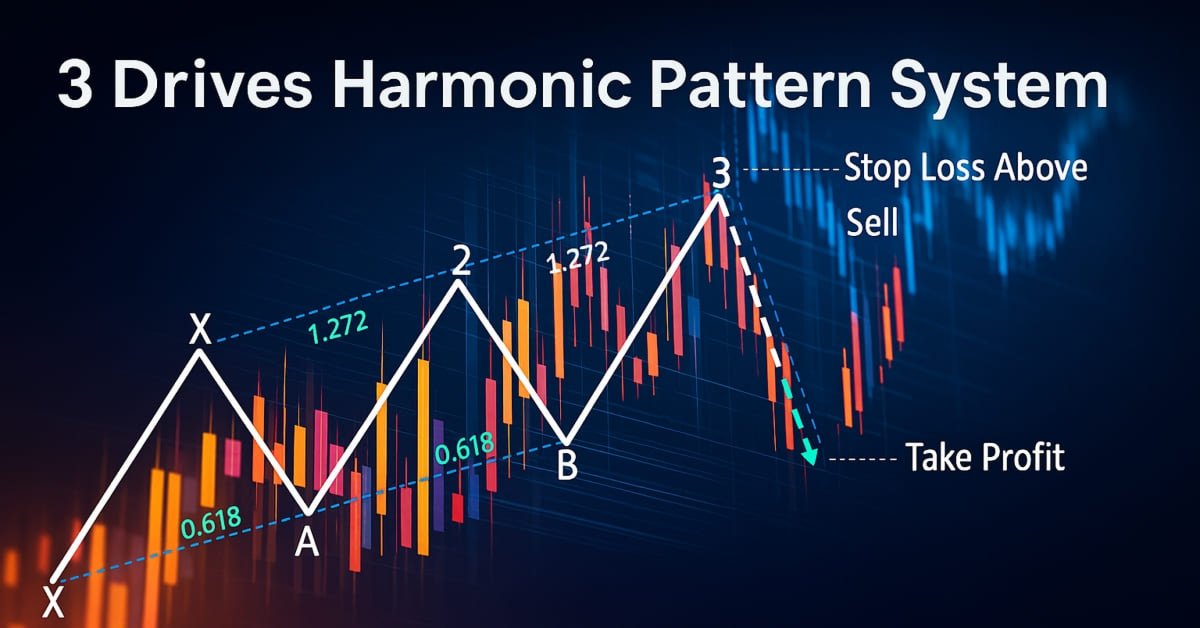
The 3 Drives pattern is a harmonic trading formation defined by six key swing points—A, B, C, D, E, and F—existing in bullish and bearish forms, designed to identify reversal zones through a series of three consecutive price drives with specific Fibonacci retracements and extensions. In a bullish 3 Drives pattern, the structure forms a high-low-high-low-high-low sequence where A is a swing high, B a swing low (first drive), C a swing high, D a swing low (second drive), E a swing high, and F a swing low (third drive, below D and B), with each retracement (BC, DE) at approximately 0.618 or 0.786 of the prior drive and each drive (CD, EF) extending 1.13 to 1.618 of the prior retracement; a bearish pattern reverses this sequence with F above D and B. Here is a visualization of the patterns:
Bearish Harmonic 3 Drives pattern:

Bullish Harmonic 3 Drives pattern:

Our approach involves detecting these swing pivots within a specified bar range, validating the pattern’s legs against Fibonacci criteria, visualizing the A-B-C-D-E-F structure with chart objects like triangles and trendlines, and executing trades at the F point with customizable stop loss (Fibonacci-based or fixed) and take-profit levels (0.382, 0.618, or E pivot) to capitalize on anticipated reversals. Let’s proceed to the implementation!
Implementation in MQL5
To create the program in MQL5, open the MetaEditor, go to the Navigator, locate the Indicators folder, click on the "New" tab, and follow the prompts to create the file. Once it is made, in the coding environment, we will need to declare some global variables that we will use throughout the program.
//+------------------------------------------------------------------+
//|                                          3 Drives Pattern EA.mq5 |
//|                        Copyright 2025, Forex Algo-Trader, Allan. |
//|                                 "https://t.me/Forex_Algo_Trader" |
//+------------------------------------------------------------------+
#property copyright "Forex Algo-Trader, Allan"
#property link "https://t.me/Forex_Algo_Trader"
#property version "1.00"
#property description "This EA trades based on 3 Drives Strategy"
#property strict

//--- Include the trading library for order functions
#include <Trade\Trade.mqh>   //--- Include Trade library
CTrade obj_Trade;            //--- Instantiate a obj_Trade object
//--- Enumeration for TP levels
enum ENUM_TAKE_PROFIT_LEVEL {
   TP1 = 1, // 0.382 Fibonacci Retracement
   TP2 = 2, // 0.618 Fibonacci Retracement
   TP3 = 3  // Pivot E Price
};
//--- Enumeration for SL types
enum ENUM_STOP_LOSS_TYPE {
   SL_FIBO = 1, // Fibonacci Extension
   SL_FIXED = 2 // Fixed Points
};
//--- Input parameters for user configuration
input int PivotLeft = 5;                              // Number of bars to the left for pivot check
input int PivotRight = 5;                             // Number of bars to the right for pivot check
input double Tolerance = 0.10;                        // Allowed deviation (10% of move)
input double LotSize = 0.01;                          // Lot size for new orders
input bool AllowTrading = true;                       // Enable or disable trading
input ENUM_TAKE_PROFIT_LEVEL TakeProfitLevel = TP2;   // Take Profit Level
input ENUM_STOP_LOSS_TYPE StopLossType = SL_FIBO;     // Stop Loss Type
input double SL_FiboExtension = 1.618;                // Fibonacci Extension for SL
input double SL_FixedPoints = 50;                     // Fixed Points for SL (in points)
//---------------------------------------------------------------------------
//--- 3 Drives pattern definition:
//
//--- Bullish 3 Drives:
//--- Pivots (A-B-C-D-E-F): A swing high, B swing low (drive 1), C swing high, D swing low (drive 2), E swing high, F swing low (drive 3).
//--- Retracements at 0.618, drives at 1.272 extensions.
//
//--- Bearish 3 Drives:
//--- Pivots (A-B-C-D-E-F): A swing low, B swing high (drive 1), C swing low, D swing high (drive 2), E swing low, F swing high (drive 3).
//--- Retracements at 0.618, drives at 1.272 extensions.
//---------------------------------------------------------------------------
//--- Structure for a pivot point
struct Pivot {
   datetime time; //--- Bar time of the pivot
   double price;  //--- Pivot price (High for swing high, low for swing low)
   bool isHigh;   //--- True if swing high; false if swing low
};
//--- Global dynamic array for storing pivots in chronological order
Pivot pivots[]; //--- Declare a dynamic array to hold identified pivot points
//--- Global variables to lock in a pattern (avoid trading on repaint)
int g_patternFormationBar = -1; //--- Bar index where the pattern was formed (-1 means none)
datetime g_lockedPatternA = 0;  //--- The key A pivot time for the locked pattern
//--- Global array to track traded patterns (using A.time as identifier)
datetime tradedPatterns[];
To establish the foundation for the 3 Drives pattern, first, we include the "<Trade\Trade.mqh>" library and instantiate "obj_Trade" as a CTrade object to manage trade operations like executing buy and sell orders. Then, we define enumerations "ENUM_TAKE_PROFIT_LEVEL" (TP1 for 0.382, TP2 for 0.618, TP3 for pivot E price) and "ENUM_STOP_LOSS_TYPE" (SL_FIBO for Fibonacci extension, SL_FIXED for fixed points) for flexible trade settings, and set input parameters: "PivotLeft" and "PivotRight" at 5 bars for pivot detection, "Tolerance" at 0.10 for Fibonacci deviation, "LotSize" at 0.01, "AllowTrading" as true, "TakeProfitLevel" as TP2, "StopLossType" as SL_FIBO, "SL_FiboExtension" at 1.618, and "SL_FixedPoints" at 50.
Next, we define the "Pivot" structure with "time", "price", and "isHigh" to store swing points, declare "pivots" as a dynamic array, and initialize globals "g_patternFormationBar" to -1, "g_lockedPatternA" to 0 for pattern locking, and "tradedPatterns" as an array to track traded patterns using A’s time. This setup provides the core framework for detecting and trading 3 Drives patterns. For visualization, we can have functions to draw lines, labels, and triangles.
//+------------------------------------------------------------------+
//| Helper: Draw a filled triangle                                   |
//+------------------------------------------------------------------+
void DrawTriangle(string name, datetime t1, double p1, datetime t2, double p2, datetime t3, double p3, color cl, int width, bool fill, bool back) {
   //--- Attempt to create a triangle object with three coordinate points
   if(ObjectCreate(0, name, OBJ_TRIANGLE, 0, t1, p1, t2, p2, t3, p3)) {
      //--- Set the triangle's color
      ObjectSetInteger(0, name, OBJPROP_COLOR, cl);
      //--- Set the triangle's line style to solid
      ObjectSetInteger(0, name, OBJPROP_STYLE, STYLE_SOLID);
      //--- Set the line width of the triangle
      ObjectSetInteger(0, name, OBJPROP_WIDTH, width);
      //--- Determine if the triangle should be filled
      ObjectSetInteger(0, name, OBJPROP_FILL, fill);
      //--- Set whether the object is drawn in the background
      ObjectSetInteger(0, name, OBJPROP_BACK, back);
   }
}
//+------------------------------------------------------------------+
//| Helper: Draw a trend line                                        |
//+------------------------------------------------------------------+
void DrawTrendLine(string name, datetime t1, double p1, datetime t2, double p2, color cl, int width, int style) {
   //--- Create a trend line object connecting two points
   if(ObjectCreate(0, name, OBJ_TREND, 0, t1, p1, t2, p2)) {
      //--- Set the trend line's color
      ObjectSetInteger(0, name, OBJPROP_COLOR, cl);
      //--- Set the trend line's style (solid, dotted, etc.)
      ObjectSetInteger(0, name, OBJPROP_STYLE, style);
      //--- Set the width of the trend line
      ObjectSetInteger(0, name, OBJPROP_WIDTH, width);
   }
}
//+------------------------------------------------------------------+
//| Helper: Draw a dotted trend line                                 |
//+------------------------------------------------------------------+
void DrawDottedLine(string name, datetime t1, double p, datetime t2, color lineColor) {
   //--- Create a horizontal trend line at a fixed price level with dotted style
   if(ObjectCreate(0, name, OBJ_TREND, 0, t1, p, t2, p)) {
      //--- Set the dotted line's color
      ObjectSetInteger(0, name, OBJPROP_COLOR, lineColor);
      //--- Set the line style to dotted
      ObjectSetInteger(0, name, OBJPROP_STYLE, STYLE_DOT);
      //--- Set the line width to 1
      ObjectSetInteger(0, name, OBJPROP_WIDTH, 1);
   }
}
//+------------------------------------------------------------------+
//| Helper: Draw anchored text label (for pivots)                    |
//| If isHigh is true, anchor at the bottom (label appears above);   |
//| if false, anchor at the top (label appears below).               |
//+------------------------------------------------------------------+
void DrawTextEx(string name, string text, datetime t, double p, color cl, int fontsize, bool isHigh) {
   //--- Create a text label object at the specified time and price
   if(ObjectCreate(0, name, OBJ_TEXT, 0, t, p)) {
      //--- Set the text of the label
      ObjectSetString(0, name, OBJPROP_TEXT, text);
      //--- Set the color of the text
      ObjectSetInteger(0, name, OBJPROP_COLOR, cl);
      //--- Set the font size for the text
      ObjectSetInteger(0, name, OBJPROP_FONTSIZE, fontsize);
      //--- Set the font type and style
      ObjectSetString(0, name, OBJPROP_FONT, "Arial Bold");
      //--- Anchor the text depending on whether it's a swing high or low
      if(isHigh)
         ObjectSetInteger(0, name, OBJPROP_ANCHOR, ANCHOR_BOTTOM);
      else
         ObjectSetInteger(0, name, OBJPROP_ANCHOR, ANCHOR_TOP);
      //--- Center-align the text
      ObjectSetInteger(0, name, OBJPROP_ALIGN, ALIGN_CENTER);
   }
}
We proceed to implement visualization functions to create clear chart representations of the 3 Drives harmonic pattern and its trade levels. First, we develop the "DrawTriangle" function, which uses ObjectCreate to draw a filled triangle (OBJ_TRIANGLE) defined by three points with times ("t1", "t2", "t3") and prices ("p1", "p2", "p3"), setting OBJPROP_COLOR to the specified color, "OBJPROP_STYLE" to "STYLE_SOLID", "OBJPROP_WIDTH" to the given width, "OBJPROP_FILL" to enable or disable filling, and "OBJPROP_BACK" to set background or foreground placement using the ObjectSetInteger function. Then, we proceed to create the "DrawTrendLine" function, which draws a trend line ("OBJ_TREND") between two points.
Next, we implement the "DrawDottedLine" function, which creates a horizontal dotted line (OBJ_TREND) at a specified price. Last, we develop the "DrawTextEx" function, which creates a text label (OBJ_TEXT) at coordinates ("t", "p") with "ObjectCreate", setting "OBJPROP_TEXT" to the specified text, "OBJPROP_COLOR", "OBJPROP_FONTSIZE", and "OBJPROP_FONT" to "Arial Bold" using ObjectSetString and "ObjectSetInteger", anchoring above for swing highs or below for lows based on "isHigh" with "OBJPROP_ANCHOR", and centering with "OBJPROP_ALIGN". We can now proceed to the OnTick event handler and attempt to identify pivot points that we can use later for pattern recognition. Here is the logic we use to achieve that.
//+------------------------------------------------------------------+
//| Expert tick function                                             |
//+------------------------------------------------------------------+
void OnTick() {
   //--- Declare a static variable to store the time of the last processed bar
   static datetime lastBarTime = 0;
   //--- Get the time of the current confirmed bar
   datetime currentBarTime = iTime(_Symbol, _Period, 1);
   //--- If the current bar time is the same as the last processed, exit
   if(currentBarTime == lastBarTime)
      return;
   //--- Update the last processed bar time
   lastBarTime = currentBarTime;

   //--- Clear the pivot array for fresh analysis
   ArrayResize(pivots, 0);
   //--- Get the total number of bars available on the chart
   int barsCount = Bars(_Symbol, _Period);
   //--- Define the starting index for pivot detection (ensuring enough left bars)
   int start = PivotLeft;
   //--- Define the ending index for pivot detection (ensuring enough right bars)
   int end = barsCount - PivotRight;

   //--- Loop through bars from 'end-1' down to 'start' to find pivot points
   for(int i = end - 1; i >= start; i--) {
      //--- Assume current bar is both a potential swing high and swing low
      bool isPivotHigh = true;
      bool isPivotLow = true;
      //--- Get the high and low of the current bar
      double currentHigh = iHigh(_Symbol, _Period, i);
      double currentLow = iLow(_Symbol, _Period, i);
      //--- Loop through the window of bars around the current bar
      for(int j = i - PivotLeft; j <= i + PivotRight; j++) {
         //--- Skip if the index is out of bounds
         if(j < 0 || j >= barsCount)
            continue;
         //--- Skip comparing the bar with itself
         if(j == i)
            continue;
         //--- If any bar in the window has a higher high, it's not a swing high
         if(iHigh(_Symbol, _Period, j) > currentHigh)
            isPivotHigh = false;
         //--- If any bar in the window has a lower low, it's not a swing low
         if(iLow(_Symbol, _Period, j) < currentLow)
            isPivotLow = false;
      }
      //--- If the current bar qualifies as either a swing high or swing low
      if(isPivotHigh || isPivotLow) {
         //--- Create a new pivot structure
         Pivot p;
         //--- Set the pivot's time
         p.time = iTime(_Symbol, _Period, i);
         //--- Set the pivot's price depending on whether it is a high or low
         p.price = isPivotHigh ? currentHigh : currentLow;
         //--- Set the pivot type (true for swing high, false for swing low)
         p.isHigh = isPivotHigh;
         //--- Get the current size of the pivots array
         int size = ArraySize(pivots);
         //--- Increase the size of the pivots array by one
         ArrayResize(pivots, size + 1);
         //--- Add the new pivot to the array
         pivots[size] = p;
      }
   }
}
Here, we implement the initial logic of the OnTick event handler. First, we declare a static "lastBarTime" initialized to 0 to track the last processed bar and compare it with "currentBarTime" obtained from iTime at shift 1 for the current symbol and period, exiting if unchanged to avoid redundant processing, and updating "lastBarTime" when a new bar is detected. Then, we proceed to clear the "pivots" array with ArrayResize to ensure a fresh analysis.
Next, we retrieve the total number of bars with Bars, set the pivot detection range with "start" as "PivotLeft" and "end" as total bars minus "PivotRight", and iterate through bars from "end - 1" to "start". For each bar, we assume it’s a swing high ("isPivotHigh" true) and low ("isPivotLow" true), obtain its high and low prices using iHigh and iLow, and validate the pivot by checking surrounding bars within "PivotLeft" and "PivotRight" with "iHigh" and "iLow", invalidating the pivot if any neighboring bar has a higher high or lower low. Last, if the bar qualifies as a pivot, we create a "Pivot" structure, set its "time" with "iTime", "price" to the high or low based on "isPivotHigh", and "isHigh" flag, then append it to the "pivots" array using ArrayResize and store it. We get the following array of data when we print the pivot structure.

With the data, we can extract the pivot points, and if we have enough pivots, we can analyze and detect the patterns. Here is the logic we implement to achieve that.
//--- Determine the total number of pivots found
int pivotCount = ArraySize(pivots);
//--- If fewer than six pivots are found, the pattern cannot be formed
if(pivotCount < 6) {
   //--- Reset pattern lock variables
   g_patternFormationBar = -1;
   g_lockedPatternA = 0;
   //--- Exit the OnTick function
   return;
}

//--- Extract the last six pivots as A, B, C, D, E, F
Pivot A = pivots[pivotCount - 6];
Pivot B = pivots[pivotCount - 5];
Pivot C = pivots[pivotCount - 4];
Pivot D = pivots[pivotCount - 3];
Pivot E = pivots[pivotCount - 2];
Pivot F = pivots[pivotCount - 1];

//--- Initialize a flag to indicate if a valid 3 Drives pattern is found
bool patternFound = false;
//--- Initialize pattern type
string patternType = "";
double used_ext = 0.0;
//--- Define fib ratios
double retr_levels[] = {0.618, 0.786};
double ext_levels[] = {1.13, 1.272, 1.618};
//--- Check for the high-low-high-low-high-low (Bullish reversal) structure
if(A.isHigh && (!B.isHigh) && C.isHigh && (!D.isHigh) && E.isHigh && (!F.isHigh)) {
   //--- Calculate drive 1
   double drive1 = A.price - B.price;
   if(drive1 > 0) {
      //--- Retrace A
      double retraceA = C.price - B.price;
      bool valid_retrA = false;
      double used_retrA = 0.0;
      for(int k=0; k<ArraySize(retr_levels); k++) {
         double ideal_retraceA = retr_levels[k] * drive1;
         if(MathAbs(retraceA - ideal_retraceA) <= Tolerance * drive1) {
            valid_retrA = true;
            used_retrA = retr_levels[k];
            break;
         }
      }
      if(valid_retrA) {
         //--- Drive 2
         double drive2 = C.price - D.price;
         bool valid_drive2 = false;
         double used_ext2 = 0.0;
         for(int k=0; k<ArraySize(ext_levels); k++) {
            double ideal_drive2 = ext_levels[k] * retraceA;
            if(MathAbs(drive2 - ideal_drive2) <= Tolerance * retraceA) {
               valid_drive2 = true;
               used_ext2 = ext_levels[k];
               break;
            }
         }
         if(valid_drive2) {
            //--- Retrace B
            double retraceB = E.price - D.price;
            bool valid_retrB = false;
            double used_retrB = 0.0;
            for(int k=0; k<ArraySize(retr_levels); k++) {
               double ideal_retraceB = retr_levels[k] * drive2;
               if(MathAbs(retraceB - ideal_retraceB) <= Tolerance * drive2) {
                  valid_retrB = true;
                  used_retrB = retr_levels[k];
                  break;
               }
            }
            if(valid_retrB) {
               //--- Drive 3
               double drive3 = E.price - F.price;
               bool valid_drive3 = false;
               for(int k=0; k<ArraySize(ext_levels); k++) {
                  double ideal_drive3 = ext_levels[k] * retraceB;
                  if(MathAbs(drive3 - ideal_drive3) <= Tolerance * retraceB) {
                     valid_drive3 = true;
                     used_ext = ext_levels[k];
                     break;
                  }
               }
               if(valid_drive3 && F.price < D.price && D.price < B.price) {
                  patternFound = true;
                  patternType = "Bullish";
               }
            }
         }
      }
   }
}
//--- Check for the low-high-low-high-low-high (Bearish reversal) structure
if((!A.isHigh) && B.isHigh && (!C.isHigh) && D.isHigh && (!E.isHigh) && F.isHigh) {
   //--- Calculate drive 1
   double drive1 = B.price - A.price;
   if(drive1 > 0) {
      //--- Retrace A
      double retraceA = B.price - C.price;
      bool valid_retrA = false;
      double used_retrA = 0.0;
      for(int k=0; k<ArraySize(retr_levels); k++) {
         double ideal_retraceA = retr_levels[k] * drive1;
         if(MathAbs(retraceA - ideal_retraceA) <= Tolerance * drive1) {
            valid_retrA = true;
            used_retrA = retr_levels[k];
            break;
         }
      }
      if(valid_retrA) {
         //--- Drive 2
         double drive2 = D.price - C.price;
         bool valid_drive2 = false;
         double used_ext2 = 0.0;
         for(int k=0; k<ArraySize(ext_levels); k++) {
            double ideal_drive2 = ext_levels[k] * retraceA;
            if(MathAbs(drive2 - ideal_drive2) <= Tolerance * retraceA) {
               valid_drive2 = true;
               used_ext2 = ext_levels[k];
               break;
            }
         }
         if(valid_drive2) {
            //--- Retrace B
            double retraceB = D.price - E.price;
            bool valid_retrB = false;
            double used_retrB = 0.0;
            for(int k=0; k<ArraySize(retr_levels); k++) {
               double ideal_retraceB = retr_levels[k] * drive2;
               if(MathAbs(retraceB - ideal_retraceB) <= Tolerance * drive2) {
                  valid_retrB = true;
                  used_retrB = retr_levels[k];
                  break;
               }
            }
            if(valid_retrB) {
               //--- Drive 3
               double drive3 = F.price - E.price;
               bool valid_drive3 = false;
               for(int k=0; k<ArraySize(ext_levels); k++) {
                  double ideal_drive3 = ext_levels[k] * retraceB;
                  if(MathAbs(drive3 - ideal_drive3) <= Tolerance * retraceB) {
                     valid_drive3 = true;
                     used_ext = ext_levels[k];
                     break;
                  }
               }
               if(valid_drive3 && F.price > D.price && D.price > B.price) {
                  patternFound = true;
                  patternType = "Bearish";
               }
            }
         }
      }
   }
}
First, we determine the total number of pivots with "ArraySize(pivots)" stored in "pivotCount" and exit if fewer than 6 pivots are found, resetting "g_patternFormationBar" and "g_lockedPatternA" to -1 and 0, as the 3 Drives pattern requires A, B, C, D, E, and F points.
Then, we proceed to extract the last six pivots from the "pivots" array, assigning "A" (earliest), "B", "C", "D", "E", and "F" (latest). Next, for a bullish pattern (A high, B low, C high, D low, E high, F low), we calculate drive 1 ("A.price - B.price"), validate retracement A ("C.price - B.price" at 0.618 or 0.786 of drive 1 within "Tolerance"), drive 2 ("C.price - D.price" at 1.13, 1.272, or 1.618 of retrace A), retracement B ("E.price - D.price" at 0.618 or 0.786 of drive 2), and drive 3 ("E.price - F.price" at 1.13, 1.272, or 1.618 of retrace B), ensuring "F.price < D.price < B.price", setting "patternFound" to true and "patternType" to "Bullish" if valid, and storing the used extension ("used_ext"). Last, for a bearish pattern (A low, B high, C low, D high, E low, F high), we apply similar validations for drive 1 ("B.price - A.price"), retrace A, drive 2, retrace B, and drive 3, ensuring "F.price > D.price > B.price", setting "patternFound" to true and "patternType" to "Bearish" if valid. If the pattern is found, we can proceed to visualize it on the chart.
//--- If a valid 3 Drives pattern is detected
if(patternFound) {
   //--- Print a message indicating the pattern type and detection time
   Print(patternType, " 3 Drives pattern detected at ", TimeToString(F.time, TIME_DATE|TIME_MINUTES|TIME_SECONDS));

   //--- Create a unique prefix for all graphical objects related to this pattern
   string signalPrefix = "3D_" + IntegerToString(A.time);

   //--- Choose triangle color based on the pattern type
   color triangleColor = (patternType=="Bullish") ? clrBlue : clrRed;

   //--- Draw the first triangle connecting pivots B, C, D
   DrawTriangle(signalPrefix+"_Triangle1", B.time, B.price, C.time, C.price, D.time, D.price,
                triangleColor, 2, true, true);
   //--- Draw the second triangle connecting pivots D, E, F
   DrawTriangle(signalPrefix+"_Triangle2", D.time, D.price, E.time, E.price, F.time, F.price,
                triangleColor, 2, true, true);
}
Here, we initiate the visualization of detected patterns on the chart. First, if a valid pattern is detected ("patternFound" is true), we log the detection with Print, outputting the "patternType" ("Bullish" or "Bearish") and the F pivot’s time formatted with TimeToString, including date, minutes, and seconds. Then, we proceed to create a unique identifier "signalPrefix" by concatenating "3D_" with "A.time" converted to a string using IntegerToString to ensure distinct naming for chart objects.
Next, we set "triangleColor" to blue for bullish patterns or red for bearish patterns to differentiate them visually. Last, we call "DrawTriangle" twice to visualize the pattern: first to draw the BCD triangle connecting pivots B, C, and D, and then to draw the DEF triangle connecting pivots D, E, and F, using "signalPrefix" with suffixes "_Triangle1" and "_Triangle2", respective pivot times and prices, "triangleColor", a width of 2, and enabling fill and background display with true flags. We get the following outcome.

From the image, we can see that we can map and visualize the detected pattern correctly. We now need to continue mapping the trendlines to fully make it visible within boundaries and add a label to it for easier identification of the levels.
//--- Draw boundary trend lines connecting the pivots for clarity
DrawTrendLine(signalPrefix+"_TL_AB", A.time, A.price, B.time, B.price, clrBlack, 2, STYLE_SOLID);
DrawTrendLine(signalPrefix+"_TL_BC", B.time, B.price, C.time, C.price, clrBlack, 2, STYLE_SOLID);
DrawTrendLine(signalPrefix+"_TL_CD", C.time, C.price, D.time, D.price, clrBlack, 2, STYLE_SOLID);
DrawTrendLine(signalPrefix+"_TL_DE", D.time, D.price, E.time, E.price, clrBlack, 2, STYLE_SOLID);
DrawTrendLine(signalPrefix+"_TL_EF", E.time, E.price, F.time, F.price, clrBlack, 2, STYLE_SOLID);

//--- Retrieve the symbol's point size to calculate offsets for text positioning
double point = SymbolInfoDouble(_Symbol, SYMBOL_POINT);
//--- Calculate an offset (15 points) for positioning text above or below pivots
double offset = 15 * point;

//--- Determine the Y coordinate for each pivot label based on its type
double textY_A = (A.isHigh ? A.price + offset : A.price - offset);
double textY_B = (B.isHigh ? B.price + offset : B.price - offset);
double textY_C = (C.isHigh ? C.price + offset : C.price - offset);
double textY_D = (D.isHigh ? D.price + offset : D.price - offset);
double textY_E = (E.isHigh ? E.price + offset : E.price - offset);
double textY_F = (F.isHigh ? F.price + offset : F.price - offset);

//--- Draw text labels for each pivot with appropriate anchoring
DrawTextEx(signalPrefix+"_Text_A", "A", A.time, textY_A, clrBlack, 11, A.isHigh);
DrawTextEx(signalPrefix+"_Text_B", "B", B.time, textY_B, clrBlack, 11, B.isHigh);
DrawTextEx(signalPrefix+"_Text_C", "C", C.time, textY_C, clrBlack, 11, C.isHigh);
DrawTextEx(signalPrefix+"_Text_D", "D", D.time, textY_D, clrBlack, 11, D.isHigh);
DrawTextEx(signalPrefix+"_Text_E", "E", E.time, textY_E, clrBlack, 11, E.isHigh);
DrawTextEx(signalPrefix+"_Text_F", "F", F.time, textY_F, clrBlack, 11, F.isHigh);

//--- Calculate the central label's time as the midpoint between pivots A and D
datetime centralTime = (A.time + D.time) / 2;
//--- Set the central label's price at pivot F's price
double centralPrice = F.price;
//--- Create the central text label indicating the pattern type
if(ObjectCreate(0, signalPrefix+"_Text_Center", OBJ_TEXT, 0, centralTime, centralPrice)) {
   ObjectSetString(0, signalPrefix+"_Text_Center", OBJPROP_TEXT,
      (patternType=="Bullish") ? "Bullish 3 Drives" : "Bearish 3 Drives");
   ObjectSetInteger(0, signalPrefix+"_Text_Center", OBJPROP_COLOR, clrBlack);
   ObjectSetInteger(0, signalPrefix+"_Text_Center", OBJPROP_FONTSIZE, 11);
   ObjectSetString(0, signalPrefix+"_Text_Center", OBJPROP_FONT, "Arial Bold");
   ObjectSetInteger(0, signalPrefix+"_Text_Center", OBJPROP_ALIGN, ALIGN_CENTER);
}
We further enhance the visualization of detected patterns by adding detailed chart objects to clearly depict the pattern structure. First, we draw five solid trend lines using "DrawTrendLine" with the unique "signalPrefix" to connect key pivot points: AB, BC, CD, DE, and EF, using pivot times and prices (e.g., "A.time", "A.price"), setting OBJPROP_COLOR to "clrBlack", "OBJPROP_WIDTH" to 2, and "OBJPROP_STYLE" to "STYLE_SOLID" with ObjectSetInteger to outline the pattern’s legs. Then, we retrieve the symbol’s point size with SymbolInfoDouble(_Symbol, SYMBOL_POINT) and calculate a 15-point offset for label positioning, determining Y-coordinates ("textY_A", "textY_B", "textY_C", "textY_D", "textY_E", "textY_F") by adding or subtracting the offset based on whether each pivot is a swing high ("isHigh" true) or low to place labels above highs or below lows.
Next, we use "DrawTextEx" to create text labels for pivots A, B, C, D, E, and F with "signalPrefix" and suffixes like "_Text_A", displaying the respective letter, positioned at the pivot time and adjusted Y-coordinate, using "clrBlack", font size 11, and the pivot’s "isHigh" status for anchoring. Last, we calculate the central label’s position at "centralTime" as the midpoint of "A.time" and "D.time" and "centralPrice" at "F.price", creating a text object with "ObjectCreate" named "signalPrefix + '_Text_Center'", setting OBJPROP_TEXT to "Bullish 3 Drives" or "Bearish 3 Drives" based on "patternType", and configuring "OBJPROP_COLOR" to "clrBlack", "OBJPROP_FONTSIZE" to 11, OBJPROP_FONT to "Arial Bold", and "OBJPROP_ALIGN" to "ALIGN_CENTER" with ObjectSetString and "ObjectSetInteger". This logic ensures a comprehensive visual representation of the 3 Drives pattern’s structure and type on the chart. When we run the program, here is a visualization of the output we receive.

From the image, we can see that we have added the edges and the labels to the pattern, making it more revealing and illustrative. What we need to do next is determine the trade levels for the pattern.
//--- Define start and end times for drawing horizontal dotted lines for trade levels
datetime lineStart = F.time;
datetime lineEnd = F.time + PeriodSeconds(_Period)*2;

//--- Declare variables for entry price and take profit levels
double entryPriceLevel, TP1Level, TP2Level, TP3Level;
//--- Calculate pattern range (drive 3 length)
double patternRange = (patternType=="Bullish") ? (E.price - F.price) : (F.price - E.price);
//--- Calculate trade levels based on whether the pattern is Bullish or Bearish
if(patternType=="Bullish") { //--- Bullish → BUY signal
   //--- Set entry at the pattern tip (F price)
   entryPriceLevel = F.price;
   //--- Set TP3 at pivot E's price
   TP3Level = E.price;
   //--- Set TP1 at 0.382 fib retrace from F to E
   TP1Level = F.price + 0.382 * patternRange;
   //--- Set TP2 at 0.618 fib retrace from F to E
   TP2Level = F.price + 0.618 * patternRange;
} else { //--- Bearish → SELL signal
   //--- Set entry at the pattern tip (F price)
   entryPriceLevel = F.price;
   //--- Set TP3 at pivot E's price
   TP3Level = E.price;
   //--- Set TP1 at 0.382 fib retrace from F to E
   TP1Level = F.price - 0.382 * patternRange;
   //--- Set TP2 at 0.618 fib retrace from F to E
   TP2Level = F.price - 0.618 * patternRange;
}

//--- Draw dotted horizontal lines to represent the entry and TP levels
DrawDottedLine(signalPrefix+"_EntryLine", lineStart, entryPriceLevel, lineEnd, clrMagenta);
DrawDottedLine(signalPrefix+"_TP1Line", lineStart, TP1Level, lineEnd, clrForestGreen);
DrawDottedLine(signalPrefix+"_TP2Line", lineStart, TP2Level, lineEnd, clrGreen);
DrawDottedLine(signalPrefix+"_TP3Line", lineStart, TP3Level, lineEnd, clrDarkGreen);

//--- Define a label time coordinate positioned just to the right of the dotted lines
datetime labelTime = lineEnd + PeriodSeconds(_Period)/2;

//--- Construct the entry label text with the price
string entryLabel = (patternType=="Bullish") ? "BUY (" : "SELL (";
entryLabel += DoubleToString(entryPriceLevel, _Digits) + ")";
//--- Draw the entry label on the chart
DrawTextEx(signalPrefix+"_EntryLabel", entryLabel, labelTime, entryPriceLevel, clrMagenta, 11, true);

//--- Construct and draw the TP1 label
string tp1Label = "TP1 (" + DoubleToString(TP1Level, _Digits) + ")";
DrawTextEx(signalPrefix+"_TP1Label", tp1Label, labelTime, TP1Level, clrForestGreen, 11, true);

//--- Construct and draw the TP2 label
string tp2Label = "TP2 (" + DoubleToString(TP2Level, _Digits) + ")";
DrawTextEx(signalPrefix+"_TP2Label", tp2Label, labelTime, TP2Level, clrGreen, 11, true);

//--- Construct and draw the TP3 label
string tp3Label = "TP3 (" + DoubleToString(TP3Level, _Digits) + ")";
DrawTextEx(signalPrefix+"_TP3Label", tp3Label, labelTime, TP3Level, clrDarkGreen, 11, true);
To define and visualize trade levels for the detected pattern, we set "lineStart" to the F pivot’s time ("F.time") and "lineEnd" to two periods ahead using "PeriodSeconds(_Period) * 2", and declare variables "entryPriceLevel", "TP1Level", "TP2Level", and "TP3Level" for trade calculations. Then, we calculate the "patternRange" as the third drive length ("E.price - F.price" for bullish, "F.price - E.price" for bearish); for a bullish pattern, we set "entryPriceLevel" to "F.price", "TP3Level" to "E.price", "TP1Level" to "F.price + 0.382 * patternRange", and "TP2Level" to "F.price + 0.618 * patternRange"; for a bearish pattern, we set "entryPriceLevel" to "F.price", "TP3Level" to "E.price", "TP1Level" to "F.price - 0.382 * patternRange", and "TP2Level" to "F.price - 0.618 * patternRange".
Next, we draw four dotted horizontal lines using "DrawDottedLine": an entry line at "entryPriceLevel" in magenta, and take-profit lines at "TP1Level" (forest green), "TP2Level" (green), and "TP3Level" (dark green), spanning from "lineStart" to "lineEnd". Last, we set "labelTime" to "lineEnd" plus half a period, create label texts with prices formatted via DoubleToString (e.g., "BUY (price)" or "SELL (price)" for entry, "TP1 (price)", etc.), and use "DrawTextEx" to draw these labels at "labelTime" with corresponding colors, font size 11, and anchored above the price levels. Upon compilation, we have the following outcome.
Bearish pattern:

Bullish pattern:

From the images, we can see that we have correctly mapped the trade levels. What we need to do now is initiate the actual trade positions, and that is all.
//--- Retrieve the index of the current bar
int currentBarIndex = Bars(_Symbol, _Period) - 1;
//--- If no pattern has been previously locked, lock the current pattern formation
if(g_patternFormationBar == -1) {
   g_patternFormationBar = currentBarIndex;
   g_lockedPatternA = A.time;
   //--- Print a message that the pattern is detected and waiting for confirmation
   Print("Pattern detected on bar ", currentBarIndex, ". Waiting for confirmation on next bar.");
   return;
}
//--- If still on the same formation bar, the pattern is considered to be repainting
if(currentBarIndex == g_patternFormationBar) {
   Print("Pattern is repainting; still on locked formation bar ", currentBarIndex, ". No trade yet.");
   return;
}
//--- If we are on a new bar compared to the locked formation
if(currentBarIndex > g_patternFormationBar) {
   //--- Check if the locked pattern still corresponds to the same A pivot
   if(g_lockedPatternA == A.time) {
      Print("Confirmed pattern (locked on bar ", g_patternFormationBar, "). Opening trade on bar ", currentBarIndex, ".");
      //--- Update the pattern formation bar to the current bar
      g_patternFormationBar = currentBarIndex;
      //--- Only proceed with trading if allowed and if there is no existing position
      if(AllowTrading && !PositionSelect(_Symbol)) {
         //--- Check if this pattern has already been traded
         bool alreadyTraded = false;
         for(int k = 0; k < ArraySize(tradedPatterns); k++) {
            if(tradedPatterns[k] == A.time) {
               alreadyTraded = true;
               break;
            }
         }
         if(alreadyTraded) {
            Print("This pattern has already been traded. No new trade executed.");
            return;
         }
         double entryPriceTrade = 0, stopLoss = 0, takeProfit = 0;
         point = SymbolInfoDouble(_Symbol, SYMBOL_POINT);
         bool tradeResult = false;
         //--- Select TP level based on user input
         switch(TakeProfitLevel) {
            case TP1:
               takeProfit = TP1Level;
               break;
            case TP2:
               takeProfit = TP2Level;
               break;
            case TP3:
               takeProfit = TP3Level;
               break;
            default:
               takeProfit = TP2Level; // Fallback to TP2
         }
         //--- Calculate SL based on user-selected method
         if(patternType=="Bullish") { //--- BUY signal
            entryPriceTrade = SymbolInfoDouble(_Symbol, SYMBOL_ASK);
            if(StopLossType == SL_FIBO) {
               double third_drive = E.price - F.price;
               stopLoss = F.price - (SL_FiboExtension - 1.0) * third_drive;
            } else { // SL_FIXED
               stopLoss = entryPriceTrade - SL_FixedPoints * point;
            }
            // Ensure SL is below entry for BUY
            if(stopLoss >= entryPriceTrade) {
               stopLoss = entryPriceTrade - 10 * point;
            }
            tradeResult = obj_Trade.Buy(LotSize, _Symbol, entryPriceTrade, stopLoss, takeProfit, "3 Drives Signal");
            if(tradeResult)
               Print("Buy order opened successfully.");
            else
               Print("Buy order failed: ", obj_Trade.ResultRetcodeDescription());
         }
         //--- For a Bearish pattern, execute a SELL trade
         else if(patternType=="Bearish") { //--- SELL signal
            entryPriceTrade = SymbolInfoDouble(_Symbol, SYMBOL_BID);
            if(StopLossType == SL_FIBO) {
               double third_drive = F.price - E.price;
               stopLoss = F.price + (SL_FiboExtension - 1.0) * third_drive;
            } else { // SL_FIXED
               stopLoss = entryPriceTrade + SL_FixedPoints * point;
            }
            // Ensure SL is above entry for SELL
            if(stopLoss <= entryPriceTrade) {
               stopLoss = entryPriceTrade + 10 * point;
            }
            tradeResult = obj_Trade.Sell(LotSize, _Symbol, entryPriceTrade, stopLoss, takeProfit, "3 Drives Signal");
            if(tradeResult)
               Print("Sell order opened successfully.");
            else
               Print("Sell order failed: ", obj_Trade.ResultRetcodeDescription());
         }
         //--- If trade was successful, mark the pattern as traded
         if(tradeResult) {
            int size = ArraySize(tradedPatterns);
            ArrayResize(tradedPatterns, size + 1);
            tradedPatterns[size] = A.time;
         }
      }
      else {
         //--- If a position is already open, do not execute a new trade
         Print("A position is already open for ", _Symbol, ". No new trade executed.");
      }
   }
   else {
      //--- If the pattern has changed, update the lock with the new formation bar and A pivot
      g_patternFormationBar = currentBarIndex;
      g_lockedPatternA = A.time;
      Print("Pattern has changed; updating lock on bar ", currentBarIndex, ". Waiting for confirmation.");
      return;
   }
}
else {
   //--- If no valid 3 Drives pattern is detected, reset the pattern lock variables
   g_patternFormationBar = -1;
   g_lockedPatternA = 0;
}
We finalize the implementation by managing trade execution and pattern confirmation for the detected pattern. First, we retrieve the current bar index with "Bars(_Symbol, _Period) - 1" and store it in "currentBarIndex". Then, if no pattern is locked ("g_patternFormationBar == -1"), we set "g_patternFormationBar" to "currentBarIndex", lock the A pivot time in "g_lockedPatternA" with "A.time", log the detection with "Print" indicating a wait for confirmation, and exit.
Next, if still on the formation bar ("currentBarIndex == g_patternFormationBar"), we log repainting and exit to prevent premature trading. Last, if a new bar has formed ("currentBarIndex > g_patternFormationBar") and the A pivot matches "g_lockedPatternA", we confirm the pattern, log it, update "g_patternFormationBar", and check if trading is permitted with "AllowTrading" and no open positions exist via the PositionSelect function; we verify the pattern hasn’t been traded by checking "tradedPatterns", select the take-profit level ("TP1Level", "TP2Level", or "TP3Level") based on "TakeProfitLevel", calculate stop loss using "SL_FIBO" ("F.price ± (SL_FiboExtension - 1.0) * third_drive") or "SL_FIXED" ("entryPriceTrade ± SL_FixedPoints * point"), ensure stop loss is valid, execute a buy or sell with "obj_Trade.Buy" or "obj_Trade.Sell" using "LotSize" and "3 Drives Signal", log success or failure, and mark the pattern as traded in "tradedPatterns"; if trading is disallowed, a position exists, or the pattern was traded, we log no trade; if the pattern changes, we update the lock and wait; if no pattern is found, we reset the global variables. Upon compilation, we have the following outcome.
Bearish signal:

Bullish signal:

From the image, we can see that we plot the harmonic pattern and are still able to trade it accordingly once it is confirmed, hence achieving our objective of identifying, plotting, and trading the pattern. The thing that remains is backtesting the program, and that is handled in the next section.
Backtesting
After thorough backtesting, we have the following results.
Backtest graph:

Backtest report:

Conclusion
In conclusion, we’ve developed a 3 Drives pattern system in MQL5, harnessing price action to detect bullish and bearish 3 Drives harmonic patterns with precise Fibonacci retracements and extensions, automating trades with customizable entry, stop loss, and multi-level take-profit points, and visualizing patterns with chart objects like triangles and trendlines.
Disclaimer: This article is for educational purposes only. Trading carries significant financial risks, and market volatility may result in losses. Thorough backtesting and careful risk management are crucial before deploying this program in live markets.
By leveraging the concepts and implementation presented, you can adapt this 3 Drives pattern system to your trading style, enhancing your algorithmic strategies. Happy trading!
Warning: All rights to these materials are reserved by MetaQuotes Ltd. Copying or reprinting of these materials in whole or in part is prohibited.
This article was written by a user of the site and reflects their personal views. MetaQuotes Ltd is not responsible for the accuracy of the information presented, nor for any consequences resulting from the use of the solutions, strategies or recommendations described.

- Free trading apps
- Over 8,000 signals for copying
- Economic news for exploring financial markets
You agree to website policy and terms of use
Why the ea not shown on the graph and what should be the optimization number to use the ea and minimum trading amount?
Hello. You can optimize on the optimization tab.