

Automatización de estrategias de trading en MQL5 (Parte 34): Sistema de ruptura de líneas de tendencia con evaluación de la calidad del ajuste mediante R²
 54
 2

Introducción
En nuestro artículo anterior (Parte 33), desarrollamos un sistema basado en el patrón Shark en MetaQuotes Language 5 (MQL5) que detectaba patrones armónicos Shark alcistas y bajistas mediante ratios de Fibonacci y automatizaba las operaciones con niveles personalizables de take profit y stop loss, representados mediante objetos gráficos como triángulos y líneas de tendencia. En la parte 34, creamos un sistema de trading de rupturas de líneas de tendencia que identifica líneas de tendencia de soporte y resistencia a partir de puntos de giro y valida dichas líneas mediante la bondad de ajuste medida con R² y restricciones del ángulo de inclinación, para ejecutar operaciones en las rupturas con representaciones dinámicas en el gráfico. Hoy hablaremos de los siguientes temas:
- Comprender el marco de la estrategia de rupturas de líneas de tendencia
- Implementación en MQL5
- Backtesting
- Conclusión
Al final, tendrás una estrategia sólida en MQL5 para operar con rupturas de líneas de tendencia, lista para personalizarla. ¡Empecemos!
Comprender el marco de la estrategia de rupturas de líneas de tendencia
La estrategia de rupturas de líneas de tendencia consiste en trazar líneas diagonales en los gráficos de precios para conectar los máximos de giro (resistencia) o los mínimos de giro (soporte), con el fin de identificar los niveles clave de precios en los que es probable que el mercado cambie de dirección o continúe su movimiento. Cuando el precio rompe estas líneas de tendencia —ya sea cerrando por encima de una línea de resistencia o por debajo de una línea de soporte—, esto indica un posible cambio en el impulso del mercado, lo que lleva a los operadores a abrir posiciones en la dirección de la ruptura con parámetros definidos de riesgo y rentabilidad. Este enfoque aprovecha los fuertes movimientos de precios que se producen tras la ruptura, con el objetivo de captar tendencias significativas al tiempo que se gestiona el riesgo mediante niveles de stop loss y take profit. Aquí tienes un ejemplo de ruptura de una línea de tendencia bajista.
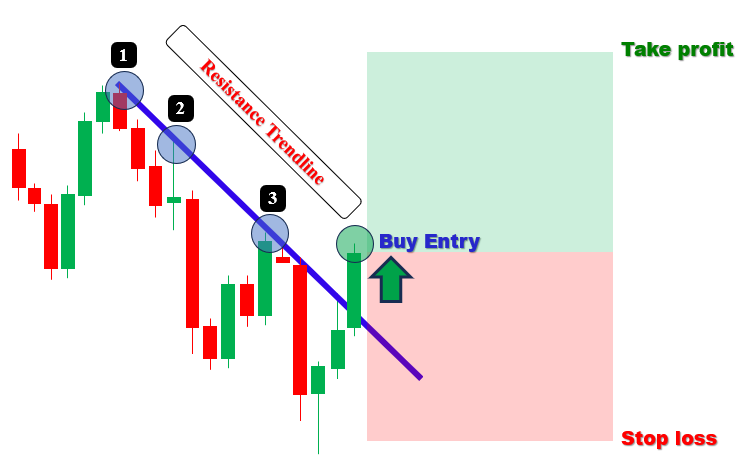
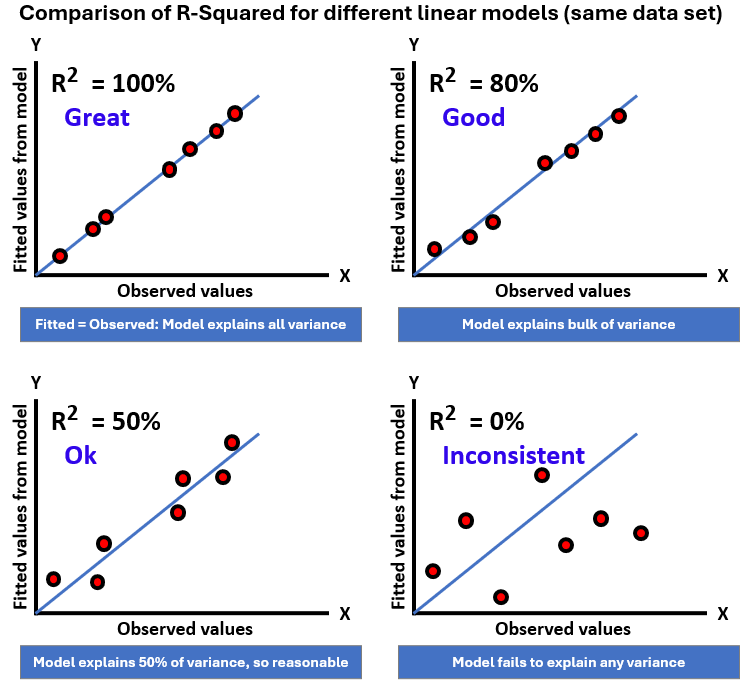
Nuestro plan consiste en detectar máximos y mínimos de giro dentro de un período retrospectivo determinado, trazar líneas de tendencia con un número mínimo de puntos de contacto y validarlas mediante métricas de R² y restricciones del ángulo de inclinación para garantizar su fiabilidad. Por si no lo conoces, R², también llamado coeficiente de determinación, es una medida estadística que indica en qué medida un modelo de regresión explica la variabilidad de la variable dependiente a partir de las variables independientes. Representa la proporción de la variación total de la variable de respuesta que explica el modelo, con valores que oscilan entre 0 y 1. Aquí tienes una breve visualización del modelo.
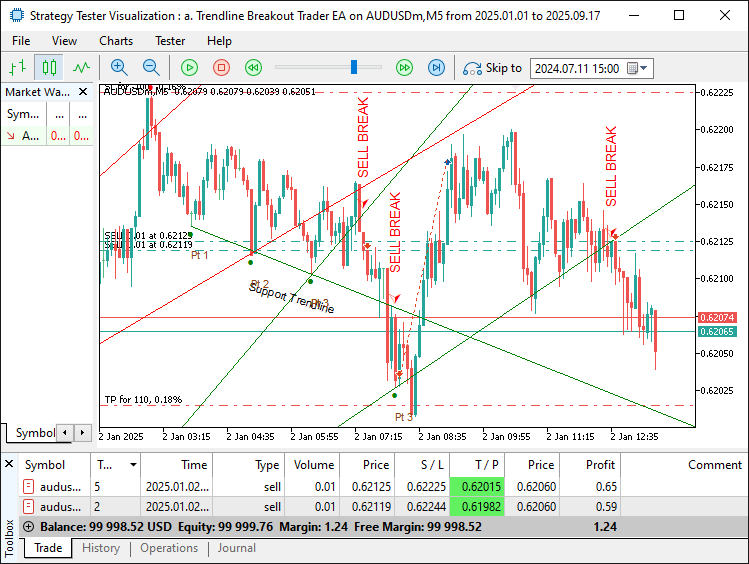
Implementaremos una lógica de ejecución de operaciones para las rupturas, activadas por el cierre de la vela o por una vela situada por completo al otro lado de la línea de tendencia, con indicaciones visuales mediante líneas de tendencia, flechas y etiquetas, y gestionaremos el ciclo de vida de las líneas de tendencia eliminando las que hayan caducado o se hayan roto, creando así un sistema de trading de rupturas. Echa un vistazo al resultado que queremos conseguir y, a continuación, podremos pasar a la implementación.
Implementación en MQL5
Para crear el programa en MQL5, abre MetaEditor, ve al Navegador y selecciona «Nuevo» para crear un asesor experto mediante el asistente y sigue las instrucciones para crear el archivo. Una vez creado el archivo, empezaremos por declarar en el entorno de programación algunos parámetros de entrada y estructuras que harán que el programa sea más dinámico.
//+------------------------------------------------------------------+ //| Trendline Breakout Trader EA.mq5 | //| Copyright 2025, Allan Munene Mutiiria. | //| https://t.me/Forex_Algo_Trader | //+------------------------------------------------------------------+ #property copyright "Copyright 2025, Allan Munene Mutiiria." #property link "https://t.me/Forex_Algo_Trader" #property version "1.00" #property strict #include <Trade\Trade.mqh> //--- Include Trade library for trading operations CTrade obj_Trade; //--- Instantiate trade object //+------------------------------------------------------------------+ //| Breakout definition enumeration | //+------------------------------------------------------------------+ enum ENUM_BREAKOUT_TYPE { BREAKOUT_CLOSE = 0, // Breakout on close above/below line BREAKOUT_CANDLE = 1 // Breakout on entire candle above/below line }; //+------------------------------------------------------------------+ //| Swing point structure | //+------------------------------------------------------------------+ struct Swing { //--- Define swing point structure datetime time; //--- Store swing time double price; //--- Store swing price }; //+------------------------------------------------------------------+ //| Starting point structure | //+------------------------------------------------------------------+ struct StartingPoint { //--- Define starting point structure datetime time; //--- Store starting point time double price; //--- Store starting point price bool is_support; //--- Indicate support/resistance flag }; //+------------------------------------------------------------------+ //| Trendline storage structure | //+------------------------------------------------------------------+ struct TrendlineInfo { //--- Define trendline info structure string name; //--- Store trendline name datetime start_time; //--- Store start time datetime end_time; //--- Store end time double start_price; //--- Store start price double end_price; //--- Store end price double slope; //--- Store slope bool is_support; //--- Indicate support/resistance flag int touch_count; //--- Store number of touches datetime creation_time; //--- Store creation time int touch_indices[]; //--- Store touch indices array bool is_signaled; //--- Indicate signal flag }; //+------------------------------------------------------------------+ //| Forward declarations | //+------------------------------------------------------------------+ void DetectSwings(); //--- Declare swing detection function void SortSwings(Swing &swings[], int count); //--- Declare swing sorting function double CalculateAngle(datetime time1, double price1, datetime time2, double price2); //--- Declare angle calculation function bool ValidateTrendline(bool isSupport, datetime start_time, datetime ref_time, double ref_price, double slope, double tolerance_pen); //--- Declare trendline validation function void FindAndDrawTrendlines(bool isSupport); //--- Declare trendline finding/drawing function void UpdateTrendlines(); //--- Declare trendline update function void RemoveTrendlineFromStorage(int index); //--- Declare trendline removal function bool IsStartingPointUsed(datetime time, double price, bool is_support); //--- Declare starting point usage check function double CalculateRSquared(const datetime ×[], const double &prices[], int n, double slope, double intercept); //--- Declare R-squared calculation function //+------------------------------------------------------------------+ //| Inputs | //+------------------------------------------------------------------+ input ENUM_BREAKOUT_TYPE BreakoutType = BREAKOUT_CLOSE; // Breakout Definition input int LookbackBars = 200; // Set bars for swing detection lookback input double TouchTolerance = 10.0; // Set tolerance for touch points (points) input int MinTouches = 3; // Set minimum touch points for valid trendline input double PenetrationTolerance = 5.0; // Set allowance for bar penetration (points) input int ExtensionBars = 100; // Set bars to extend trendline right input int MinBarSpacing = 10; // Set minimum bar spacing between touches input double inpLot = 0.01; // Set lot size input double inpSLPoints = 100.0; // Set stop loss (points) input double inpRRRatio = 1.1; // Set risk:reward ratio input double MinAngle = 1.0; // Set minimum inclination angle (degrees) input double MaxAngle = 89.0; // Set maximum inclination angle (degrees) input double MinRSquared = 0.8; // Minimum R-squared for trendline acceptance input bool DeleteExpiredObjects = false; // Enable deletion of expired/broken objects input bool EnableTradingSignals = true; // Enable buy/sell signals and trades input bool DrawTouchArrows = true; // Enable drawing arrows at touch points input bool DrawLabels = true; // Enable drawing trendline/point labels input color SupportLineColor = clrGreen; // Set color for support trendlines input color ResistanceLineColor = clrRed; // Set color for resistance trendlines //+------------------------------------------------------------------+ //| Global variables | //+------------------------------------------------------------------+ Swing swingLows[]; //--- Store swing lows int numLows = 0; //--- Track number of swing lows Swing swingHighs[]; //--- Store swing highs int numHighs = 0; //--- Track number of swing highs TrendlineInfo trendlines[]; //--- Store trendlines int numTrendlines = 0; //--- Track number of trendlines StartingPoint startingPoints[]; //--- Store used starting points int numStartingPoints = 0; //--- Track number of starting points
Comenzamos la implementación de nuestro sistema de trading de rupturas de líneas de tendencia estableciendo los componentes básicos para detectar las rupturas de líneas de tendencia y operar con ellas. En primer lugar, incluimos la biblioteca «Trade.mqh» y creamos un objeto CTrade denominado «obj_Trade» para las operaciones de trading. A continuación, definimos la enumeración «ENUM_BREAKOUT_TYPE» con las opciones «BREAKOUT_CLOSE» (ruptura al cierre de la vela) y «BREAKOUT_CANDLE» (ruptura con una vela situada por completo al otro lado de la línea de tendencia), lo que permite una detección flexible de las rupturas. A continuación, creamos la estructura «Swing» para almacenar la hora y el precio de un punto de giro, la estructura «StartingPoint» para llevar un registro de los puntos de inicio ya utilizados para las líneas de tendencia, con un indicador de soporte/resistencia, y la estructura «TrendlineInfo» para almacenar los detalles de las líneas de tendencia, como el nombre, las horas y los precios de inicio y fin, la pendiente, el número de contactos, la hora de creación, los índices de los contactos y el estado de la señal.
Realizamos las declaraciones anticipadas de funciones como «DetectSwings», «SortSwings» y «CalculateAngle» para la lógica principal. A continuación, configuramos los parámetros de entrada: «BreakoutType» como «BREAKOUT_CLOSE», «LookbackBars» en 200 y el resto, que se explican por sí mismos. Por último, inicializamos las matrices globales «swingLows», «swingHighs», «trendlines» y «startingPoints» con los contadores «numLows», «numHighs», «numTrendlines» y «numStartingPoints» para gestionar los puntos de giro y las líneas de tendencia, lo que constituye la base para detectar y validar las líneas de tendencia en el trading de rupturas. Ahora que ya lo tenemos todo listo, podemos inicializar las matrices de almacenamiento en la fase de inicialización.
//+------------------------------------------------------------------+
//| Expert initialization function                                   |
//+------------------------------------------------------------------+
int OnInit() {
   ArrayResize(trendlines, 0);     //--- Resize trendlines array
   numTrendlines = 0;              //--- Reset trendlines count
   ArrayResize(startingPoints, 0); //--- Resize starting points array
   numStartingPoints = 0;          //--- Reset starting points count
   return(INIT_SUCCEEDED);         //--- Return success
}
//+------------------------------------------------------------------+
//| Expert deinitialization function                                 |
//+------------------------------------------------------------------+
void OnDeinit(const int reason) {
   ArrayResize(trendlines, 0);     //--- Resize trendlines array
   numTrendlines = 0;              //--- Reset trendlines count
   ArrayResize(startingPoints, 0); //--- Resize starting points array
   numStartingPoints = 0;          //--- Reset starting points count
}
Para garantizar una configuración y limpieza adecuadas de los recursos, implementamos la función OnInit llamando a ArrayResize para reducir a cero el tamaño de la matriz «trendlines», restableciendo «numTrendlines» a 0, reduciendo a cero el tamaño de la matriz «startingPoints» y restableciendo «numStartingPoints» a 0; a continuación, devolvemos INIT_SUCCEEDED para confirmar que la inicialización se ha realizado correctamente. A continuación, en la función OnDeinit, llevamos a cabo una limpieza idéntica, asegurándonos de que no haya fugas de memoria cuando el programa finalice. Una vez completada la inicialización, ya podemos pasar a definir la lógica de la estrategia. Para facilitar la modularización de la lógica, utilizaremos funciones y empezaremos por definir la detección de puntos de giro, de modo que dispongamos de puntos de referencia para trazar las líneas de tendencia.
//+------------------------------------------------------------------+
//| Check for new bar                                                |
//+------------------------------------------------------------------+
bool IsNewBar() {
   static datetime lastTime = 0;                      //--- Store last bar time
   datetime currentTime = iTime(_Symbol, _Period, 0); //--- Get current bar time
   if (lastTime != currentTime) {                     //--- Check for new bar
      lastTime = currentTime;                         //--- Update last time
      return true;                                    //--- Indicate new bar
   }
   return false;                                      //--- Indicate no new bar
}
//+------------------------------------------------------------------+
//| Sort swings by time (ascending, oldest first)                    |
//+------------------------------------------------------------------+
void SortSwings(Swing &swings[], int count) {
   for (int i = 0; i < count - 1; i++) {            //--- Iterate through swings
      for (int j = 0; j < count - i - 1; j++) {     //--- Compare adjacent swings
         if (swings[j].time > swings[j + 1].time) { //--- Check time order
            Swing temp = swings[j];                 //--- Store temporary swing
            swings[j] = swings[j + 1];              //--- Swap swings
            swings[j + 1] = temp;                   //--- Complete swap
         }
      }
   }
}
//+------------------------------------------------------------------+
//| Detect swing highs and lows                                      |
//+------------------------------------------------------------------+
void DetectSwings() {
   numLows = 0;                                              //--- Reset lows count
   ArrayResize(swingLows, 0);                                //--- Resize lows array
   numHighs = 0;                                             //--- Reset highs count
   ArrayResize(swingHighs, 0);                               //--- Resize highs array
   int totalBars = iBars(_Symbol, _Period);                  //--- Get total bars
   int effectiveLookback = MathMin(LookbackBars, totalBars); //--- Calculate effective lookback
   if (effectiveLookback < 5) {                              //--- Check sufficient bars
      Print("Not enough bars for swing detection.");         //--- Log insufficient bars
      return;                                                //--- Exit function
   }
   for (int i = 2; i < effectiveLookback - 2; i++) {         //--- Iterate through bars
      double low_i = iLow(_Symbol, _Period, i);              //--- Get current low
      double low_im1 = iLow(_Symbol, _Period, i - 1);        //--- Get previous low
      double low_im2 = iLow(_Symbol, _Period, i - 2);        //--- Get two bars prior low
      double low_ip1 = iLow(_Symbol, _Period, i + 1);        //--- Get next low
      double low_ip2 = iLow(_Symbol, _Period, i + 2);        //--- Get two bars next low
      if (low_i < low_im1 && low_i < low_im2 && low_i < low_ip1 && low_i < low_ip2) { //--- Check for swing low
         Swing s;                                            //--- Create swing struct
         s.time = iTime(_Symbol, _Period, i);                //--- Set swing time
         s.price = low_i;                                    //--- Set swing price
         ArrayResize(swingLows, numLows + 1);                //--- Resize lows array
         swingLows[numLows] = s;                             //--- Add swing low
         numLows++;                                          //--- Increment lows count
      }
      double high_i = iHigh(_Symbol, _Period, i);       //--- Get current high
      double high_im1 = iHigh(_Symbol, _Period, i - 1); //--- Get previous high
      double high_im2 = iHigh(_Symbol, _Period, i - 2); //--- Get two bars prior high
      double high_ip1 = iHigh(_Symbol, _Period, i + 1); //--- Get next high
      double high_ip2 = iHigh(_Symbol, _Period, i + 2); //--- Get two bars next high
      if (high_i > high_im1 && high_i > high_im2 && high_i > high_ip1 && high_i > high_ip2) { //--- Check for swing high
         Swing s;                                       //--- Create swing struct
         s.time = iTime(_Symbol, _Period, i);           //--- Set swing time
         s.price = high_i;                              //--- Set swing price
         ArrayResize(swingHighs, numHighs + 1);         //--- Resize highs array
         swingHighs[numHighs] = s;                      //--- Add swing high
         numHighs++;                                    //--- Increment highs count
      }
   }
   if (numLows > 0) SortSwings(swingLows, numLows);     //--- Sort swing lows
   if (numHighs > 0) SortSwings(swingHighs, numHighs);  //--- Sort swing highs
}
Una vez completada la configuración básica, pasamos ahora a implementar la lógica principal para detectar los puntos de giro y gestionar las actualizaciones de las barras. En primer lugar, desarrollamos la función «IsNewBar», que utiliza una variable estática «lastTime» para almacenar la hora de la barra anterior, la compara con la hora de la barra actual obtenida mediante iTime para el símbolo y el período con desplazamiento 0, actualiza «lastTime» si ambas horas son distintas y devuelve «true» para indicar una nueva barra, o «false» en caso contrario. A continuación, implementamos la función «SortSwings», que ordena una matriz «Swing» por tiempo en orden ascendente utilizando un algoritmo de ordenación por burbuja, recorriendo la matriz con bucles anidados, comparando los campos «time» de los elementos adyacentes e intercambiándolos mediante una estructura «Swing» temporal si están desordenados.
A continuación, creamos la función «DetectSwings», que restablece «numLows» y «numHighs» a 0, ajusta a cero el tamaño de las matrices «swingLows» y «swingHighs», calcula un período retrospectivo efectivo aplicando MathMin a «LookbackBars» y al número total de barras obtenido mediante iBars, y finaliza mostrando un mensaje de error mediante Print si hay menos de 5 barras disponibles. A continuación, recorremos las barras desde el índice 2 hasta «effectiveLookback - 2», buscando mínimos de giro al comparar el mínimo de la barra actual («iLow») con los mínimos de las dos barras anteriores y las dos posteriores, y máximos de giro de forma similar mediante iHigh; si se detecta un punto de giro, creamos una estructura «Swing», establecemos su campo «time» con «iTime» y su campo «price» con el mínimo o el máximo, la añadimos a «swingLows» o «swingHighs» utilizando ArrayResize e incrementamos el contador correspondiente. Por último, llamamos a la función «SortSwings» sobre «swingLows» y «swingHighs» si contienen elementos, lo que garantiza el orden cronológico para la construcción de la línea de tendencia. Definamos ahora las funciones para calcular el ángulo de inclinación de las líneas de tendencia, aplicar las restricciones del ángulo de inclinación y validar dichas líneas.
//+------------------------------------------------------------------+
//| Calculate visual inclination angle                               |
//+------------------------------------------------------------------+
double CalculateAngle(datetime time1, double price1, datetime time2, double price2) {
   int x1, y1, x2, y2; //--- Declare coordinate variables
   if (!ChartTimePriceToXY(0, 0, time1, price1, x1, y1)) return 0.0; //--- Convert time1/price1 to XY
   if (!ChartTimePriceToXY(0, 0, time2, price2, x2, y2)) return 0.0; //--- Convert time2/price2 to XY
   double dx = (double)(x2 - x1);                                    //--- Calculate x difference
   double dy = (double)(y2 - y1);                                    //--- Calculate y difference
   if (dx == 0.0) return (dy > 0.0 ? -90.0 : 90.0);                  //--- Handle vertical line case
   double angle = MathArctan(-dy / dx) * 180.0 / M_PI;               //--- Calculate angle in degrees
   return angle;                                                     //--- Return angle
}
//+------------------------------------------------------------------+
//| Validate trendline                                               |
//+------------------------------------------------------------------+
bool ValidateTrendline(bool isSupport, datetime start_time, datetime ref_time, double ref_price, double slope, double tolerance_pen) {
   int bar_start = iBarShift(_Symbol, _Period, start_time); //--- Get start bar index
   if (bar_start < 0) return false;                         //--- Check invalid bar index
   for (int bar = bar_start; bar >= 0; bar--) {             //--- Iterate through bars
      datetime bar_time = iTime(_Symbol, _Period, bar);     //--- Get bar time
      double dk = (double)(bar_time - ref_time);            //--- Calculate time difference
      double line_price = ref_price + slope * dk;           //--- Calculate line price
      if (isSupport) {                                      //--- Check support case
         double low = iLow(_Symbol, _Period, bar);          //--- Get bar low
         if (low < line_price - tolerance_pen) return false;//--- Check if broken
      } else {                                              //--- Handle resistance case
         double high = iHigh(_Symbol, _Period, bar);        //--- Get bar high
         if (high > line_price + tolerance_pen) return false;//--- Check if broken
      }
   }
   return true; //--- Return valid
}
Aquí implementamos funciones para calcular los ángulos de las líneas de tendencia y comprobar su integridad. En primer lugar, desarrollamos la función «CalculateAngle», que convierte dos puntos de tiempo y precio («time1», «price1» y «time2», «price2») en coordenadas del gráfico («x1», «y1» y «x2», «y2») mediante ChartTimePriceToXY, devolviendo 0.0 si falla alguna de las conversiones; calculamos las diferencias «dx» y «dy», gestionamos las líneas verticales devolviendo -90.0 o 90.0 en función de «dy» si «dx» es cero, y calculamos el ángulo en grados aplicando MathArctan a «-dy / dx» y multiplicando el resultado por 180/M_PI para obtener la inclinación visual.
A continuación, implementamos la función «ValidateTrendline», que valida una línea de tendencia obteniendo el índice de la barra correspondiente a «start_time» mediante iBarShift y devuelve «false» si el índice no es válido; recorremos las barras desde este índice hasta el presente, calculando el precio de la línea de tendencia en el instante de cada barra («iTime») mediante la fórmula «ref_price + slope * (bar_time - ref_time)»; para las líneas de tendencia de soporte («isSupport» igual a «true»), comprobamos si el mínimo de la barra (iLow) cae por debajo de «line_price - tolerance_pen» y devolvemos «false» si se ha producido una ruptura; en el caso de la resistencia, comprobamos si el máximo de la barra (iHigh) supera «line_price + tolerance_pen» y devolvemos «false» si se ha producido una ruptura; en caso contrario, devolvemos «true», asegurándonos de que las líneas de tendencia cumplan las restricciones del ángulo de inclinación y se mantengan sin rupturas para una detección fiable de estas. Ahora podemos definir la función para el modelo de bondad de ajuste basado en R².
//+------------------------------------------------------------------+ //| Calculate R-squared for goodness of fit | //+------------------------------------------------------------------+ double CalculateRSquared(const datetime ×[], const double &prices[], int n, double slope, double intercept) { double sum_y = 0.0; //--- Initialize sum of y for (int k = 0; k < n; k++) { //--- Iterate through points sum_y += prices[k]; //--- Accumulate y } double mean_y = sum_y / n; //--- Calculate mean y double ss_tot = 0.0, ss_res = 0.0; //--- Initialize sums of squares for (int k = 0; k < n; k++) { //--- Iterate through points double x = (double)times[k]; //--- Get x (time) double y_pred = intercept + slope * x; //--- Calculate predicted y double y = prices[k]; //--- Get actual y ss_res += (y - y_pred) * (y - y_pred); //--- Accumulate residual sum ss_tot += (y - mean_y) * (y - mean_y); //--- Accumulate total sum } if (ss_tot == 0.0) return 1.0; //--- Handle constant y case return 1.0 - ss_res / ss_tot; //--- Calculate and return R-squared }
Desarrollamos la función «CalculateRSquared», que toma como entradas matrices de tiempos y precios, el número de puntos «n», la pendiente «slope» y la ordenada en el origen «intercept» de la línea de tendencia; inicializamos «sum_y» en 0 y recorremos «prices» para calcular la suma; a continuación, calculamos la media «mean_y» dividiendo «sum_y» entre «n». A continuación, inicializamos «ss_tot» y «ss_res» para la suma total de cuadrados y la suma de cuadrados de los residuos, respectivamente, recorremos de nuevo los datos para calcular los precios predichos («y_pred») mediante la fórmula «intercept + slope * time», acumulamos los residuos al cuadrado («y - y_pred» al cuadrado) en «ss_res» y las desviaciones respecto a la media al cuadrado («y - mean_y» al cuadrado) en «ss_tot», y devolvemos 1.0 si «ss_tot» es cero (precios constantes) o calculamos R² como «1.0 - ss_res / ss_tot». Simplemente utilizamos la fórmula de R² para evaluar la validez de las líneas de tendencia. Definamos ahora una función para gestionar las líneas de tendencia.
//+------------------------------------------------------------------+
//| Check if starting point is already used                          |
//+------------------------------------------------------------------+
bool IsStartingPointUsed(datetime time, double price, bool is_support) {
   for (int i = 0; i < numStartingPoints; i++) { //--- Iterate through starting points
      if (startingPoints[i].time == time && MathAbs(startingPoints[i].price - price) < TouchTolerance * _Point && startingPoints[i].is_support == is_support) { //--- Check match
         return true; //--- Return used
      }
   }
   return false; //--- Return not used
}
//+------------------------------------------------------------------+
//| Remove trendline from storage and optionally chart objects       |
//+------------------------------------------------------------------+
void RemoveTrendlineFromStorage(int index) {
   if (index < 0 || index >= numTrendlines) return;             //--- Check valid index
   Print("Removing trendline from storage: ", trendlines[index].name); //--- Log removal
   if (DeleteExpiredObjects) {                                  //--- Check deletion flag
      ObjectDelete(0, trendlines[index].name);                  //--- Delete trendline object
      for (int m = 0; m < trendlines[index].touch_count; m++) { //--- Iterate touches
         string arrow_name = trendlines[index].name + "_touch" + IntegerToString(m); //--- Generate arrow name
         ObjectDelete(0, arrow_name);                           //--- Delete touch arrow
         string text_name = trendlines[index].name + "_point_label" + IntegerToString(m); //--- Generate text name
         ObjectDelete(0, text_name);                            //--- Delete point label
      }
      string label_name = trendlines[index].name + "_label";    //--- Generate label name
      ObjectDelete(0, label_name);                              //--- Delete trendline label
      string signal_arrow = trendlines[index].name + "_signal_arrow"; //--- Generate signal arrow name
      ObjectDelete(0, signal_arrow);                            //--- Delete signal arrow
      string signal_text = trendlines[index].name + "_signal_text"; //--- Generate signal text name
      ObjectDelete(0, signal_text);                             //--- Delete signal text
   }
   for (int i = index; i < numTrendlines - 1; i++) {            //--- Shift array
      trendlines[i] = trendlines[i + 1];                        //--- Copy next trendline
   }
   ArrayResize(trendlines, numTrendlines - 1);                  //--- Resize trendlines array
   numTrendlines--;                                             //--- Decrement trendlines count
}
Aquí implementamos funciones para gestionar los puntos de inicio de las líneas de tendencia y su eliminación. En primer lugar, desarrollamos la función «IsStartingPointUsed», que recorre la matriz «startingPoints» y comprueba si los valores dados de «time», «price» e «is_support» coinciden con los de un punto de inicio existente, con una tolerancia de precio de «TouchTolerance * _Point» comprobada mediante MathAbs, y devuelve «true» si encuentra una coincidencia, o «false» en caso contrario. Esto ayudará a garantizar que no haya más de una línea de tendencia que parta de un mismo punto.
A continuación, creamos la función «RemoveTrendlineFromStorage», que comprueba la validez del parámetro de entrada «index» con respecto a «numTrendlines», registra mediante «Print» la eliminación de la línea de tendencia identificada por «name» y, si «DeleteExpiredObjects» es «true», elimina los objetos gráficos utilizando ObjectDelete para la línea de tendencia («name»), las flechas de contacto («name + '_touch' + index»), las etiquetas de puntos («name + '_point_label' + index»), la etiqueta de la línea de tendencia («name + '_label'»), la flecha de señal («name + '_signal_arrow'») y el texto de señal («name + '_signal_text'»). A continuación, desplazamos los elementos de la matriz «trendlines» hacia la izquierda a partir de «index» mediante un bucle, redimensionamos la matriz con ArrayResize para reducir su tamaño en uno y decrementamos «numTrendlines», asegurándonos así de que los puntos de inicio de las líneas de tendencia sean únicos y de que se eliminen correctamente las líneas de tendencia no válidas y sus elementos visuales del gráfico. Definamos ahora una función para detectar y trazar las líneas de tendencia utilizando las funciones auxiliares que hemos definido.
//+------------------------------------------------------------------+
//| Find and draw trendlines if no active one exists                 |
//+------------------------------------------------------------------+
void FindAndDrawTrendlines(bool isSupport) {
   bool has_active = false;                        //--- Initialize active flag
   for (int i = 0; i < numTrendlines; i++) {       //--- Iterate through trendlines
      if (trendlines[i].is_support == isSupport) { //--- Check type match
         has_active = true;                        //--- Set active flag
         break;                                    //--- Exit loop
      }
   }
   if (has_active) return;                          //--- Exit if active trendline exists
   Swing swings[];                                  //--- Initialize swings array
   int numSwings;                                   //--- Initialize swings count
   color lineColor;                                 //--- Initialize line color
   string prefix;                                   //--- Initialize prefix
   if (isSupport) {                                 //--- Handle support case
      numSwings = numLows;                          //--- Set number of lows
      ArrayResize(swings, numSwings);               //--- Resize swings array
      for (int i = 0; i < numSwings; i++) {         //--- Iterate through lows
         swings[i].time = swingLows[i].time;        //--- Copy low time
         swings[i].price = swingLows[i].price;      //--- Copy low price
      }
      lineColor = SupportLineColor;                 //--- Set support line color
      prefix = "Trendline_Support_";                //--- Set support prefix
   } else {                                         //--- Handle resistance case
      numSwings = numHighs;                         //--- Set number of highs
      ArrayResize(swings, numSwings);               //--- Resize swings array
      for (int i = 0; i < numSwings; i++) {         //--- Iterate through highs
         swings[i].time = swingHighs[i].time;       //--- Copy high time
         swings[i].price = swingHighs[i].price;     //--- Copy high price
      }
      lineColor = ResistanceLineColor;              //--- Set resistance line color
      prefix = "Trendline_Resistance_";             //--- Set resistance prefix
   }
   if (numSwings < 2) return;                       //--- Exit if insufficient swings
   double pointValue = _Point;                      //--- Get point value
   double touch_tolerance = TouchTolerance * pointValue; //--- Calculate touch tolerance
   double pen_tolerance = PenetrationTolerance * pointValue; //--- Calculate penetration tolerance
   int best_j = -1;                                 //--- Initialize best j index
   int max_touches = 0;                             //--- Initialize max touches
   double best_rsquared = -1.0;                     //--- Initialize best R-squared
   int best_touch_indices[];                        //--- Initialize best touch indices
   double best_slope = 0.0;                         //--- Initialize best slope
   double best_intercept = 0.0;                     //--- Initialize best intercept
   datetime best_min_time = 0;                      //--- Initialize best min time
   for (int i = 0; i < numSwings - 1; i++) {        //--- Iterate through first points
      for (int j = i + 1; j < numSwings; j++) {     //--- Iterate through second points
         datetime time1 = swings[i].time;           //--- Get first time
         double price1 = swings[i].price;           //--- Get first price
         datetime time2 = swings[j].time;           //--- Get second time
         double price2 = swings[j].price;           //--- Get second price
         double dt = (double)(time2 - time1);       //--- Calculate time difference
         if (dt <= 0) continue;                     //--- Skip invalid time difference
         double initial_slope = (price2 - price1) / dt; //--- Calculate initial slope
         int touch_indices[];                       //--- Initialize touch indices
         ArrayResize(touch_indices, 0);             //--- Resize touch indices
         int touches = 0;                           //--- Initialize touches count
         ArrayResize(touch_indices, touches + 1);   //--- Add first index
         touch_indices[touches] = i;                //--- Set first index
         touches++;                                 //--- Increment touches
         ArrayResize(touch_indices, touches + 1);   //--- Add second index
         touch_indices[touches] = j;                //--- Set second index
         touches++;                                 //--- Increment touches
         for (int k = 0; k < numSwings; k++) {      //--- Iterate through swings
            if (k == i || k == j) continue;         //--- Skip used indices
            datetime tk = swings[k].time;           //--- Get swing time
            double dk = (double)(tk - time1);       //--- Calculate time difference
            double expected = price1 + initial_slope * dk; //--- Calculate expected price
            double actual = swings[k].price;        //--- Get actual price
            if (MathAbs(expected - actual) <= touch_tolerance) { //--- Check touch within tolerance
               ArrayResize(touch_indices, touches + 1); //--- Add index
               touch_indices[touches] = k;          //--- Set index
               touches++;                           //--- Increment touches
            }
         }
         if (touches >= MinTouches) {               //--- Check minimum touches
            ArraySort(touch_indices);               //--- Sort touch indices
            bool valid_spacing = true;              //--- Initialize spacing flag
            for (int m = 0; m < touches - 1; m++) { //--- Iterate through touches
               int idx1 = touch_indices[m];         //--- Get first index
               int idx2 = touch_indices[m + 1];     //--- Get second index
               int bar1 = iBarShift(_Symbol, _Period, swings[idx1].time); //--- Get first bar
               int bar2 = iBarShift(_Symbol, _Period, swings[idx2].time); //--- Get second bar
               int diff = MathAbs(bar1 - bar2);     //--- Calculate bar difference
               if (diff < MinBarSpacing) {          //--- Check minimum spacing
                  valid_spacing = false;            //--- Mark invalid spacing
                  break;                            //--- Exit loop
               }
            }
            if (valid_spacing) {                        //--- Check valid spacing
               datetime touch_times[];                  //--- Initialize touch times
               double touch_prices[];                   //--- Initialize touch prices
               ArrayResize(touch_times, touches);       //--- Resize times array
               ArrayResize(touch_prices, touches);      //--- Resize prices array
               for (int m = 0; m < touches; m++) {      //--- Iterate through touches
                  int idx = touch_indices[m];           //--- Get index
                  touch_times[m] = swings[idx].time;    //--- Set time
                  touch_prices[m] = swings[idx].price;  //--- Set price
               }
               double slope = initial_slope;            //--- Use initial slope from two points
               double intercept = price1 - slope * (double)time1; //--- Calculate intercept
               double rsquared = CalculateRSquared(touch_times, touch_prices, touches, slope, intercept); //--- Calculate R-squared
               if (rsquared >= MinRSquared) {           //--- Check minimum R-squared
                  int adjusted_touch_indices[];         //--- Initialize adjusted indices
                  ArrayResize(adjusted_touch_indices, touches); //--- Resize to current touches
                  ArrayCopy(adjusted_touch_indices, touch_indices); //--- Copy indices
                  int adjusted_touches = touches;       //--- Set adjusted touches
                  if (adjusted_touches >= MinTouches) { //--- Check minimum adjusted touches
                     datetime temp_min_time = swings[adjusted_touch_indices[0]].time; //--- Get min time
                     double temp_ref_price = intercept + slope * (double)temp_min_time; //--- Calculate ref price
                     if (ValidateTrendline(isSupport, temp_min_time, temp_min_time, temp_ref_price, slope, pen_tolerance)) { //--- Validate trendline
                        datetime temp_max_time = swings[adjusted_touch_indices[adjusted_touches - 1]].time; //--- Get max time
                        double temp_max_price = intercept + slope * (double)temp_max_time; //--- Calculate max price
                        double angle = CalculateAngle(temp_min_time, temp_ref_price, temp_max_time, temp_max_price); //--- Calculate angle
                        double abs_angle = MathAbs(angle); //--- Get absolute angle
                        if (abs_angle >= MinAngle && abs_angle <= MaxAngle) { //--- Check angle range
                           if (adjusted_touches > max_touches || (adjusted_touches == max_touches && rsquared > best_rsquared)) { //--- Check better trendline
                              max_touches = adjusted_touches; //--- Update max touches
                              best_rsquared = rsquared;       //--- Update best R-squared
                              best_j = j;                     //--- Update best j
                              best_slope = slope;             //--- Update best slope
                              best_intercept = intercept;     //--- Update best intercept
                              best_min_time = temp_min_time;  //--- Update best min time
                              ArrayResize(best_touch_indices, adjusted_touches); //--- Resize best indices
                              ArrayCopy(best_touch_indices, adjusted_touch_indices); //--- Copy indices
                           }
                        }
                     }
                  }
               }
            }
         }
      }
   }
   if (max_touches < MinTouches) {                        //--- Check insufficient touches
      string type = isSupport ? "Support" : "Resistance"; //--- Set type string
      return;                                             //--- Exit function
   }
   int touch_indices[];                                   //--- Initialize touch indices
   ArrayResize(touch_indices, max_touches);               //--- Resize touch indices
   ArrayCopy(touch_indices, best_touch_indices);          //--- Copy best indices
   int touches = max_touches;                             //--- Set touches count
   datetime min_time = best_min_time;                     //--- Set min time
   double price_min = best_intercept + best_slope * (double)min_time; //--- Calculate min price
   datetime max_time = swings[touch_indices[touches - 1]].time; //--- Set max time
   double price_max = best_intercept + best_slope * (double)max_time; //--- Calculate max price
   datetime start_time_check = min_time;                  //--- Set start time check
   double start_price_check = price_min;                  //--- Set start price check (approximate if not exact)
   if (IsStartingPointUsed(start_time_check, start_price_check, isSupport)) { //--- Check used starting point
      return; //--- Skip if used
   }
   datetime time_end = iTime(_Symbol, _Period, 0) + PeriodSeconds(_Period) * ExtensionBars; //--- Calculate end time
   double dk_end = (double)(time_end - min_time);         //--- Calculate end time difference
   double price_end = price_min + best_slope * dk_end;    //--- Calculate end price
   string unique_name = prefix + TimeToString(TimeCurrent(), TIME_DATE|TIME_MINUTES|TIME_SECONDS); //--- Generate unique name
   if (ObjectFind(0, unique_name) < 0) {                  //--- Check if trendline exists
      ObjectCreate(0, unique_name, OBJ_TREND, 0, min_time, price_min, time_end, price_end); //--- Create trendline
      ObjectSetInteger(0, unique_name, OBJPROP_COLOR, lineColor); //--- Set color
      ObjectSetInteger(0, unique_name, OBJPROP_STYLE, STYLE_SOLID); //--- Set style
      ObjectSetInteger(0, unique_name, OBJPROP_WIDTH, 1);  //--- Set width
      ObjectSetInteger(0, unique_name, OBJPROP_RAY_RIGHT, false); //--- Disable right ray
      ObjectSetInteger(0, unique_name, OBJPROP_RAY_LEFT, false); //--- Disable left ray
      ObjectSetInteger(0, unique_name, OBJPROP_BACK, false); //--- Set to foreground
   }
   ArrayResize(trendlines, numTrendlines + 1);               //--- Resize trendlines array
   trendlines[numTrendlines].name = unique_name;             //--- Set trendline name
   trendlines[numTrendlines].start_time = min_time;          //--- Set start time
   trendlines[numTrendlines].end_time = time_end;            //--- Set end time
   trendlines[numTrendlines].start_price = price_min;        //--- Set start price
   trendlines[numTrendlines].end_price = price_end;          //--- Set end price
   trendlines[numTrendlines].slope = best_slope;             //--- Set slope
   trendlines[numTrendlines].is_support = isSupport;         //--- Set type
   trendlines[numTrendlines].touch_count = touches;          //--- Set touch count
   trendlines[numTrendlines].creation_time = TimeCurrent();  //--- Set creation time
   trendlines[numTrendlines].is_signaled = false;            //--- Set signaled flag
   ArrayResize(trendlines[numTrendlines].touch_indices, touches); //--- Resize touch indices
   ArrayCopy(trendlines[numTrendlines].touch_indices, touch_indices); //--- Copy touch indices
   numTrendlines++;                                          //--- Increment trendlines count
   ArrayResize(startingPoints, numStartingPoints + 1);       //--- Resize starting points array
   startingPoints[numStartingPoints].time = start_time_check;//--- Set starting point time
   startingPoints[numStartingPoints].price = start_price_check; //--- Set starting point price
   startingPoints[numStartingPoints].is_support = isSupport; //--- Set starting point type
   numStartingPoints++;                                      //--- Increment starting points count
   if (DrawTouchArrows) {                                    //--- Check draw arrows
      for (int m = 0; m < touches; m++) {                    //--- Iterate through touches
         int idx = touch_indices[m];                         //--- Get touch index
         datetime tk_time = swings[idx].time;                //--- Get touch time
         double tk_price = swings[idx].price;                //--- Get touch price
         string arrow_name = unique_name + "_touch" + IntegerToString(m); //--- Generate arrow name
         if (ObjectFind(0, arrow_name) < 0) { //--- Check if arrow exists
            ObjectCreate(0, arrow_name, OBJ_ARROW, 0, tk_time, tk_price); //--- Create touch arrow
            ObjectSetInteger(0, arrow_name, OBJPROP_ARROWCODE, 159); //--- Set arrow code
            ObjectSetInteger(0, arrow_name, OBJPROP_ANCHOR, isSupport ? ANCHOR_TOP : ANCHOR_BOTTOM); //--- Set anchor
            ObjectSetInteger(0, arrow_name, OBJPROP_COLOR, lineColor); //--- Set color
            ObjectSetInteger(0, arrow_name, OBJPROP_WIDTH, 1); //--- Set width
            ObjectSetInteger(0, arrow_name, OBJPROP_BACK, false); //--- Set to foreground
         }
      }
   }
   double angle = CalculateAngle(min_time, price_min, max_time, price_max); //--- Calculate angle
   string type = isSupport ? "Support" : "Resistance"; //--- Set type string
   Print(type + " Trendline " + unique_name + " drawn with " + IntegerToString(touches) + " touches. Inclination angle: " + DoubleToString(angle, 2) + " degrees."); //--- Log trendline
   if (DrawLabels) {                                            //--- Check draw labels
      datetime mid_time = min_time + (max_time - min_time) / 2; //--- Calculate mid time
      double dk_mid = (double)(mid_time - min_time);            //--- Calculate mid time difference
      double mid_price = price_min + best_slope * dk_mid;       //--- Calculate mid price
      double label_offset = 20 * _Point * (isSupport ? -1 : 1); //--- Calculate label offset
      double label_price = mid_price + label_offset;            //--- Calculate label price
      int label_anchor = isSupport ? ANCHOR_TOP : ANCHOR_BOTTOM;//--- Set label anchor
      string label_text = type + " Trendline";                  //--- Set label text
      string label_name = unique_name + "_label";               //--- Generate label name
      if (ObjectFind(0, label_name) < 0) {                      //--- Check if label exists
         ObjectCreate(0, label_name, OBJ_TEXT, 0, mid_time, label_price); //--- Create label
         ObjectSetString(0, label_name, OBJPROP_TEXT, label_text); //--- Set text
         ObjectSetInteger(0, label_name, OBJPROP_COLOR, clrBlack); //--- Set color
         ObjectSetInteger(0, label_name, OBJPROP_FONTSIZE, 8);  //--- Set font size
         ObjectSetInteger(0, label_name, OBJPROP_ANCHOR, label_anchor); //--- Set anchor
         ObjectSetDouble(0, label_name, OBJPROP_ANGLE, angle);  //--- Set angle
         ObjectSetInteger(0, label_name, OBJPROP_BACK, false);  //--- Set to foreground
      }
      color point_label_color = isSupport ? clrSaddleBrown : clrDarkGoldenrod; //--- Set point label color
      double point_text_offset = 20.0 * _Point;    //--- Set point text offset
      for (int m = 0; m < touches; m++) {          //--- Iterate through touches
         int idx = touch_indices[m];               //--- Get touch index
         datetime tk_time = swings[idx].time;      //--- Get touch time
         double tk_price = swings[idx].price;      //--- Get touch price
         double text_price;                        //--- Initialize text price
         int point_text_anchor;                    //--- Initialize text anchor
         if (isSupport) {                          //--- Handle support
            text_price = tk_price - point_text_offset; //--- Set text price below
            point_text_anchor = ANCHOR_LEFT;       //--- Set left anchor
         } else {                                  //--- Handle resistance
            text_price = tk_price + point_text_offset; //--- Set text price above
            point_text_anchor = ANCHOR_BOTTOM;     //--- Set bottom anchor
         }
         string text_name = unique_name + "_point_label" + IntegerToString(m); //--- Generate text name
         string point_text = "Pt " + IntegerToString(m + 1); //--- Set point text
         if (ObjectFind(0, text_name) < 0) { //--- Check if text exists
            ObjectCreate(0, text_name, OBJ_TEXT, 0, tk_time, text_price); //--- Create text
            ObjectSetString(0, text_name, OBJPROP_TEXT, point_text); //--- Set text
            ObjectSetInteger(0, text_name, OBJPROP_COLOR, point_label_color); //--- Set color
            ObjectSetInteger(0, text_name, OBJPROP_FONTSIZE, 8); //--- Set font size
            ObjectSetInteger(0, text_name, OBJPROP_ANCHOR, point_text_anchor); //--- Set anchor
            ObjectSetDouble(0, text_name, OBJPROP_ANGLE, 0); //--- Set angle
            ObjectSetInteger(0, text_name, OBJPROP_BACK, false); //--- Set to foreground
         }
      }
   }
}
Aquí implementamos la lógica de detección y visualización de líneas de tendencia. En primer lugar, en la función «FindAndDrawTrendlines», comprobamos si existen líneas de tendencia del tipo «isSupport» en «trendlines», estableciendo «has_active» en «true» y saliendo de la función si se encuentra alguna. A continuación, inicializamos un array «swings», copiando «swingLows» o «swingHighs» en función de «isSupport», estableciendo «lineColor» en «SupportLineColor» o «ResistanceLineColor» y «prefix» en «Trendline_Support_» o «Trendline_Resistance_», y salimos si hay menos de dos puntos de giro.
A continuación, calculamos las tolerancias («TouchTolerance» y «PenetrationTolerance», multiplicadas por _Point) y recorremos los pares de puntos de giro para calcular «initial_slope», recopilando en «touch_indices» los puntos de contacto que se encuentran dentro de «touch_tolerance». Validamos los puntos de contacto con «MinTouches» y «MinBarSpacing» utilizando iBarShift y ArraySort, calculamos la pendiente («slope») y la ordenada en el origen («intercept»), y evaluamos «CalculateRSquared» y «ValidateTrendline» para seleccionar la mejor línea de tendencia en función de «max_touches» y «best_rsquared». Si la línea de tendencia es válida, la trazamos utilizando «ObjectCreate» (OBJ_TREND) con «unique_name», configuramos propiedades como OBJPROP_COLOR y «OBJPROP_STYLE», y desactivamos la prolongación en ambos sentidos; a continuación, la almacenamos en «trendlines» con detalles como «start_time», «end_time» (extendido mediante «ExtensionBars») y «touch_indices». Actualizamos «startingPoints» con «IsStartingPointUsed» para evitar duplicados y, si «DrawTouchArrows» es «true», dibujamos flechas (OBJ_ARROW) en los puntos de contacto con el color «lineColor» y los anclajes adecuados.
Si «DrawLabels» es «true», añadimos una etiqueta de línea de tendencia (OBJ_TEXT) con «type + ' Trendline'» en el punto medio, con un ángulo calculado mediante «CalculateAngle», y etiquetas de puntos («Pt 1», etc.) con los colores «clrSaddleBrown» o «clrDarkGoldenrod», y registramos los detalles de la línea de tendencia. Lo que queda ahora es gestionar las líneas de tendencia existentes mediante actualizaciones continuas y comprobar si se producen cruces que generen señales. Para simplificar, incorporaremos toda la lógica en una única función.
//+------------------------------------------------------------------+
//| Update trendlines and check for signals                          |
//+------------------------------------------------------------------+
void UpdateTrendlines() {
   datetime current_time = iTime(_Symbol, _Period, 0);     //--- Get current time
   double pointValue = _Point;                             //--- Get point value
   double pen_tolerance = PenetrationTolerance * pointValue; //--- Calculate penetration tolerance
   double touch_tolerance = TouchTolerance * pointValue;   //--- Calculate touch tolerance
   for (int i = numTrendlines - 1; i >= 0; i--) {          //--- Iterate trendlines backward
      string type = trendlines[i].is_support ? "Support" : "Resistance"; //--- Determine trendline type
      string name = trendlines[i].name;                    //--- Get trendline name
      if (current_time > trendlines[i].end_time) {         //--- Check if expired
         PrintFormat("%s trendline %s is no longer valid (expired). End time: %s, Current time: %s.", type, name, TimeToString(trendlines[i].end_time), TimeToString(current_time)); //--- Log expiration
         RemoveTrendlineFromStorage(i);                    //--- Remove trendline
         continue;                                         //--- Skip to next
      }
      datetime prev_bar_time = iTime(_Symbol, _Period, 1); //--- Get previous bar time
      double dk = (double)(prev_bar_time - trendlines[i].start_time); //--- Calculate time difference
      double line_price = trendlines[i].start_price + trendlines[i].slope * dk; //--- Calculate line price
      double prev_close = iClose(_Symbol, _Period, 1);     //--- Get previous bar close
      double prev_low = iLow(_Symbol, _Period, 1);         //--- Get previous bar low
      double prev_high = iHigh(_Symbol, _Period, 1);       //--- Get previous bar high
      bool broken = false;                                 //--- Initialize broken flag
      if (BreakoutType == BREAKOUT_CLOSE) {                //--- Check breakout on close
         if (trendlines[i].is_support && prev_close < line_price) { //--- Support break by close
            PrintFormat("%s trendline %s is no longer valid (broken by close). Line price: %.5f, Prev close: %.5f.", type, name, line_price, prev_close); //--- Log break
            broken = true;                                 //--- Set broken flag
         } else if (!trendlines[i].is_support && prev_close > line_price) { //--- Resistance break by close
            PrintFormat("%s trendline %s is no longer valid (broken by close). Line price: %.5f, Prev close: %.5f.", type, name, line_price, prev_close); //--- Log break
            broken = true;                                 //--- Set broken flag
         }
      } else if (BreakoutType == BREAKOUT_CANDLE) {        //--- Check breakout on entire candle
         if (trendlines[i].is_support && prev_high < line_price) { //--- Entire candle below support
            PrintFormat("%s trendline %s is no longer valid (entire candle below). Line price: %.5f, Prev high: %.5f.", type, name, line_price, prev_high); //--- Log break
            broken = true;                                 //--- Set broken flag
         } else if (!trendlines[i].is_support && prev_low > line_price) { //--- Entire candle above resistance
            PrintFormat("%s trendline %s is no longer valid (entire candle above). Line price: %.5f, Prev low: %.5f.", type, name, line_price, prev_low); //--- Log break
            broken = true;                                  //--- Set broken flag
         }
      }
      if (broken && EnableTradingSignals && !trendlines[i].is_signaled) { //--- Check for breakout signal
         bool signaled = false;                           //--- Initialize signaled flag
         string signal_type = "";                         //--- Initialize signal type
         color signal_color = clrNONE;                    //--- Initialize signal color
         int arrow_code = 0;                              //--- Initialize arrow code
         int anchor = 0;                                  //--- Initialize anchor
         double text_angle = 0.0;                         //--- Initialize text angle
         double text_offset = 0.0;                        //--- Initialize text offset
         double text_price = 0.0;                         //--- Initialize text price
         int text_anchor = 0;                             //--- Initialize text anchor
         if (trendlines[i].is_support) {                  //--- Support break: SELL
            signaled = true;                              //--- Set signaled flag
            signal_type = "SELL BREAK";                   //--- Set sell break signal
            signal_color = clrRed;                        //--- Set red color
            arrow_code = 218;                             //--- Set down arrow
            anchor = ANCHOR_BOTTOM;                       //--- Set bottom anchor
            text_angle = 90.0;                            //--- Set vertical downward
            text_offset = 20 * pointValue;                //--- Set text offset
            text_price = line_price + text_offset;        //--- Calculate text price
            text_anchor = ANCHOR_BOTTOM;                  //--- Set bottom anchor
            double Bid = NormalizeDouble(SymbolInfoDouble(_Symbol, SYMBOL_BID), _Digits); //--- Get bid price
            double SL = NormalizeDouble(line_price + inpSLPoints * _Point, _Digits); //--- SL above the line
            double risk = SL - Bid;                       //--- Calculate risk
            double TP = NormalizeDouble(Bid - risk * inpRRRatio, _Digits); //--- Calculate take profit
            obj_Trade.Sell(inpLot, _Symbol, Bid, SL, TP); //--- Execute sell trade
         } else {                                         //--- Resistance break: BUY
            signaled = true;                              //--- Set signaled flag
            signal_type = "BUY BREAK";                    //--- Set buy break signal
            signal_color = clrBlue;                       //--- Set blue color
            arrow_code = 217;                             //--- Set up arrow
            anchor = ANCHOR_TOP;                          //--- Set top anchor
            text_angle = -90.0;                           //--- Set vertical upward
            text_offset = -20 * pointValue;               //--- Set text offset
            text_price = line_price + text_offset;        //--- Calculate text price
            text_anchor = ANCHOR_LEFT;                    //--- Set left anchor
            double Ask = NormalizeDouble(SymbolInfoDouble(_Symbol, SYMBOL_ASK), _Digits); //--- Get ask price
            double SL = NormalizeDouble(line_price - inpSLPoints * _Point, _Digits); //--- SL below the line
            double risk = Ask - SL;                       //--- Calculate risk
            double TP = NormalizeDouble(Ask + risk * inpRRRatio, _Digits); //--- Calculate take profit
            obj_Trade.Buy(inpLot, _Symbol, Ask, SL, TP);  //--- Execute buy trade
         }
         if (signaled) { //--- Check if signaled
            PrintFormat("Breakout signal generated for %s trendline %s: %s at price %.5f, time %s.", type, name, signal_type, line_price, TimeToString(current_time)); //--- Log signal
            string arrow_name = name + "_signal_arrow"; //--- Generate signal arrow name
            if (ObjectFind(0, arrow_name) < 0) { //--- Check if arrow exists
               ObjectCreate(0, arrow_name, OBJ_ARROW, 0, prev_bar_time, line_price); //--- Create signal arrow
               ObjectSetInteger(0, arrow_name, OBJPROP_ARROWCODE, arrow_code); //--- Set arrow code
               ObjectSetInteger(0, arrow_name, OBJPROP_ANCHOR, anchor); //--- Set anchor
               ObjectSetInteger(0, arrow_name, OBJPROP_COLOR, signal_color); //--- Set color
               ObjectSetInteger(0, arrow_name, OBJPROP_WIDTH, 1); //--- Set width
               ObjectSetInteger(0, arrow_name, OBJPROP_BACK, false); //--- Set to foreground
            }
            string text_name = name + "_signal_text"; //--- Generate signal text name
            if (ObjectFind(0, text_name) < 0) { //--- Check if text exists
               ObjectCreate(0, text_name, OBJ_TEXT, 0, prev_bar_time, text_price); //--- Create signal text
               ObjectSetString(0, text_name, OBJPROP_TEXT, " " + signal_type); //--- Set text content
               ObjectSetInteger(0, text_name, OBJPROP_COLOR, signal_color); //--- Set color
               ObjectSetInteger(0, text_name, OBJPROP_FONTSIZE, 10); //--- Set font size
               ObjectSetInteger(0, text_name, OBJPROP_ANCHOR, text_anchor); //--- Set anchor
               ObjectSetDouble(0, text_name, OBJPROP_ANGLE, text_angle); //--- Set angle
               ObjectSetInteger(0, text_name, OBJPROP_BACK, false); //--- Set to foreground
            }
            trendlines[i].is_signaled = true; //--- Set signaled flag
         }
      }
      if (broken) {                           //--- Remove if broken
         RemoveTrendlineFromStorage(i);       //--- Remove trendline
      }
   }
}
Para implementar la lógica de actualización de las líneas de tendencia y de trading de rupturas, en la función «UpdateTrendlines» obtenemos la hora de la barra actual con iTime y calculamos «pointValue», «pen_tolerance» («PenetrationTolerance * pointValue») y «touch_tolerance» («TouchTolerance * pointValue»). A continuación, recorremos «trendlines» en orden inverso, determinando el tipo («type»: soporte o resistencia) y el nombre («name»), y comprobamos si la línea de tendencia ha caducado mediante «current_time > end_time»; si ha caducado, lo registramos con PrintFormat y la eliminamos con «RemoveTrendlineFromStorage».
A continuación, calculamos el precio de la línea de tendencia en la barra anterior («prev_bar_time», obtenido con «iTime») mediante «start_price + slope * (prev_bar_time - start_time)» y comprobamos si se producen rupturas: si «BreakoutType» es «BREAKOUT_CLOSE», verificamos si el cierre de la barra anterior, «prev_close» (iClose), está por debajo de «line_price» en el caso del soporte o por encima en el de la resistencia, lo registramos con «PrintFormat» y establecemos «broken» en «true»; si es «BREAKOUT_CANDLE», comprobamos si el máximo de la barra anterior, «prev_high» («iHigh»), está por debajo de «line_price» en el caso del soporte, o si el mínimo, «prev_low» (iLow), está por encima en el de la resistencia, lo registramos y marcamos la línea como rota.
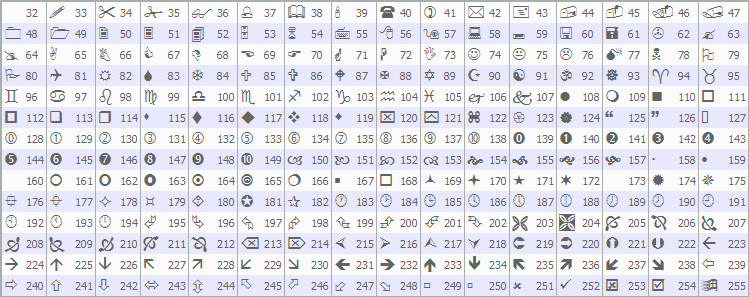
Si se produce una ruptura y «EnableTradingSignals» es «true» e «is_signaled» es «false», establecemos los parámetros de la operación: para el soporte (venta), asignamos «SELL BREAK» a «signal_type», usamos el color rojo y una flecha hacia abajo (218), y calculamos el precio bid (SymbolInfoDouble), el stop loss («line_price + inpSLPoints * _Point»), el riesgo y el take profit utilizando «inpRRRatio», y ejecutamos la operación con «obj_Trade.Sell»; para la resistencia (compra), usamos «BUY BREAK», el color azul y una flecha hacia arriba (217), y calculamos el precio ask, el stop loss y el take profit, y ejecutamos la operación con «obj_Trade.Buy». A continuación, dibujamos una flecha de señal («OBJ_ARROW») y texto («OBJ_TEXT») con «ObjectCreate», configurando propiedades como «OBJPROP_ARROWCODE», «OBJPROP_ANCHOR» y «OBJPROP_COLOR», registramos la señal con «PrintFormat», establecemos «is_signaled» en «true» y eliminamos del almacenamiento las líneas de tendencia rotas. La elección de los códigos de flecha que quieras utilizar depende de ti. A continuación se muestra una lista de códigos que puedes utilizar de entre los códigos Wingdings definidos por MQL5.
Ahora podemos llamar a estas funciones en el manejador de eventos OnTick para que el sistema proporcione información en cada tick.
//+------------------------------------------------------------------+
//| Expert tick function                                             |
//+------------------------------------------------------------------+
void OnTick() {
   if (!IsNewBar()) return;      //--- Exit if not new bar
   DetectSwings();               //--- Detect swings
   UpdateTrendlines();           //--- Update trendlines
   FindAndDrawTrendlines(true);  //--- Find/draw support trendlines
}
En la función OnTick, primero llamamos a «IsNewBar» para comprobar si hay una nueva barra y, si no la hay, salimos de la función para optimizar el rendimiento. Si se detecta una nueva barra, llamamos a la función «DetectSwings» para identificar los máximos de giro y los mínimos de giro, y a continuación a «UpdateTrendlines» para comprobar si hay rupturas o líneas de tendencia caducadas y ejecutar operaciones si procede. A continuación, llamamos a «FindAndDrawTrendlines» con el valor «true» para detectar y trazar líneas de tendencia de soporte, asegurándonos de que solo se visualicen las líneas de tendencia válidas. Tras la compilación, obtenemos el siguiente resultado.
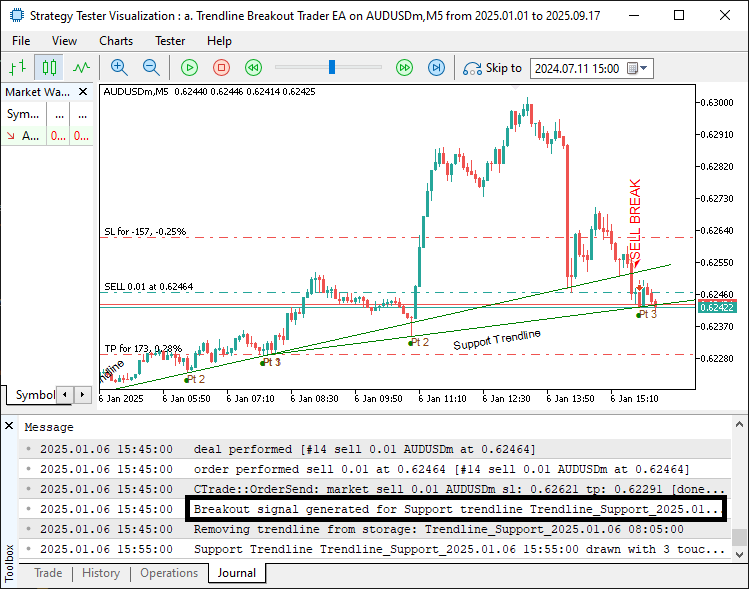
En la imagen podemos ver que identificamos, analizamos y trazamos la línea de tendencia, y operamos cuando se produce su ruptura. Las líneas caducadas también se eliminan correctamente de la matriz de almacenamiento. Podemos conseguir lo mismo con las líneas de tendencia de resistencia llamando a la misma función que para las líneas de tendencia de soporte, pero indicando «false» como parámetro de entrada.
//--- other ontick functions

FindAndDrawTrendlines(false);                   //--- Find/draw resistance trendlines

//---
Tras añadir la llamada a la función y compilar, obtenemos el siguiente resultado.
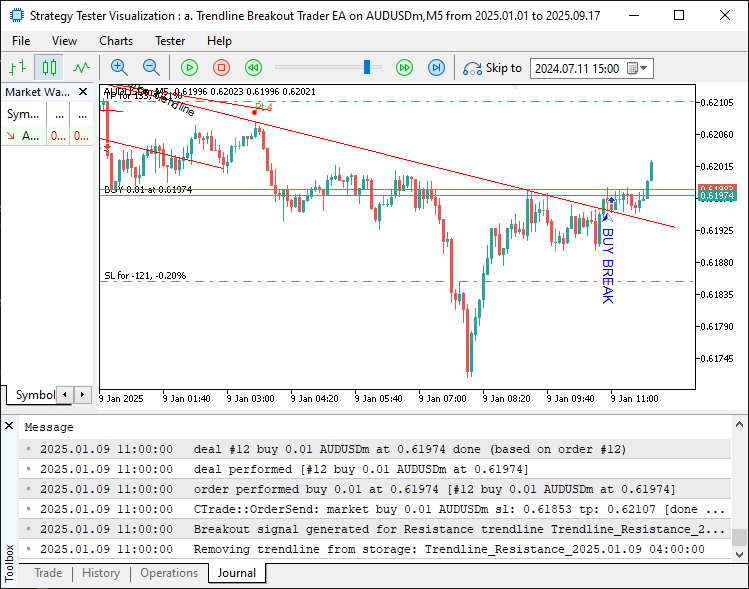
En la imagen podemos ver que también detectamos y operamos en función de las líneas de tendencia de resistencia. Cuando probamos y combinamos todo, obtenemos el siguiente resultado.
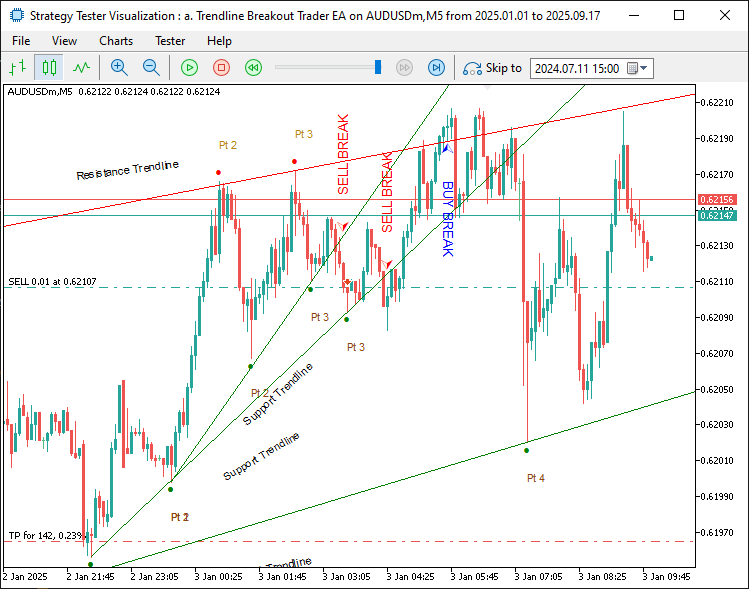
En la imagen podemos ver que detectamos las líneas de tendencia, las visualizamos y actuamos en consecuencia cuando el precio las rompe, logrando así nuestros objetivos. Solo queda realizar las pruebas retrospectivas del programa, que se abordan en la siguiente sección.
Backtesting
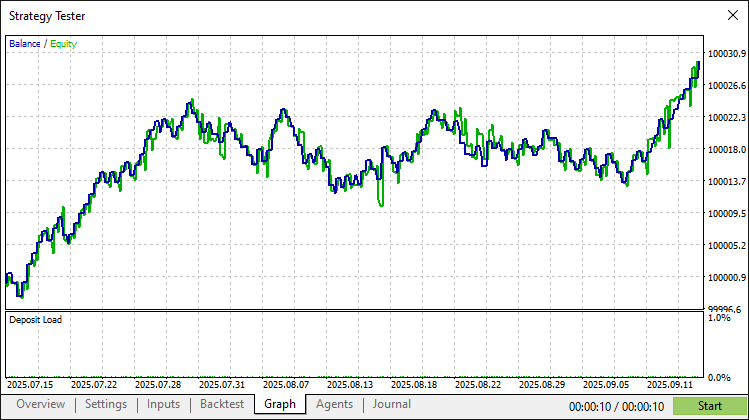
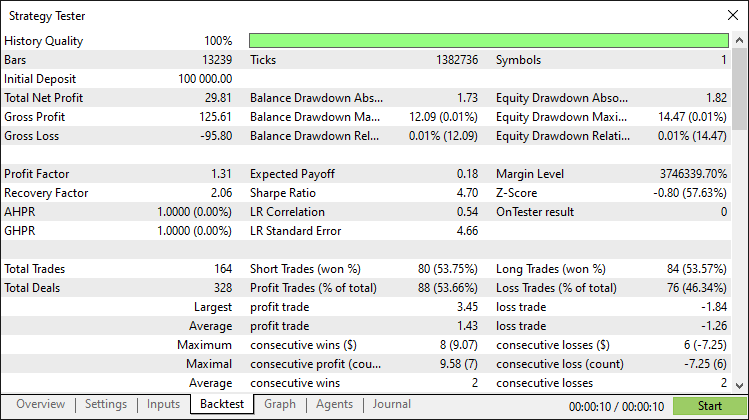
Tras realizar unas pruebas retrospectivas exhaustivas, hemos obtenido los siguientes resultados.
Gráfico de las pruebas retrospectivas:
Informe de las pruebas retrospectivas:
Conclusión
En conclusión, hemos desarrollado un sistema de trading de rupturas de líneas de tendencia en MQL5 que utiliza puntos de giro para identificar líneas de tendencia de soporte y resistencia y validarlas mediante la bondad de ajuste medida por R², y que ejecuta operaciones de ruptura con parámetros de riesgo personalizables. El sistema mejora las decisiones de trading mediante visualizaciones dinámicas, como líneas de tendencia, flechas que señalan los puntos de contacto y etiquetas, lo que garantiza un análisis claro del mercado.
Aviso legal: el presente artículo tiene fines únicamente educativos. Las operaciones de trading conllevan riesgos financieros importantes, y la volatilidad del mercado puede dar lugar a pérdidas. Resulta fundamental realizar un backtesting exhaustivo y aplicar una gestión del riesgo rigurosa antes de implementar este programa en mercados reales.
Al aplicar esta estrategia de rupturas de líneas de tendencia, estarás preparado para aprovechar los movimientos del mercado y podrás seguir personalizándola a medida que avances en tu trayectoria como operador. ¡Le deseo un buen trading!
Traducción del inglés realizada por MetaQuotes Ltd.
Artículo original: https://www.mql5.com/en/articles/19625
Advertencia: todos los derechos de estos materiales pertenecen a MetaQuotes Ltd. Queda totalmente prohibido el copiado total o parcial.
Este artículo ha sido escrito por un usuario del sitio web y refleja su punto de vista personal. MetaQuotes Ltd. no se responsabiliza de la exactitud de la información ofrecida, ni de las posibles consecuencias del uso de las soluciones, estrategias o recomendaciones descritas.

 Utilizando redes neuronales en MetaTrader
 Predicción de una distribución condicional mediante un perceptrón multicapa (MLP)
 Particularidades del trabajo con números del tipo double en MQL4
 Creación de un sistema de trading (Parte 4): Cómo influyen las salidas aleatorias en la esperanza matemática del trading

- Aplicaciones de trading gratuitas
- 8 000+ señales para copiar
- Noticias económicas para analizar los mercados financieros
Usted acepta la política del sitio web y las condiciones de uso
Genial, muchas gracias por compartirlo. Te agradezco de verdad que hayas compartido (todos tus códigos); es un código sólido y bien comentado, ¡una plantilla excelente para partir de ahí! Es algo que he intentado crear yo mismo, pero desde luego no está tan bien elaborado como esto.