Stochastic Divergence Level

5
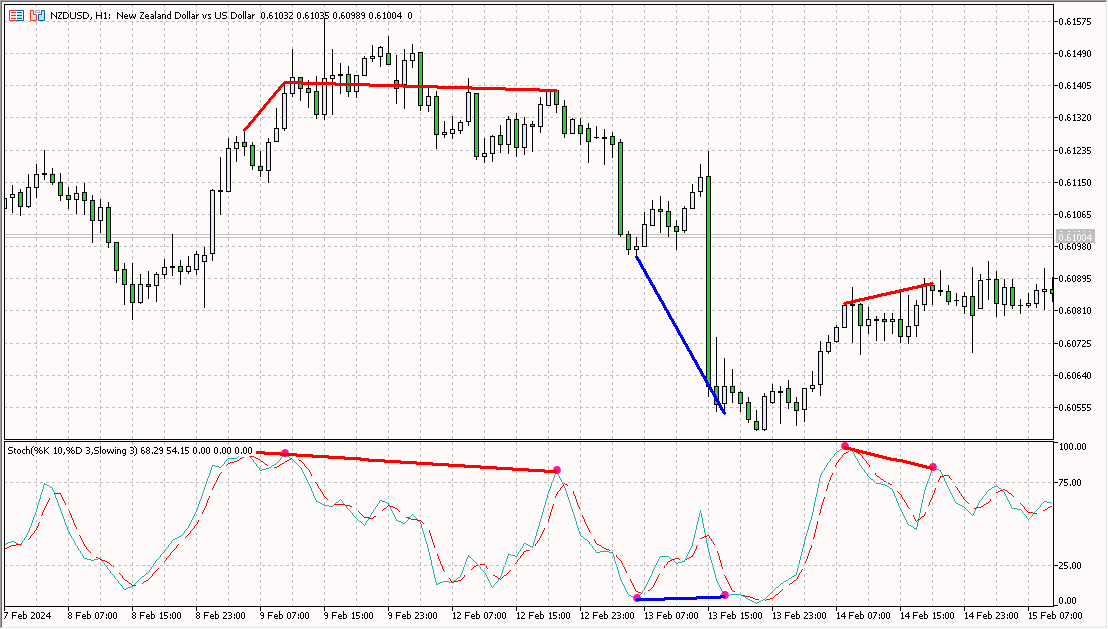
The indicator shows bullish and bearish divergence. The indicator itself (like regular stochastic) is displayed in a subwindow.
Graphical interface :
In the main window, graphical objects “trend line” are created - produced from the “Low” price to the “Low” price (for bullish divergence) and produced from the “High” price to the “High” price (for bearish divergence). The indicator draws in its window exclusively using graphic buffers: “Main”, “Signal”, “Dot”, “Buy” and “Sell”. The "Buy" and "Sell" buffers display divergence - since these are real indicator buffers, they can all be read from the EA.
The Dot buffer is used to visualize divergence points more clearly.
Options :
"Strict signals" - if you set this parameter to "true", then the bullish divergence will only be for the values "main" <= "Value Level #1" (default is '25'), and the bearish divergence will only be for the values "main" > = "Value Level #2" (default is '75').

1.15 "Max bars" now limits the number of bars for drawing - this also increased the speed of launching the indicator.

Reviews 1
Kaziel
190
Kaziel 2024.03.07 18:35 
 

Simple and accurate - very good support from a knowledgeable developer.

Recommended products
Noize Absorption Index - is the manual trading system that measures the difference of pressure between bears forces and bulls forces. Green line - is a noize free index that showing curent situation. Zero value of index shows totally choppy/flat market.Values above zero level shows how powerfull bullish wave is and values below zero measures bearish forces.Up arrow appears on bearish market when it's ready to reverse, dn arrow appears on weak bullish market, as a result of reverse expectation.
The SMC Venom Model BPR indicator is a professional tool for traders working within the Smart Money (SMC) concept. It automatically identifies two key patterns on the price chart: FVG   (Fair Value Gap) is a combination of three candles, in which there is a gap between the first and third candles. It forms a zone between levels where there is no volume support, which often leads to a price correction. BPR   (Balanced Price Range) is a combination of two FVG patterns that form a “bridge” - a zon
Trade smarter, not harder: Empower your trading with Harmonacci Patterns This is arguably the most complete harmonic price formation auto-recognition indicator you can find for the MetaTrader Platform. It detects 19 different patterns, takes fibonacci projections as seriously as you do, displays the Potential Reversal Zone (PRZ) and finds suitable stop-loss and take-profit levels. [ Installation Guide | Update Guide | Troubleshooting | FAQ | All Products ] It detects 19 different harmonic pri
Premium level is a unique indicator with more than 80% accuracy of correct predictions! This indicator has been tested for more than two months by the best Trading Specialists! The author's indicator you will not find anywhere else! From the screenshots you can see for yourself the accuracy of this tool! 1 is great for trading binary options with an expiration time of 1 candle. 2 works on all currency pairs, stocks, commodities, cryptocurrencies Instructions: As soon as the red arrow app
Mine Farm
Maryna Kauzova
Mine Farm is one of the most classic and time-tested scalping strategies based on the breakdown of strong price levels. Mine Farm is the author's modification of the system for determining entry and exit points into the market... Mine Farm - is the combination of great potential with reliability and safety. Why Mine Farm?! - each order has a short dynamic Stop Loss - the advisor does not use any risky methods (averaging, martingale, grid, locking, etc.) - the advisor tries to get the most
Owl Smart Levels MT5
Sergey Ermolov
4.03 (32)
MT4 version  |   FAQ The Owl Smart Levels Indicator is a complete trading system within the one indicator that includes such popular market analysis tools as Bill Williams' advanced fractals , Valable ZigZag which builds the correct wave structure of the market, and Fibonacci levels which mark the exact levels of entry into the market and places to take profits. Detailed description of the strategy Instructions for working with the indicator Advisor-assistant in trading Owl Helper Private User
Volume Profile V6
Andrey Kolesnik
4.67 (3)
The volume profile indicator of the market + a smart oscillator. It works on almost all instruments-currency pairs, stocks, futures, cryptocurrency, on real volumes and on tick ones. You can set both the automatic definition of the profile range, for example, for a week or a month, etc., and set the range manually by moving the boundaries (two vertical lines red and blue). It is shown as a histogram. The width of the histogram at this level means, conditionally, the number of transactions condu
PZ Support Resistance MT5
PZ TRADING SLU
3.71 (7)
Unlock key market insights with automated support and resistance lines Tired of plotting support and resistance lines? This is a multi-timeframe indicator that detects and plots supports and resistance lines in the chart with the same precision as a human eye would. As price levels are tested over time and its importance increases, the lines become thicker and darker, making price leves easy to glance and evaluate. [ Installation Guide | Update Guide | Troubleshooting | FAQ | All Products ] Boos
Double HMA MTF for MT5
Pavel Zamoshnikov
4 (4)
This is an advanced multi-timeframe version of the popular Hull Moving Average (HMA) Features Two lines of the Hull indicator of different timeframes on the same chart. The HMA line of the higher timeframe defines the trend, and the HMA line of the current timeframe defines the short-term price movements. A graphical panel with HMA indicator data from all timeframes at the same time . If the HMA switched its direction on any timeframe, the panel displays a question or exclamation mark with a tex
##   ONLY GOLD ##   Тiльки Золото ## **Mercaria Professional Trading Zones - Complete Guide** ## **Mercaria Professional Trading Zones - Повний посібник** ### **How Mercaria Zones Work / Як працюють зони Mercaria** **English:** Mercaria Zones is an advanced trading indicator that identifies high-probability support and resistance areas using ZigZag extremes combined with mathematical zone calculations. The indicator works on multiple timeframes simultaneously, providing a comprehensive view
Overview Harmonic Patterns MT5 is a technical analysis indicator designed for the MetaTrader 5 platform. It identifies and displays harmonic price patterns, such as Butterfly, Cypher, Crab, Bat, Shark, and Gartley, in both bullish and bearish directions. The indicator calculates key price levels, including entry, stop loss, and three take-profit levels, to assist traders in analyzing market movements. Visual elements and customizable alerts enhance usability on the chart. Features Detects six ha
TRI Visualizer
Yoshimi Mon 三 Ura
TRI Visualizer MT5 – Thermodynamic Market Analysis Overview The TRI (Thermal Range Indicator) Visualizer Enhanced is a rare market analysis indicator that goes beyond conventional technical analysis, applying principles of thermodynamics from physics. It interprets market price fluctuations as “thermodynamic energy,” enabling the highly accurate detection of subtle market changes that are often overlooked. Innovative Mechanisms 1. Dual Calculation Engines Classic TRI Mode Formula: |Close
The RSI Divergence + FVG Signal indicator combines Relative Strength Index (RSI) Divergence with Fair Value Gap (FVG) detection to generate high-probability buy and sell signals based on both momentum shifts and institutional imbalance zones. Core Features: RSI Divergence Detection : Identifies both regular and hidden bullish/bearish divergences between price and RSI. Divergences indicate potential trend reversals or continuation. FVG Zone Recognition : Detects Fair Value Gaps (imbalances caused
**   All Symbols   x   All Timeframes   scan just by pressing scanner button ** Discount: The price is $50$, But now it is just $39, Limited time offer is active. *** Contact me  to send you instruction and add you in "Trend Reversal group" for sharing or seeing experiences with other users. Introduction: Trendlines are the most famous technical analysis in trading . Trendlines continually form on the charts of markets across all the different timeframes providing huge opportunities for traders
An indicator of pattern #31 ("Long Island") from Encyclopedia of Chart Patterns by Thomas N. Bulkowski. The second gap is in the opposite direction. Parameters: Alerts - show alert when an arrow appears   Push - send a push notification when an arrow appears (requires configuration in the terminal) GapSize - minimum gap size in points ArrowType - a symbol from 1 to 17 ArrowVShift - vertical shift of arrows in points   ShowLevels - show levels ColUp - color of an upward line ColDn - color of a d
Auto Optimized RSI   is a smart and easy-to-use arrow indicator designed for precision trading. It automatically finds the most effective RSI Buy and Sell levels for your selected symbol and timeframe using real historical data simulations. The indicator can be used as a standalone system or as part of your existing trading strategy. It is especially useful for intraday trading. Unlike traditional RSI indicators that rely on fixed 70/30 levels,   Auto Optimized RSI   dynamically adjusts its lev
The indicator shows harmonic patterns on the chart without repainting with the minimum possible lag. The search for indicator tops is based on the wave principle of price analysis. Advanced settings allow you to choose parameters for your trading style. At the opening of a candle (bar), when a new pattern is formed, an arrow of the probable direction of the price movement is fixed, which remains unchanged. The indicator recognizes the following patterns and their varieties: ABCD, Gartley (Butter
This is an MTF indicator of support and resistance levels based on Advanced ZigZag Dynamic and/or Extended Fractals indicator extremums with price labels (can be disabled). More higher TFs can be selected for MTF mode. By default, the levels are generated based on ZigZag indicator dots. Fractals indicator dots can also be used together with ZigZag or instead of it. In order to simplify the use and save CPU time, calculation is performed once per each bar at its opening. Parameters: ForcedTF - ch
Rainbow EA MT5
Jamal El Alama
Description : Rainbow EA MT5 is a simple Expert advisor based on   Rainbow MT5 indicator witch is based on Moving average with period 34. The indicator is incorporated in the EA, therefore, it is not required for the EA to operate, but if you wish, you can download it from   my product page . The Expert Advisor settings are as follows : Suitable for Timeframes up to H1 The parameters below can be set according to your trading rules. StopLoss ( Stop Loss in pips) TakeProfit ( Take Profit in pips
Terra Infinity is a flat indicator. This improved version of the CalcFlat indicator has three additional lines that significantly increase its effectiveness. Unlike its predecessor with two static levels, Terra Infinity adds three dynamic lines above the main histogram, which are interpreted as follows: base signal line, minimum signal line, maximum signal line. These lines are formed using the additional parameter Avg, which is the average value of the histogram. Averaging produces a line cl
The indicator automatically identifies and labels essential elements of market structure shift, including: Break of Structure (BoS): Detected when there is a significant price movement breaking previous structural points. It mark possible uptrend and downtrend lines(UP & DN, It means constantly update high and low ), and once the price breaks through these lines, mark the red (BEAR) and green (BULL) arrows. BoS typically occurs when the price decisively moves through swing lows or swing highs t
Welcome to the Ultimate Harmonic Patterns recognition indicator that is focused to detect advanced patterns. The Gartley pattern, Bat pattern, and Cypher pattern  are popular technical analysis tools used by traders to identify potential reversal points in the market. Our Ultimate Harmonic Patterns recognition Indicator is a powerful tool that uses advanced algorithms to scan the markets and identify these patterns in real-time. With our Ultimate Harmonic Patterns recognition Indicator, you ca
Was: $249  Now: $99   Market Profile defines a number of day types that can help the trader to determine market behaviour. A key feature is the Value Area, representing the range of price action where 70% of trading took place. Understanding the Value Area can give traders valuable insight into market direction and establish the higher odds trade. It is an excellent addition to any system you may be using. Inspired by Jim Dalton’s book “Mind Over Markets”, this indicator is designed to suit the
Your Trend Friend
Luigi Nunes Labigalini
5 (1)
The trend is your friend! Look at the color of the indicator and trade on that direction. It does not  repaint. After each candle is closed, that's the color of the trend. You can focus on shorter faster trends or major trends, just test what's most suitable for the symbol and timeframe you trade. Simply change the "Length" parameter and the indicator will automatically adapt. You can also change the color, thickness and style of the lines. Download and give it a try! There are big movements w
RR Ratio KS Visual Calculator Unlock effortless risk-reward mastery with the RR Ratio KS Visual Calculator —a sleek, professional MetaTrader 5 indicator that automates TP/SL calculations and delivers crystal-clear visual setups directly on your chart. No more tedious manual math or miscalculations: it instantly computes precise dollar amounts based on your lot size and position direction (buy/sell), displaying interactive lines for TP, SL, half-price targets, and open levels. Perfect for traders
Cumulative delta indicator As most traders believe, the price moves under the pressure of market buying or selling. When someone redeems an offer standing in the cup, the deal is a "buy". If someone pours into the bid standing in the cup - the deal goes with the direction of "sale". The delta is the difference between purchases and sales. A cumulative delta - the difference between the cumulative sum of purchases and sales for a certain period of time. It allows you to see who is currently contr
Harmonic Pattern Suite Pro Introduction Harmonic Pattern Suite Pro is an indicator designed to identify and display harmonic structures on the chart based on X-A-B-C-D sequences. Its purpose is to present pattern formations that meet geometric and proportional criteria, providing a clear visual representation directly on the chart. The indicator automates the detection process, removing the need for manual measurement of ratios and allowing the user to review the structural configuration withou
FREE
Pro Gold System Indicator
PEDRO JOAQUIM GONCALVES GOMES
ADVANCED FUNCTIONALITIES: Trend Score (0-100) with visual bar Intelligent signals with adjustable strength (1-10) Risk management with automatic TP/SL Audible and visual alerts Price zones with smooth filling Multi-indicator analysis (RSI, ATR, BB, EMAs) DESIGN FEATURES Modern Visual: Smooth and well-spaced lines (EMA with 2-3px width) Vibrant and professional colors (Sky Blue, Orange, Gold) Modern arrows (code 233/234) for buy/sell signals Configurable dark/light theme Adjustable transparency f
One of the number sequences is called "Forest Fire Sequence". It has been recognized as one of the most beautiful new sequences. Its main feature is that this sequence avoids linear trends, even the shortest ones. It is this property that formed the basis of this indicator. When analyzing a financial time series, this indicator tries to reject all possible trend options. And only if he fails, then he recognizes the presence of a trend and gives the appropriate signal. This approach allows one t
Volume Delta Candle
Muhammad Muzaffar Hussan
Volume Delta Candles: A Comprehensive Tool for In-Depth Trading Analysis Unlock a seamless way to interpret trading experience within each candle. With Volume Delta Candles, there's no need for additional volume indicators—everything you need is built in. This advanced tool utilizes lower timeframes or live market data to present the percentage of buying versus selling volume within each candle as an intuitive color-coded bar. Before diving in, ensure you’re familiar with Volume and Volume Delta
Buyers of this product also purchase
New Update of   Smart Trend Trading System MT5 For  2026 Market: If You Buy this Indicator you will Get my Professional Trade Manager + EA  for FREE . First of all Its worth emphasizing here that this Trading System is Non-Repainting   , Non Redrawing and Non Lagging Indicator Which makes it ideal from both manual and robot trading .  [Online course] , [manual] and [download presets] . The Smart Trend Trading System MT5 is a comprehensive trading solution tailored for new and experienced traders
Divergence Bomber
Ihor Otkydach
4.99 (77)
Each buyer of this indicator also receives the following for free: The custom utility "Bomber Utility", which automatically manages every trade, sets Stop Loss and Take Profit levels, and closes trades according to the rules of this strategy Set files for configuring the indicator for various assets Set files for configuring Bomber Utility in the following modes: "Minimum Risk", "Balanced Risk", and "Wait-and-See Strategy" A step-by-step video manual to help you quickly install, configure, and s
Gold Sniper Scalper Pro
Ich Khiem Nguyen
5 (4)
Gold Sniper Scalper Pro - Gold (XAU/USD) Trading System on MetaTrader 5 For the serious trader: Approach Gold trading with a structured, data-driven methodology that combines multiple market analysis factors. This tool is built to support your Gold trading analysis. Limited Price Opportunity This is a chance to own Gold Sniper Scalper Pro before the price increases. The product price will increase by $50 after every 10 subsequent purchases. Final Price: $498 Features That Define Your Analytical
Entry In The Zone and SMC Multi Timeframe is a real-time market analysis tool developed based on Smart Money Concepts (SMC). It is designed to help traders analyze market structure systematically and gain a clearer view of overall market direction. The system analyzes Reversal Points, Key Zones, and Market Structure across multiple timeframes, while displaying Point Of Interest (POI) , No Repaint Signals, and Auto Fibonacci Levels to help detect pullbacks and reversal points with precision. Real
Atomic Analyst MT5
Issam Kassas
4.31 (26)
New Update of   Atomic Analyst MT5 For  2026 Market: If You Buy this Indicator you will Get my Professional   Trade Manager + EA  for   FREE . First of all Its worth emphasizing here that this Trading Indicator is   Non-Repainting   , Non Redrawing and Non Lagging Indicator   Indicator, Which makes it ideal from both manual and robot trading.  User manual: settings, inputs and strategy . The Atomic Analyst  is a PA Price Action Indicator that uses Strength and Momentum of the price to find a bet
Smart Stop Indicator – Intelligent Stop-Loss Precision Directly on Your Chart Overview The Smart Stop Indicator is the tailored solution for traders who want to place their stop loss clearly and methodically instead of guessing or relying on gut feeling. This tool combines classic price-action logic (higher highs, lower lows) with modern breakout recognition to identify where the next logical stop level truly is. Whether in trending markets, ranges, or fast breakout phases, the indicator displ
FX Power MT5 NG
Daniel Stein
5 (28)
FX Power: Analyze Currency Strength for Smarter Trading Decisions Overview FX Power is your go-to tool for understanding the real strength of currencies and Gold in any market condition. By identifying strong currencies to buy and weak ones to sell, FX Power simplifies trading decisions and uncovers high-probability opportunities. Whether you’re looking to follow trends or anticipate reversals using extreme delta values, this tool adapts seamlessly to your trading style. Don’t just trade—trade
Trend Screener Pro MT5
STE S.S.COMPANY
4.84 (99)
Unlock the Power of Trends Trading with the Trend Screener Indicator: Your Ultimate Trend Trading Solution powered by Fuzzy Logic and Multi-Currencies System! Elevate your trading game with the Trend Screener, the revolutionary trend indicator designed to transform your Metatrader into a powerful Trend Analyzer. This comprehensive tool leverages fuzzy logic and integrates over 13 premium features and three trading strategies, offering unmatched precision and versatility. LIMITED TIME OFFER : Tre
Game Changer is a revolutionary trend indicator designed to be used on any financial instrument to transform your metatrader in a powerful trend analyzer.  The indicator does not redraw and does not lag.  It works on any time frame and assists in trend identification, signals potential reversals, serves as a trailing stop mechanism, and provides real-time alerts for prompt market responses.  Whether you’re a seasoned, professional or a beginner seeking an edge, this tool empowers you to trade wi
Quantum TrendPulse
Bogdan Ion Puscasu
5 (19)
Introducing Quantum TrendPulse , the ultimate trading tool that combines the power of SuperTrend , RSI , and Stochastic into one comprehensive indicator to maximize your trading potential. Designed for traders who seek precision and efficiency, this indicator helps you identify market trends, momentum shifts, and optimal entry and exit points with confidence. Key Features: SuperTrend Integration: Easily follow the prevailing market trend and ride the wave of profitability. RSI Precision: Detect
Grabber System MT5
Ihor Otkydach
4.79 (19)
Let me introduce you to an excellent technical indicator – Grabber, which works as a ready-to-use "All-Inclusive" trading strategy. Within a single code, it integrates powerful tools for technical market analysis, trading signals (arrows), alert functions, and push notifications. Every buyer of this indicator also receives the following for free: Grabber Utility for automatic management of open orders Step-by-step video guide: how to install, configure, and trade with the indicator Custom set fi
- Real price is 80$ - 45% Discount (It is 45$ now) Contact me for extra bonus   indicator, instruction or any questions! - Lifetime update free - Non-repaint - Related product: Gann Gold EA - I just sell my products in Elif Kaya Profile, any other websites are stolen old versions, So no any new updates or support. Advantages of  M1 Scalper Pro  Profitability: M1 Scalper Pro is highly profitable with a strict exit strategy. Frequent Opportunities: M1 Scalper Pro  takes advantage of numerous smal
First of all Its worth emphasizing here that this Trading Tool is Non Repainting , Non Redrawing and Non Lagging Indicator , Which makes it ideal for professional trading . Online course, user manual and demo. The Smart Price Action Concepts Indicator is a very powerful tool for both new and experienced traders . It packs more than 20 useful indicators into one , combining advanced trading ideas like Inner Circle Trader Analysis and Smart Money Concepts Trading Strategies . This indicator focus
Top indicator for MT5   providing accurate signals to enter a trade without repainting! It can be applied to any financial assets:   forex, cryptocurrencies, metals, stocks, indices .  Watch  the video  (6:22) with an example of processing only one signal that paid off the indicator! MT4 version is here It will provide pretty accurate trading signals and tell you when it's best to open a trade and close it. Most traders improve their trading results during the first trading week with the help of
SynaptixQuant Dominance Matrix
Devie Arevalo Montemayor
5 (1)
SynaptixQuant Dominance Matrix: Institutional-Grade Market State Extraction Engineered for traders who require a data-driven view of market behaviour beyond surface-level indicators. The Synaptix Quant (SQ) Dominance Matrix is not a conventional currency strength display. Behind its intentionally streamlined interface runs a sophisticated analytical architecture designed to quantify market conditions with precision. Every output is generated through layered signal processing built to identify d
Trend indicator AI mt5
Ramil Minniakhmetov
5 (12)
Trend Ai indicator  mt5 is great tool that will enhance a trader’s market analysis by combining trend identification with actionable entry points and reversal alerts.  This indicator empowers users to navigate the complexities of the forex market with confidence and precision Beyond the primary signals, Trend Ai indicator identifies secondary entry points that arise during pullbacks or retracements, enabling traders to capitalize on price corrections within the established trend. Important Advan
FX Volume MT5
Daniel Stein
4.79 (24)
FX Volume: Experience Genuine Market Sentiment from a Broker’s Perspective Quick Overview Looking to elevate your trading approach? FX Volume provides real-time insights into how retail traders and brokers are positioned—long before delayed reports like the COT. Whether you’re aiming for consistent gains or simply want a deeper edge in the markets, FX Volume helps you spot major imbalances, confirm breakouts, and refine your risk management. Get started now and see how genuine volume data can
TPSproTREND PrO MT5
Roman Podpora
4.72 (18)
Buy TREND PRO now and get another advanced trend indicator for free To receive, write in private messages. ИНСТРУКЦИЯ RUS    -  INSTRUCTIONS  ENG    -  VERSION MT4   Main functions: Accurate entry signals WITHOUT REPAINTING! Once a signal appears, it remains valid! This is a significant distinction from repainting indicators that might provide a signal and then alter it, potentially leading to deposit losses. Now, you can enter the market with higher probability and precision. There's also a f
How many times have you bought a trading indicator with great back-tests, live account performance proof with fantastic numbers and stats all over the place but after using it, you end up blowing your account? You shouldn't trust a signal by itself, you need to know why it appeared in the first place, and that's what RelicusRoad Pro does best! User Manual + Strategies + Training Videos + Private Group with VIP Access + Mobile Version Available A New Way To Look At The Market RelicusRoad is the
Atbot
Zaha Feiz
4.62 (55)
ATy Gold and BTC  Join my MQL5 channel to update the latest news from me.  My community of over 80,000 members on MQL5 ATbot : How It Works and How to Use It How It Works The "AtBot" indicator for the MT5 platform generates buy and sell signals using a combination of technical analysis tools. It integrates Simple Moving Average (SMA), Exponential Moving Average (EMA), and the Average True Range (ATR) index to identify trading opportunities. Additionally, it can utilize Heikin Ashi candles to en
Blahtech Supply Demand MT5
Blahtech Limited
4.54 (13)
Was: $299  Now: $99  Supply Demand uses previous price action to identify potential imbalances between buyers and sellers. The key is to identify the better odds zones, not just the untouched ones. Blahtech Supply Demand indicator delivers functionality previously unavailable on any trading platform. This 4-in-1 indicator not only highlights the higher probability zones using a multi-criteria strength engine, but also combines it with multi-timeframe trend analysis, previously confirmed swings a
FX Levels MT5
Daniel Stein
5 (12)
FX Levels: Exceptionally Accurate Support & Resistance for All Markets Quick Overview Looking for a reliable way to pinpoint support and resistance levels across any market—currencies, indices, stocks, or commodities? FX Levels merges our traditional “Lighthouse” method with a forward-thinking dynamic approach, offering near-universal accuracy. By drawing from real-world broker experience and automated daily plus real-time updates, FX Levels helps you identify reversal points, set profit targe
IX Power MT5
Daniel Stein
4.92 (12)
IX Power: Unlock Market Insights for Indices, Commodities, Cryptos, and Forex Overview IX Power is a versatile tool designed to analyze the strength of indices, commodities, cryptocurrencies, and forex symbols. While FX Power offers the highest precision for forex pairs by leveraging all available currency pair data, IX Power focuses exclusively on the underlying symbol’s market data. This makes IX Power an excellent choice for non-forex markets and a reliable option for forex charts when deta
TrendLine PRO MT5
Evgenii Aksenov
4.67 (33)
The Trend Line PRO indicator is an independent trading strategy. It shows the trend change, the entry point to the transaction, as well as automatically calculates three levels of Take Profit and Stop Loss protection. Trend Line PRO is perfect for all Meta Trader symbols: currencies, metals, cryptocurrencies, stocks and indices. The indicator is used in trading on real accounts, which confirms the reliability of the strategy. Robots using   Trend Line PRO   and real Signals can be found here: 
Support And Resistance Screener Breakthrough unique Solution With All Important levels analyzer and Markets Structures Feature Built Inside One Tool ! Our indicator has been developed by traders for traders and with one Indicator you will find all Imporant market levels with one click. LIMITED TIME OFFER : Support and Resistance Screener Indicator is available for only 50 $ and lifetime. ( Original price 125$ ) (offer extended) The available tools ( Features ) in our Indicator are :  1. HH-LL S
Quantum Trend Sniper
Bogdan Ion Puscasu
4.74 (53)
Introducing   Quantum Trend Sniper Indicator , the groundbreaking MQL5 Indicator that's transforming the way you identify and trade trend reversals! Developed by a team of experienced traders with trading experience of over 13 years,   Quantum Trend Sniper Indicator   is designed to propel your trading journey to new heights with its innovative way of identifying trend reversals with extremely high accuracy. ***Buy Quantum Trend Sniper Indicator and you could get Quantum Breakout Indicator for
I recommend you to read the   product's blog  (manual) from start to end so that   it is clear from the beginning what the indicator offers. The indicator comes with a fully functional Expert Advisor. The indicator identifies when a divergence occurs between price and an oscillator/indicator. It identifies both regular and hidden divergences. It has a RSI, Bollinger Bands and ATR filter options which makes it possible to filter out only the strongest setups. The indicator also offers options to
Trend Forecaster
Alexey Minkov
5 (7)
The Trend Forecaster indicator utilizes a unique proprietary algorithm to determine entry points for a breakout trading strategy. The indicator identifies price clusters, analyzes price movement near levels, and provides a signal when the price breaks through a level. The Trend Forecaster indicator is suitable for all financial assets, including currencies (Forex), metals, stocks, indices, and cryptocurrencies. You can also adjust the indicator to work on any time frames, although it is recommen
Shock Pullback
Suleiman Alhawamdah
5 (1)
Shock Pullback v 3.5 + AI/ML forecasts: - Add Integrated Artificial and deep learning have been integrated within the MQL5 environment. - A qualitative addition for integrated future forecasts using deep learning and artificial intelligence (AI/ML) within MQL5, based on the methodology and operation of the core indicator built on the Shock Pullback and its inherent integrated functions. - Suitable for scalping trading  How to Use the Indicator  Shock Pullback: There are 3 images in the com
Market Structure Patterns
Samuel Manoel De Souza
4.47 (19)
Available for   MT4   and   MT5 . Join the Market Structure Patterns channel to download materials available for study and/or additional informations. Related posts: Market Structure Patterns - Introdução Market Structure Patterns   is an indicator based on   smart money concepts   that displays   SMC/ICT   elements that can take your trading decisions to the next level. Take advantage of the   alerts ,   push notifications   and   email messages   to keep informed from when an element is form
More from author
Description   : The "Market Structure HH HL LH LL" indicator is a powerful and at the same time simple tool for analyzing price dynamics in financial markets. This indicator helps traders and investors identify changes in trends and identify important points in price time series. Displays "BOS" and "CHoCH" lines. Key components of the indicator: HH (Higher High): The top at which the price closes above the previous high top. HH indicates a strengthening uptrend. HL (Higher Low): The minimum
Indicator       shows "Support" and "Resistance" lines (these lines are drawn using the DRAW_LINE drawing style - that is, they are not graphic objects). A search for new minimums and maximums is performed to the left and right of the "signal bar" - the "signal bar" is the conventional middle of each new construction. Why is the word Flexible in the name of the indicator? Because we have the possibility to specify different number of bars to the left ('Left Bars') and to the right ('Right Bars'
The trend indicator "   Super Trend Flexible Alert   " has a minimum of settings. This indicator is designed to be as easy to use as possible. The indicator shows the trend with a main colored line ("SuperTrend" line, which you can see in the "Data Windows" window). Also, in places where the trend changes, the indicator shows colored arrows (   "STBuy" and "   STSell" icons, which you can see in the "Data Windows" window       ). In places where the trend changes, the indicator doesn't give a s
The Candle Length Indicator Alarm generates a sound alert, sends a push notification and an email when the size of the current candlestick changes. The size of the current candlestick can be measured in two ways: The first method: the size of the candlestick is measured from the beginning of the candlestick (from the OPEN price). The second method: the size of the candlestick is measured from current price. The indicator has the following settings: sound — a sound file from the folder: "...\Meta
The Buy Sell Color Background indicator changes the background color depending on position direction. It has three settings: Background color for BUY - background color for a Buy position Background color for SELL - background color for a Sell position Default background color - background color with no open position After you detach the indicator from a chart, its background color changes to Default background color .
The calculator of signals operates directly from the MetaTrader 5 terminal, which is a serious advantage, since the terminal provides a preliminary selection and sorts out signals. This way, users can see in the terminal only the signals that ensure a maximum compatibility with their trading accounts. The calculator of signals gives the answer to the one of the questions most frequently asked by users of the Signals service: "Will I be able to subscribe to the signal NNN, and what volume of the
Arrow Signal
Vladimir Karputov
This indicator belongs to the "Stochastic" category. I tried to simplify the control of the indicator as much as possible, so the minimum settings are shown in the input parameters: this is the choice of an icon for the signal arrows. The "Buy" signal is encoded with the ' Buy Arrow code ' parameter, and the "Sell" signal is encoded with the ' Sell Arrow code ' parameter. Signal arrow codes for signals (please use values ​​from 32 to 255) are taken from the Wingdings font. The indicator works on
Arrow Signal EA
Vladimir Karputov
An Expert Advisor based on the custom indicator. Search for a signal at every tick. Positions are closed by an opposite signal. No trailing. There is no stop loss. There is no take profit. Has a minimum of settings Money management: Lot OR Risk   - type Money management The value for "Money management"   - Money management value Deviation   - admissible slippage Buy Arrow code   (font Wingdings) - character code from 'Wingdings' font for BUY signals Sell Arrow code   (font Wingdings) - characte
Ma Dema Alert
Vladimir Karputov
The indicator displays three lines and monitors two types of intersections. Three lines of the indicator: "   MA   " - slow indicator "Moving Average", "   DEMA Slow   " - slow indicator "   Double Exponential Moving Average" and "   DEMA Fast   " - fast indicator "Double Exponential Moving Average". Two types of intersections       : "   Alert Price MA   " - the price crosses the   "MA" line and   "   Alert DEMA DEMA   " - the lines cross       "DEMA Slow" and   "DEMA Fast   ". When crossing,
This Expert Advisor belongs to the class of utilities for manual and semi-automatic trading. The "   Pending order at the extremums of the day   " EA places two pending orders at the extremums of the previous day. Parameter "   Pending Orders: ...       " allows you to select the type of pending orders: "   Buy Stop and Sell Stop   " or "   Buy Limit and Sell Limit   "   .       extremum       'Low' offset is made downwards). "   New pending -> delete previous ones   " set to "   true   " will f
The "Panel Partial Closure" utility-panel is intended for quick partial closing of a position that has a profit. It has only two parameters: "   Partial closure #1   " and "   Partial closure #2   ". Works for any symbol and for any 'Magic number' - that is, the utility is primarily intended for manual trading. How it works: For example, you have several positions on "EURUSD", "Jump 100 Index" and "XAUUSD" (gold). The utility finds the position with the largest profit - in the screenshot, this
The 'Supertrend MetaTrader 5' indicator is the basis of the simplest trend trading system. And yet it remains very effective. The indicator works on any timeframe (on the timeframe of the current chart). From the name you can see that this indicator follows the trend, and when the trend changes, the indicator accurately shows the point of the trend change. The basis of 'Supertrend MetaTrader 5' is comparing price and 'Average True Range indicator' values multiplied by a multiplier (there is als
MQL5 "Daily resistance and support" indicator - draws daily support and resistance lines. Drawing is carried out only with the help of graphical objects (trend lines) - indicator buffers are not used in this indicator. The indicator has no settings - the search for levels is carried out on the last 500 bars from the "D1" timeframe and this parameter is hardwired inside the code. Manual trading: When trading manually, this indicator is recommended to be used on timeframes from "M10" to "H1". It
Multi Symbol Trailing
Vladimir Karputov
5 (1)
The "   Multi Symbol Trailing   " utility moves Stop Loss for all positions that are currently open (multi-symbol trailing). It is intended primarily to assist in manual trading. There are no restrictions for the utility either by the name of the currency pair or by the individual identifier (Magic number) - the utility processes absolutely all positions that are currently open. The unit of measurement for the "   Trailing Stop   " and "   Trailing Step   " parameters is points (the difference
The trend indicator "Trend Two Moving Average" uses two types of Arrow to display calculation results - these are "Trend UP" and "Trend DN".       Arrows "Trend Up"       are drawn       By       price       'Low'       bar   ,       A       Arrows "Trend DN" -       By       price       'high'. The trend search algorithm is based on the analysis of the price of a bar and the values of two 'Moving Average' indicators. The trend direction is calculated on the current (zero) bar. Therefore, it is
Three TimeFrames
Vladimir Karputov
Three TimeFrames indicator-panel. The indicator is made in the form of a panel based on the CAppDialog class. The panel can be minimized or moved around the current chart using the mouse. The indicator shows three timeframes of the current symbol in the panel. In the current version, the indicator has a minimum number of settings - these are the parameters of three timeframes: "Younger timeframe", "   Middle   timeframe   " and "   Older   timeframe   ". When launched, the indicator-panel autom
The "   Market Session Times   " indicator shows the time of four trading sessions: Asia, Europe, America and Pacific. The time of trading sessions is set   in the format       GMT and thus does not depend on the trading server at all. The following data is used: Trading Session City GMT Asia Tokyo Singapore Shanghai 00:00−06:00 01:00−09:00 01:30−07:00 Europe London Frankfurt 07:00−15:30 07:00−15:30 America New York Chicago 13:30−20:00 13:30−20:00 Pacific Wellington Sydney 20:00−02:45 22:00−0
Constant stream
Vladimir Karputov
Trading system for a variety of trading transactions. Allows you to set the balance to wander around zero - used for specific rebate tasks or similar. Configured to work with hedging   accounts.   There cannot be more than one position in the market   . One general setting, the "   Step, Stop Loss, Take Profit   " parameter is measured in points (example for EURUSD: 1.00055-1.00045 = 10 points). The advisor stops trading (while remaining on the chart) if, when   placing a position, it encounters
The indicator shows Fractals from the higher timeframe. It is possible to display two types of Fractals: 'Regular Fractal' and 'BW Fractal'. Consider the formation of the Fractal 'UP'. 'Regular Fractal' is a very strict Fractal in which each subsequent 'high' price (to the left and right of the central bar) is smaller. Whereas in 'BW Fractal' there is only one condition: the central bar (its price 'high') must be the highest. Visually, the difference between these two modes can be seen in diagr
AI Support Resistance This is an indicator that searches for the “Support” and “Resistance” lines. The search is carried out using an algorithm for numerical analysis and data processing. There are three search options available (“mode #1”, “mode #2” and “mode #3”). Each of these options differs in its internal algorithm (at the moment these are completely internal settings, they are not available to the user). We can say that these options differ in the severity of the search. Limitation: At t
Open Time Manager
Vladimir Karputov
The " Open Time Manager " utility opens a position at a specified time and then turns on classic trailing. Time (' Hour ':' Minute ') is always set in the GMT time zone with a GMT Ofset offset. It is possible to select three options for opening a position using the ' Trade mode ' parameter: ' BUY ' ' SELL ' ‘ BUY and SELL (simultaneously) ’ ‘ OFF (no trade, only trailing works) ’ The fourth parameter is used when you only need to enable trailing for your positions and not open new positions. St
The trend trading strategy "Super Trend Flexible Alert EA" is built on the indicator of the same name "Super Trend Flexible Alert". The advisor uses all the information from the indicator, so the advisor has only three parameters, these are: “Working timeframe” – specifies the working timeframe, the timeframe on which the indicator is created, and also from which the “OHLC” data is taken. "Stop Loss" is the constant size of the stop loss, measured in "points" (you can see an example of what "po
The dashboard scans the readings of two indicators: 'MACD' and 'Stochastic'. Displays signals in three columns: for MACD, for Stochastic, and the resulting column (if the signal is the same for both indicators).  Scanning can be selected on one or more timeframes. If you disable all timeframes, the dashboard will still load, but with settings specifically for such cases. Signals are always checked for the zero bar (zero bar is the rightmost bar on the chart) of the indicator. Description of para
ATR Bands Alert
Vladimir Karputov
ATR Bands Alert is a channel indicator where the channel width is calculated as a constant multiplier ("Multiplier") and the value of the "Average True Range" indicator. Unlike Bollinger Bands, the bandwidth is not changed so often – in the ATR Bands Alert indicator, the bands often have long straight lines. The interpretation of the ATR Bands Alert is based on the fact that the price is inside the bands for most of the time, and if the price reaches one of the boundaries, it may indicate a tr
The Bollinger Bands Dashboard indicator offers a convenient and informative way to track Bollinger Bands indicator signals on different timeframes using one panel (Dashboard). This tool allows traders to quickly and easily obtain the information they need, enabling efficient decision-making in the market. Main characteristics: 1. **Signals Panel**: The Dashboard displays Bollinger Bands signals for selected timeframes, providing users with clear and structured information. 2. **Flexibility in
Virtual Breakeven
Vladimir Karputov
Introducing the utility "   VIRTUAL BREAKEVEN   !" "Current symbol" is the symbol of the chart on which the utility works. The utility keeps a count of all positions on the current symbol and ignores the "Magic number" of these positions. The utility works on the current symbol and tracks the Breakeven level in the deposit money. When the profit of all positions on the current symbol becomes >= «Trigger» the utility will start tracking « Breakeven ". A common example: manual trading, constantly
Tensline
Vladimir Karputov
Simple, Efficient, Profitable — an Expert Advisor that works for you This EA is designed for traders who value simplicity and control . With minimal settings, it’s incredibly easy to configure and launch — no complex optimization required. Holds only one market position at a time — no clutter, no overlap. Flexible strategy selection — choose the one that best fits your trading style. Backtesting results reveal : Certain currency pairs perform exceptionally well on rebate services , g
Filter:
Kaziel
190
Kaziel 2024.03.07 18:35 
 

Simple and accurate - very good support from a knowledgeable developer.

Reply to review