AIS Probable High Low MT5
- Indicators
- Version: 2.0
- Updated: 22 September 2019
- Activations: 5

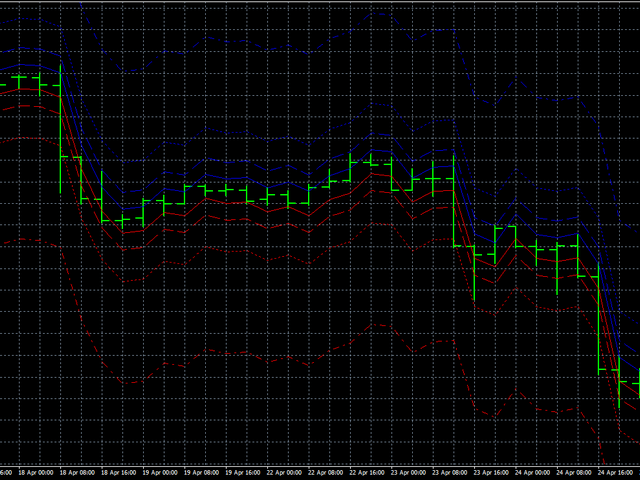
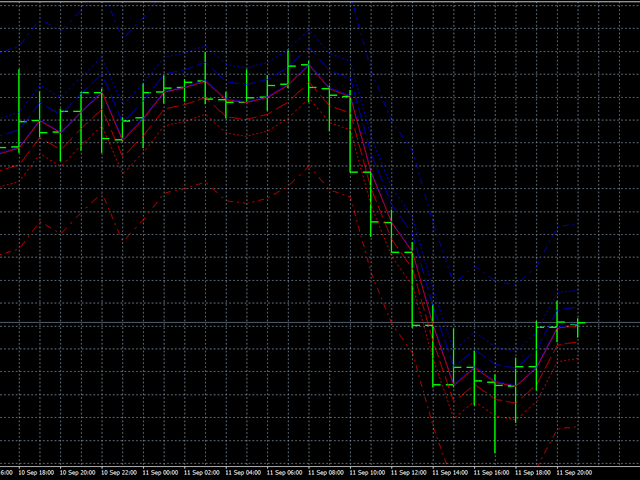
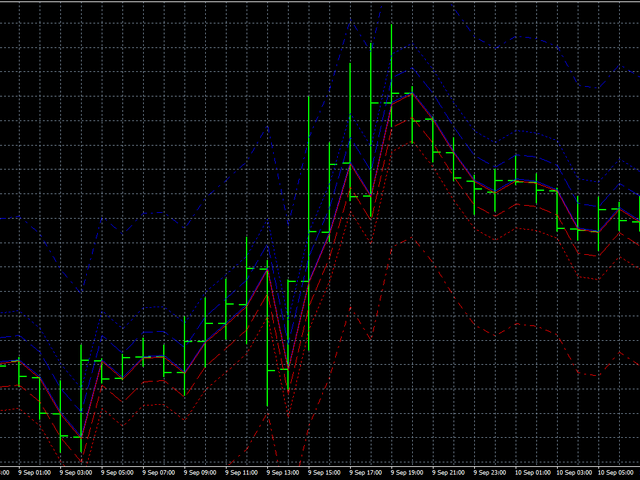
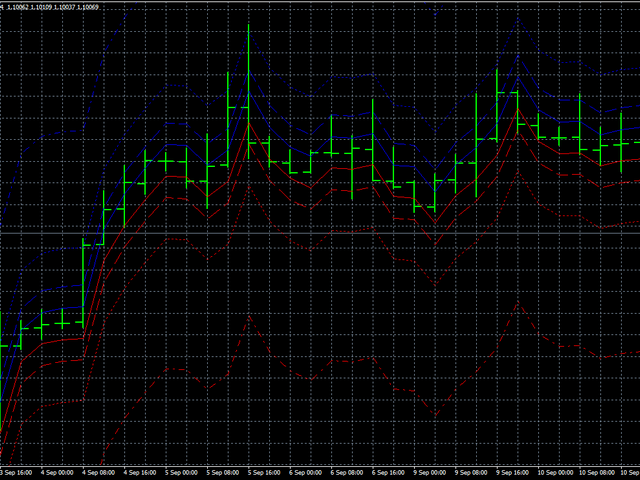
This indicator allows you to determine the likelihood that the price will reach one or another level. Its algorithm is quite simple and is
based on the use of statistical data on the price levels of a particular currency pair. Thanks to the collected historical data, it is
possible to determine the extent to which the price will change during the current bar.
Despite its simplicity, this indicator can provide invaluable assistance in trading. So, with its help it is possible to determine TakeProfit
and StopLoss levels for trading positions. It can help both in determining prices for pending orders and in determining price levels
for TrailingStop.
In addition, this indicator can be integrated into existing strategies. For example, you use some kind of intraday strategy. Then, by
setting this indicator on the D1 time frame, you can get levels, after overcoming which it is already undesirable to open new trading
positions.
The main drawback of this indicator is that it relies purely on historical data and does not react in any way to certain current market
changes.
The setting of this indicator is carried out by selecting the input parameters - L1 ... L4 - each of which determines the probability of
reaching a price price from the opening price of each bar. The value of each parameter must lie within 99 ... 0, and each of the following
parameters must be strictly less than the previous one.
Nikolai Nikolaevich is the ideological inspiration for the creation of this indicator, if you liked the indicator, then write a few kind words,
and I will tell him.
User didn't leave any comment to the rating