Stochastics Multi not delayed Step Stoch

4

!!! In [CodeBase] I published Mql4 indicator code. Download the code for free!!! (You have to adapt the code when you update the terminal).

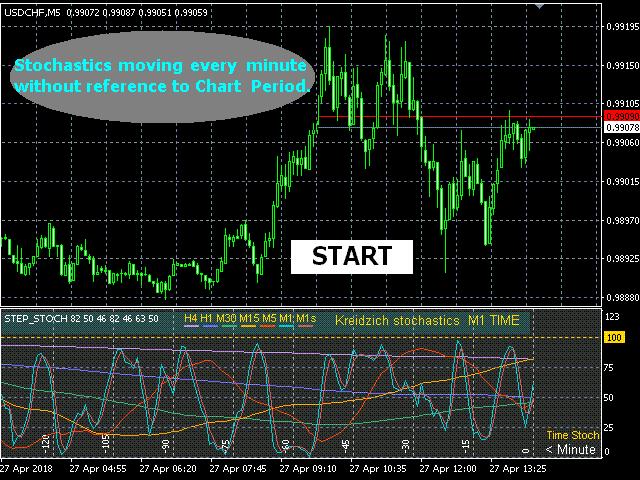
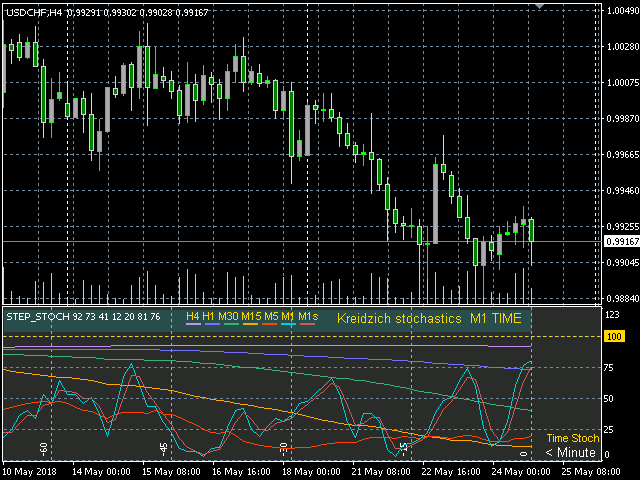
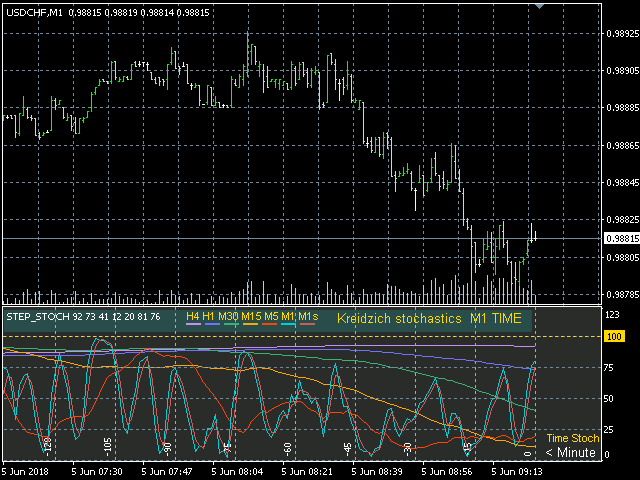
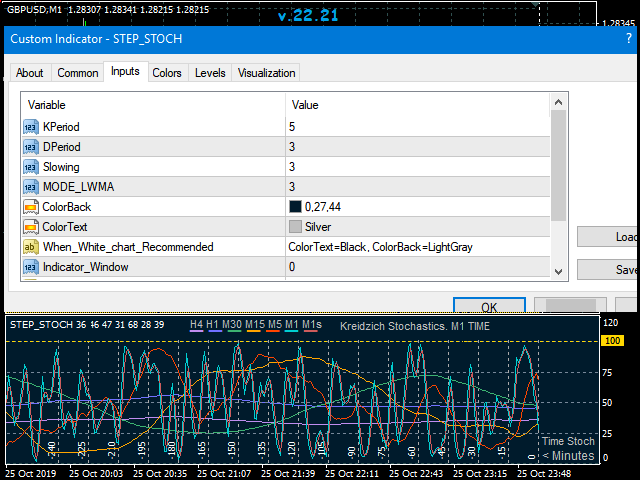
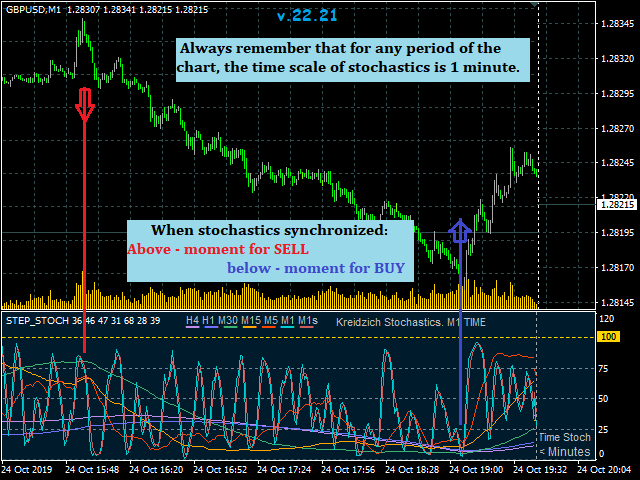
This indicator is a trader's tool. It shows the movement of stochastics on all periods and symbols: М1, М5, М15, М30, Н1, Н4 every minute (the time scale from the current to -240 minutes, i.e. tha last 4 hours).

Step_Stoch overcomes the disadvantage of stochastic indicators - lagging. For example, a rise after a fall on H1 (or M30) after can be seen on a usual stochastic after 60 minutes for H1 or after 30 minutes on M30. This indicator displays this information in a minute, allowing you to obtain a better result.

You can see all stochastics combined together and analyze their movement to make optimal trading decisions without delays, which earlier could lead to loss of profit when closing deals or to a late opening, when the possibility of profit (large part of it) is already lost. Step_Stoch lines help you see the beginning of the trend reversal process faster.

The indicator automatically adjusts to 4 and 5-digit quotes, Screen DPI, the time scale of the chart.
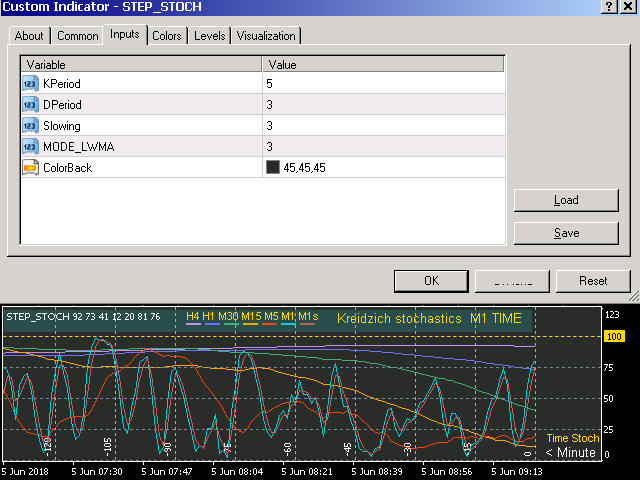
Input Values

  • KPeriod, DPeriod, Slowing, Mode_, - standard Stochastic parameters.
  • ColorBack - background color. The colors of the stochastic lines can be changed on the tab.

The indicator author is a programmer with 33 years of programming experience, as well as forex trading experience since 2011.

About the author read [ Profile ]. 

From Metatrader-Market click [View on site] - all reviews and comments.


Reviews 2
Enrique Enguix
120889
Enrique Enguix 2022.04.28 08:49 
 

It is an indicator at least "curious". I am still investigating how to take advantage of this information for my business. The approach that the developer has given to it is interesting. Congratulations. I will update to 5 stars when I know more about the indicator. Thank you.

EDIT- Quick change in my rating, 5 stars, it's a great indicator

Recommended products
SRP (Strong Retracement/Reversal Points) is a powerful and unique support and resistance indicator. It displays the closest important levels which we expect the price retracement/reversal! If all level are broken from one side, it recalculates and draws new support and resistance levels, so the levels might be valid for several days depending on the market! Key Features You can use it in all time-frames smaller than daily! Displays closest significant support and resistance levels Update the le
FREE
Custom Candle
Robby Suhendrawan
Custom Candle – Multi-Timeframe Visualization Analyzing multiple timeframes is essential for accurate trading decisions, but switching between charts can be inconvenient and inefficient. The Custom Candle indicator solves this problem by overlaying higher-timeframe (HTF) candles directly onto your lower-timeframe (LTF) chart. This allows you to see the bigger picture at a glance, align with the higher trend, and improve trade accuracy—without leaving your current chart. Key Features Multi-Timefr
FREE
It is FREE on EURUSD chart. All Symbols version! Contact me for any questions Introduction The breakout and retest strategy is traded support and resistance levels. it involves price breaking through a previous level.  The   break and retest   strategy is designed to help traders do two main things, the first is to avoid false breakouts. Many false breakouts start with a candlestick that breaks out of a level but ends with an immediate candlestick that brings the price back into the level. The
FREE
KFX Symbol Changer
Peter Kariuki Thande
4 (1)
KFX SMA: Symbol Changer + Moving Average (3x) + ATR + RSI + Candle Timer. This indicator allows you to create a Symbol list and change between symbols of the current chart or Timeframe by selecting the appropriate button. On Chart there are three(3) multi timeframe Moving Averages shown (selected by you), ATR Value MTF ( selected by you -  helps with setting SL and TP), RSI Value MTF (selected by you) and a Candle Timer.   Features: - Symbol Changer : Change Symbol and Timeframe of Chart.   (s
FREE
"GoldMinerRobot SI 2" is an indicator that is not displayed, but is one of the most important analytical arms of "GoldMinerRobot".  This indicator is free. You can find more information about how this indicator works in the section "MQL5 Market" and section "Experts" and "GoldMinerRobot". "Gold Miner Robot" is specially designed and built for trading on gold (XAUUSD) in MetaTrader 4.
FREE
RedeeCash AROON
Patrick Odonnell Ingle
Version History Date Version Changes 07/08/2022 1.00 Initial Release Description The Aroon indicator is a technical indicator   that is used to identify trend changes in the price of an asset, as well as the strength of that trend. In essence, the indicator measures the time between highs and the time between lows over a time period. The idea is that strong uptrends will regularly see new highs, and strong downtrends will regularly see new lows. The indicator signals when this is happening, and
FREE
Max Ribbon
Stefano Frisetti
WARNING: This indicator is distributed EXCLUSIVELY on MQL5.com MT4 version:   https://www.mql5.com/it/market/product/160363 MT5 version:   https://www.mql5.com/it/market/product/160410 MAX RIBBON ver 1.00 The indicator that shows you the TREND clearly and unambiguously! DESCRIPTION MAX RIBBON is an advanced trend indicator that combines two ribbon systems to accurately identify market direction: • MaxRib2 (Fast Ribbon): Responsive to short-term movements, ideal for capturing rapid reversals an
Investment Castle Trend Lines MT4
Ahmed Alaaeldin Abdulrahman Ahmed Elherzawi
5 (3)
All traders should know the trend before making their decision when placing the buy or sell orders. The first step always starts with  supply and demand , rising and falling channels , trend lines, engulfing candles etc. All the above contribute to what is called “Price Action” and that is the best and most reliable way in trading and catching the trend and making profits, without stress. The  Investment Castle Trend Line Indicator  will automatically draw the trend lines on the MT4 for you. An
FREE
The Multi Time Frame EMA indicator is of great help in determining trend direction. It can be an excellent addition to your existing strategy or a new foundation. We humans can make better decisions when we see better visually. So we designed it to show different colors for uptrends and downtrends. Anyone can customize this in the way that works best for them. We can set the Ema indicator for all timeframes on a chart.
FREE
.....................................hi....................... ................for showing high s and low s and support and resistanses .....................we have a lot of ways............................... it can be helpful for finding trends , higher highs , higher lows , lower highs , lower lows .......................today i write on of thems.......................... ........................you can enter the number of last support and resistanses .........................and it will dra
FREE
MQLTA Supertrend Multi Timeframe
MQL4 Trading Automation
4.85 (13)
Индикатор MQLTA Supertrend Multi Timeframe сочетает в себе значения Supertrend, найденные на нескольких таймфреймах, чтобы подтвердить тренд пары. Для работы утилиты необходим бесплатный индикатор MQLTA Supertrend Line - https://www.mql5.com/en/market/product/25951. Как он работает? Индикатор проверяет состояние Supertrend на всех выбранных таймфреймах и отображает результат в виде легко читаемой таблицы. Как торговать с помощью индикатора Supertrend Multi Timeframe Покупку следует совершать,
FREE
PZ The Zone
PZ TRADING SLU
4.33 (3)
This indicator displays buy or sell signals according to Bill Williams' definition of the Trading Zone. [ Installation Guide | Update Guide | Troubleshooting | FAQ | All Products   |  Get Help ] Easy to use and understand Avoid trading flat markets Deterministic indicator with clear rules The indicator is non-repainting It implements alerts of all kinds It has straightforward trading implications. A blue arrow is a buy signal A red arrow is a sell signal According to Bill Williams trading in t
FREE
This indicator filters the Zigzag indicator to calculate the main support and resistance levels. Variables minimum gap between peaks : is the distance (GAP) between the peaks of the Zigzag peaks sensitivity : Minimum number of nearby peaks look back: it means that it has to test the last 50 peaks in the Zigzag object name perfix: a prefix for level’s line name on chart
FREE
Wise Men Indicator demo
Bohdan Kasyanenko
3 (2)
The indicator displays signals according to the strategy of Bill Williams on the chart. Demo version of the indicator has the same features as the paid, except that it can work only on a demo account . Signal "First Wise Man" is formed when there is a divergent bar with angulation.  Bullish divergent bar - with lower minimum and closing price in the upper half. Bearish divergent bar - higher maximum and the closing price at the bottom half. Angulation is formed when all three lines of Alligator
FREE
pivot points using by many traders and pivot levels most of the times are very helpfull . this indicator is a custom with internal parameters. it can show two times pivot (weekly and daily). you can choose periods total for each time showing pivots.( 1 week , 2 week ,...1day , 2day ,...) when use weekly and daily pivots , it can show you many support and resistance zones. if have proposal comment too me for upgrading indicator.
FREE
This indicator is the undisputed leader among the indicators. And for this statement there is a good reason. The indicator builds a very high quality channel in which it generates signals to enter! What is the ideal strategy for the trader, since the trader always hesitates when choosing a strategy for the job. That is, this indicator will allow you to solve the dilemma of choosing a job by trend or to the channel, since it combines these two basic concepts. Working with the indicator is very
Speed resistance lines are a powerful tool for determining trend and resistance lines. The indicator builds lines using chart extremes and special mathematical formulas. The indicator can be used to determine the trend direction and pivot points. <----------------------------> Indicator Parameters: "Depth of search" - depth (in bars) of the search for chart extremes "Back step of search" - minimum distance (in bars) between extremes "Deviation of price" - permissible price difference between
FREE
Raymond Cloudy Day Indicator for MT4 – Pivot-Based Reversal and Trend Levels Raymond Cloudy Day Indicator is a pivot-based level indicator for MetaTrader 4 (MT4). It was developed by Ngo The Hung based on Raymond’s original idea and is designed to give a structured view of potential reversal zones, trend extensions and support/resistance levels directly on the chart. The default settings are optimised for XAUUSD on the H1 timeframe, but the indicator can be tested and adjusted for other symbols
Angle Dashboard
Taras Slobodyanik
5 (1)
This is a multicurrency and multitimeframe indicator that calculates the angle between two points. Points for measuring the angle can be taken from the ZigZag (the last two points), or from the Moving Average (between two given bars), or it can be the closing prices of bars. Angle measurement is possible in degrees or in radians. You can select the scale for the calculation. For a better understanding of the indicator, you can study the free Angle High Low indicator. In the parameters you can
The ZigZag Repaint Tracker indicator is a powerful tool for traders and analysts, which not only constructs the classic ZigZag but also carefully tracks all instances of its repainting across the entire historical dataset. Main features and advantages: Full history analysis: The indicator analyzes the entire available chart history, identifying moments when ZigZag changed its extremes, which allows understanding the dynamics and reliability of the constructions. Tracking repainting: Unlike stand
FREE
Custom Pattern Detector Indicator This indicator lets you define your own custom pattern instead of the typical candlestick patterns. Everybody already knows about common candlestick patterns like the Doji pattern. This indicator is different though. The pattern you will define is a custom pattern based on CANDLE FORMATIONS . Once the indicator knows the pattern you want it to look for, then it will go through history on the chart and find matching patterns, make them visible to you, and calcula
FREE
This is a Multi-Time-Frame Zigzag indicator You can change parameters of Zigzag, include Zigzag Depth, Zigzag Deviation, Zigzag Backstep. You can choose which Time Frame to display Zigzag by turn ShowXXX to true or false (ShowXXX = ShowM1, ShowM5, ShowM15...). Noted: Lower Time Frame Zigzag will not display on Higher Time Frame. Example: Your current Time Frame is H1, you can not see Zigzag of M1 to M30 even you turn them on.
Engulfing Pattern Pro version
Alexander Chertnik
4.33 (3)
Designed especially for GBPUSD 30m market. Minimum trading account 1000 $.  The EA trading engulfing candle formations combined with adx indicator. There are 3 main methods of orders placement and management, all three methods are profitable with different results for user to chose. tested on a specific market and timeframe  but can operate on other markets ass well. developed, tested and optimized   on "   VantageMarkets   " platform.
FREE
Auto Fibo Pro m
DMITRII GRIDASOV
"Auto FIBO Pro"   Crypto_Forex  indicator  - is great auxiliary tool in trading! Indicator automatically calculate and place on chart Fibo levels and local trend lines (red color). Fibonacci levels indicate key areas where price can reverse. Most important levels are 23.6%, 38.2%, 50% and 61.8%. You can use it   for reversal scalping  or for zone grid trading. There are plenty of opportunities to  improve your current system using Auto FIBO Pro indicator as well. It has Info Spread Swap Displa
CCI Breakout SW
Mohamed Hassan Mohamed Hassan Alsherbiny
Probability emerges to record higher prices when Commodity Channel Index breaks out oscillator historical resistance level when exhibit overbought values. Since, oscillator breakout of support and resistance have similar effect as price breaks support and resistance levels, therefore, its highly advised to confirm price breakout with oscillator breakout; certainly, will have the same output in short trades. Concept is based on find swing levels which based on number of bars by each side of peak
FREE
Pivot Points are a classic technical analysis indicator that calculates the central pivot point (PP) as well as support (S1–S3) and resistance (R1–R3) levels based on the previous day’s High, Low, and Close. The indicator allows you to: • identify key zones where the price may bounce or break through • determine the direction of the trend • find good entry points, as well as set stop loss and take profit levels Indicator settings: • enable/disable PP, R1/S1, R2/S2, R3/S3 • enable/disable price l
FREE
Koala Supply Demand
Ashkan Hazegh Nikrou
5 (3)
Introducing Koala Supply Demand Indicator for MetaTrader 4 ( We encourage you to share your review or feedback—whether positive or negative—so other traders can benefit from your experience.) : Welcome to  Koala Supply Demand Indicator. This indicators designed to identify unbroken supply and demand zones in different time frames, this indicator can help trader to view market as zone areas, you can see how price respect some power full zones, this indicator also can show you price action signal
FREE
The   OHLC indicator   shows the current and historical values of High, Low, Open, Close and Mid for a specific time period. It can plot the current values or the values from the previous session. The indicator's range can be calculated from a daily, weekly, monthly, or user-specified session. Levels High  of the current or previous session. Low  of the current or previous session. Open  of current or previous session. Close  of the current or previous session. Midpoint  of the current or prev
FREE
Are you ready to become the Sherlock Holmes of forex trading? ️‍️ Introducing the ultimate trading toolkit:   Lisek Levels and Channels   Indicator !!! Forget juggling multiple indicators like a circus act. We've packed everything you need into one spectacular show: Price Levels? Check! Price Channels? You bet! Price VWAP? Oh yeah! Volume On Balance? It's all there! And the cherry on top? Alarms and Push Notifications that'll wake you up faster than a double espresso! ️ Your cha
FREE
Shows Kaufman Efficiency Ratio value and smoothed by MA. Calculation is based on movement divided by volatility on a specified period. Levels are adjustable as well as visualization. Parameters: KERPeriod - period for ratio calculation. EMAPeriod - period for moving average. Shift - indicator shift. HigherLevel - low value of the higher zone. LowerLevel - high value of the lower zone. ShowHigherZone - allow higher zone drawing. HigherZoneColor - higher zone color. ShowLowerZone - allow lower zon
FREE
Buyers of this product also purchase
Gann Made Easy
Oleg Rodin
4.83 (160)
Gann Made Easy is a professional and easy to use Forex trading system which is based on the best principles of trading using the theory of W.D. Gann. The indicator provides accurate BUY and SELL signals including Stop Loss and Take Profit levels. You can trade even on the go using PUSH notifications. PLEASE CONTACT ME AFTER PURCHASE TO GET TRADING  INSTRUCTIONS AND GREAT EXTRA INDICATORS   FOR FREE! Probably you already heard about the Gann trading methods before. Usually the Gann theory is a ve
M1 Sniper
Oleg Rodin
5 (21)
M1 SNIPER is an easy to use trading indicator system. It is an arrow indicator which is designed for M1 time frame. The indicator can be used as a standalone system for scalping on M1 time frame and it can be used as a part of your existing trading system. Though this trading system was designed specifically for trading on M1, it still can be used with other time frames too. Originally I designed this method for trading XAUUSD and BTCUSD. But I find this method helpful in trading other markets a
Scalper Inside PRO
Alexey Minkov
4.74 (69)
12% OFF EASTER SALE An exclusive indicator that utilizes an innovative algorithm to swiftly and accurately determine the market trend. The indicator automatically calculates opening, closing, and profit levels, providing detailed trading statistics. With these features, you can choose the most appropriate trading instrument for the current market conditions. Additionally, you can easily integrate your own arrow indicators into Scalper Inside Pro to quickly evaluate their statistics and profitabi
Ultimate Sniper Dashboard
Hispraise Chinedum Abraham
4.82 (22)
Currently on massive July Discount! Prices will increase in the future! Read description below! Once you purchase, send a message to my inbox for manual and starter kit. Best Entry System for Ultimate Sniper Dashboard: ULTIMATE DYNAMIC LEVELS. (Please Check my products) The Ultimate Sniper Dashboard ONLY works on live markets due to MT4 multicurrency testing limits. Introducing the Ultimate-Sniper Dashboard! Our very best which contains both HA-Sniper, MA-Sniper. and many special modes. The Ul
Market Makers
Mohamed Hassan
5 (3)
After purchase, contact me privately to receive 1 month of free testing with EA Forex Proton! This advanced MT4 trading robot automatically executes signals from any MT4 indicator, including Market Makers. The latest version also includes AI integration, allowing each trade signal to be analyzed using Artificial Intelligence. Live Signal with EA Forex Proton: Click here Market Makers is a powerful price action trading system designed to identify high-probability Buy and Sell opportunities based
Trend Screener
STE S.S.COMPANY
4.79 (95)
Trend Screener Indicator --Professional Trend Trading & Market Scanning System for MetaTrader Unlock the true power of trend trading with Trend Screener Indicator — a complete multi-currency, multi-timeframe trend analysis solution   powered by Fuzzy Logic,Trend Pulse Technology  and advanced market structure algorithms.   Trend Screener transforms your MetaTrader platform into a professional-grade Trend Analyzer and Market Scanner, helping you identify high-probability trend opportunities, ear
Atomic Analyst
Issam Kassas
5 (5)
First of all Its worth emphasizing here that this Trading Indicator is   Non-Repainting , Non Redrawing and Non Lagging Indicator   Indicator, Which makes it ideal from both manual and robot trading.  User manual: settings, inputs and strategy . The Atomic Analyst  is a PA Price Action Indicator that uses Strength and Momentum of the price to find a better edge in the market. Equipped with Advanced filters which help remove noises and false signals, and Increase Trading Potential. Using Multiple
Super Signal – Skyblade Edition Professional No-Repaint / No-Lag Trend Signal System with Exceptional Win Rate | For MT4 / MT5 It works best on lower timeframes, such as 1-minute, 5-minute, and 15-minute charts. Core Features: Super Signal – Skyblade Edition is a smart signal system designed specifically for trend trading. It applies a multi-layered confirmation mechanism to detect only strong, directional moves supported by real momentum. This system does not attempt to predict tops or bottoms
Trend indicator AI
Ramil Minniakhmetov
4.53 (83)
Trend Ai indicator is great tool that will enhance a trader’s market analysis by combining trend identification with actionable entry points and reversal alerts.  This indicator empowers users to navigate the complexities of the forex market with confidence and precision Beyond the primary signals, Trend Ai indicator identifies secondary entry points that arise during pullbacks or retracements, enabling traders to capitalize on price corrections within the established trend. Important Advantage
Introducing ON Trade Waves Patterns Harmonic Elliot Wolfe, an advanced indicator designed to detect various market patterns using both manual and automated methods. Here's how it works: Harmonic Patterns: This indicator can identify harmonic patterns that appear on your chart. These patterns are essential for traders practicing harmonic trading theory, as popularized by Scott Carney's book "Harmonic Trading vol 1&2." Whether you draw them manually or rely on automated detection, ON Trade Waves
The " Dynamic Scalper System " indicator is designed for the scalping method of trading within trend waves. Tested on major currency pairs and gold, compatibility with other trading instruments is possible. Provides signals for short-term opening of positions along the trend with additional price movement support. The principle of the indicator. Large arrows determine the trend direction. An algorithm for generating signals for scalping in the form of small arrows operates within trend waves.
PRO Renko System
Oleg Rodin
5 (30)
PRO Renko System is a highly accurate trading system specially designed for trading RENKO charts. The ARROWS and Trend Indicators DO NOT REPAINT! The system effectively neutralizes so called market noise giving you access to accurate reversal signals. The indicator is very easy to use and has only one parameter responsible for signal generation. You can easily adapt the tool to any trading instrument of your choice and the size of the renko bar. I am always ready to provide extra support to help
TPSpro RFI Levels
Roman Podpora
4.86 (28)
INSTRUCTIONS RUS   /   INSTRUCTIONS   ENG   -   VERSION  MT5 Main functions: Displays active zones of sellers and buyers! The indicator displays all the correct first impulse levels/zones for purchases and sales. When these levels/zones are activated, where the search for entry points begins, the levels change color and are filled with certain colors. Arrows also appear for a more intuitive perception of the situation. LOGIC AI - Display of zones (circles) for searching entry points when activa
BTMM State Engine Pro is a MetaTrader 4 indicator for traders who use the Beat The Market Maker approach: Asian session context, kill zone timing, level progression, peak formation detection, and a multi-pair scanner from a single chart. It combines cycle state logic with a built-in scanner dashboard so you do not need the same tool on many charts at once. What it does Draws the Asian session range; session times can follow broker server offset or be set in inputs. Tracks level progression (L
Linear Trend Predictor - A trend indicator that combines entry points and direction support lines. It works on the principle of breaking through the High/Low price channel. The indicator algorithm filters market noise, takes into account volatility and market dynamics. Indicator capabilities Using smoothing methods, it shows the market trend and entry points for opening BUY or SELL orders. Suitable for determining short-term and long-term market movements by analyzing charts on any timeframes.
Trading Special –40% OFF Best Solution for any Newbie or Expert Trader! This Indicator is a unique, high quality and affordable trading tool because we have incorporated a number of proprietary features and a new formula. With only ONE chart you can read Currency Strength for 28 Forex pairs! Imagine how your trading will improve because you are able to pinpoint the exact trigger point of a new trend or scalping opportunity? User manual: click here That's the first one, the original! Don't buy a
Easy Breakout
Mohamed Hassan
4.71 (14)
After your purchase, feel free to contact me for more details on how to receive a bonus indicator called VFI, which pairs perfectly with Easy Breakout for enhanced confluence!    Easy Breakout is a powerful price action trading system built on one of the most popular and widely trusted strategies among traders: the Breakout strategy ! This indicator delivers crystal-clear Buy and Sell signals based on breakouts from key support and resistance zones. Unlike typical breakout indicators, it levera
Volatility Trend System - a trading system that gives signals for entries. The volatility system gives linear and point signals in the direction of the trend, as well as signals to exit it, without redrawing and delays. The trend indicator monitors the direction of the medium-term trend, shows the direction and its change. The signal indicator is based on changes in volatility and shows market entries. The indicator is equipped with several types of alerts. Can be applied to various trading ins
Trend Lines PRO
Roman Podpora
5 (1)
TREND LINES PRO    helps understand where the market is truly changing direction. The indicator shows real trend reversals and points where major players re-enter. You see   BOS lines   Trend changes and key levels on higher timeframes — without complex settings or unnecessary noise. Signals don't repaint and remain on the chart after the bar closes. VERSION MT 5     -     Reveals its maximum potential when paired with the   RFI LEVELS PRO  indicator What the indicator shows: Real shifts   tren
GOLD Impulse with Alert
Bernhard Schweigert
4.67 (12)
This indicator is a super combination of our 2 products  Advanced Currency IMPULSE with ALERT  and  Currency Strength Exotics . It works for all time frames and shows graphically impulse of strength or weakness for the 8 main currencies plus one Symbol! This Indicator is specialized to show currency strength acceleration for any symbols like Gold, Exotic Pairs, Commodities, Indexes or Futures. Is first of its kind, any symbol can be added to the 9th line to show  true currency strength accelerat
Order Block Hunter
Noha Mohamed Fathy Younes Badr
5 (10)
Order block hunter indicator is the best indicator for  hunt the order blocks that area where there has been a large concentration of limit orders waiting to be executed Order blocks are identified on a chart by observing previous price action and looking for areas where the price experienced significant movement or sudden changes in direction .This indicator does that for you by using very complicated codes and helps you to take the best areas To buy and sell because it make marks at the best a
- Real price is 80$ - 40% Discount (It is 49$ now) Contact me for instruction, add group and any questions! - Non-repaint - I just sell my products in Elif Kaya profile, any other websites are stolen old versions, So no any new updates or support. - Lifetime update free Related product:   Bitcoin Expert Introduction The breakout and retest strategy is traded support and resistance levels. it involves price breaking through a previous level.  The break and retest strategy is designed to help tr
KT Gaussian Trend Filter MT4
KEENBASE SOFTWARE SOLUTIONS
The KT Gaussian Trend Filter combines Gaussian filtering with linear regression smoothing to deliver clear and accurate trend analysis. It generates easy-to-follow buy and sell signals while effectively highlighting the market's long-term direction. Features Fully Customizable Gaussian Filter: Adjust length and pole settings to fine-tune smoothing precision and enhance trend clarity. Linear Regression Enhancement: Further refines the Gaussian smoothing, minimizing false signals caused by market
Special offer : ALL TOOLS , just $35 each! New tools   will be   $30   for the   first week   or the   first 3 purchases !  Trading Tools Channel on MQL5 : Join my MQL5 channel to update the latest news from me The Volumetric Order Blocks Multi Timeframe indicator is a powerful tool designed for traders who seek deeper insights into market behavior by identifying key price areas where significant market participants accumulate orders. These areas, known as Volumetric Order Blocks, can serve as
Advanced Supply Demand
Bernhard Schweigert
4.91 (299)
Trading Special – 40% OFF Best Solution for any Newbie or Expert Trader! This indicator is a unique, high quality and affordable trading tool because we have incorporated a number of proprietary features and a new formula. With this update, you will be able to show double timeframe zones. You will not only be able to show a higher TF but to show both, the chart TF, PLUS the higher TF: SHOWING NESTED ZONES. All Supply Demand traders will love it. :) Important Information Revealed Maximize the pot
Route Lines Prices is an indicator designed for finding price directions. Its simple interface contains multiple algorithms for price behavior and future direction calculations. These algorithms include volatility calculations and price smoothing based on the timeframes used. The indicator has a single parameter for changing the " Calculating Price Values " value. The default value of 1 provides a balanced automatic calculation, which can be used without manually configuring the indicator. By m
Stratos Pali
Michela Russo
4.43 (7)
Stratos Pali Indicator   is a revolutionary tool designed to enhance your trading strategy by accurately identifying market trends. This sophisticated indicator uses a unique algorithm to generate a complete histogram, which records when the trend is Long or Short. When a trend reversal occurs, an arrow appears, indicating the new direction of the trend. Important Information Revealed Leave a review and contact me via mql5 message to receive My Top 5 set files for Stratos Pali at no cost! Dow
Trading Special – 40% OFF Best Solution for any Newbie or Expert Trader! This dashboard software is working on 28 currency pairs plus one. It is based on 2 of our main indicators (Advanced Currency Strength 28 and Advanced Currency Impulse). It gives a great overview of the entire Forex market plus Gold or 1 indices. It shows Advanced Currency Strength values, currency speed of movement and signals for 28 Forex pairs in all (9) timeframes. Imagine how your trading will improve when you can watch
Daily Candle Predictor is an indicator that predicts the closing price of a candle. The indicator is primarily intended for use on D1 charts. This indicator is suitable for both traditional forex trading and binary options trading. The indicator can be used as a standalone trading system, or it can act as an addition to your existing trading system. This indicator analyzes the current candle, calculating certain strength factors inside the body of the candle itself, as well as the parameters of
Volumatic Fair Value Gaps   is a precision-engineered indicator for identifying, analyzing, and visualizing   Fair Value Gaps (FVGs)   backed by volume intelligence. This tool goes beyond standard FVG plotting by dissecting volume dynamics inside each gap using   lower-timeframe sampling , offering clear insight into whether bulls or bears dominate the imbalance. Designed for technical traders, this indicator overlays high-probability gaps only, visualizes   bullish vs. bearish volume compositio
More from author
MaxiFinishTrend 2
Stsiapan Kreidzich
4.78 (32)
Smart trading system . All timeframes, currencies, cryptocurrencies, metals... All MT4 and any screens and template are configured automatically. A beginner will simply trade based on a signal. The parameters of a unique flexible algorithm are open in settings.      Idea 1:   In addition to “BUY/SELL”, signal “GET PROFIT” are given at extreme points. This tactic increases the result - you have profits when maximum and have more transactions. If "Take Profit" or "Stop Loss" triggered, or if you
MaxiFinish Gold
Stsiapan Kreidzich
Signals for entering and exiting trades for currencies, gold, oil,  crypto - all in MT4 without redrawing and with a trend forecast. Even a beginner can easily trade on any timeframe. Flexible and accurate algorithm for auto-tuning signals that can be seen on the screen, heard in English, received on a smartphone. The indicator has a system of hints for training the user. Hover the mouse pointer over any object and you will see. Instead of a user manual, download a free demo version and study
Filter:
Enrique Enguix
120889
Enrique Enguix 2022.04.28 08:49 
 

It is an indicator at least "curious". I am still investigating how to take advantage of this information for my business. The approach that the developer has given to it is interesting. Congratulations. I will update to 5 stars when I know more about the indicator. Thank you.

EDIT- Quick change in my rating, 5 stars, it's a great indicator

Stsiapan Kreidzich
5001
Reply from developer Stsiapan Kreidzich 2022.04.28 12:32
Thanks for the feedback. I have added more information about the indicator in the comments. Please read.
faithdefender
1736
faithdefender 2022.04.03 21:39 
 

It looks like a valuable tool to us in trading, but after tinkering with it for a while I just understand how to use the free version. I tried to ask about the paid indicator from the Vendor, (not cheap....$125.00) but never heard back.

With all due respect; I am not giving 3 stars because I never heard back. I am giving three stars because I am unable to understand how the indicator works. It is unclear to me. Therefore, what good is a free indicator if it is not understandable and able to use? I am sorry you never saw the message. Nevertheless, my point was how can I proceed to understand the paid indicator if I am unable to understand the free indicator. Thank you

Stsiapan Kreidzich
5001
Reply from developer Stsiapan Kreidzich 2022.08.06 02:50
2022.04.03. Thanks for the feedback. I have no messages from you in my MQL5 Profile. Please send correctly. I answer and send instructions to everyone who writes to me.
I'm glad that not only programmers understand this very innovative indicator. I think not 5 stars because "never heard back". You can correct rating. Please write me via MQL5 questions about the paid indicator (rent is very cheap). ________ADDED 2022.08.06. I, for example, do not understand how a red carrot grows from black earth, but this does not prevent me from buying and using it with pleasure. Please click the link to the paid indicator
https://www.mql5.com/en/market/product/38748 There in [Comments] in my 200+ answers to questions that really wrote to me, those who really want to understand will find many explanations with screenshots of how to use stochastics for effective trading.
Reply to review