
VisualHistory MT4
- Utilities
-
Alexey Lopatin
 I'm developer experienced in MQL, C++, C# - programming. I work in MetaTrader since 2007 year. I have an experience in NinjaTrader, ForexTester and cAlgo also.
I am pleased to help and provide consultation for you. - Version: 1.0
Description
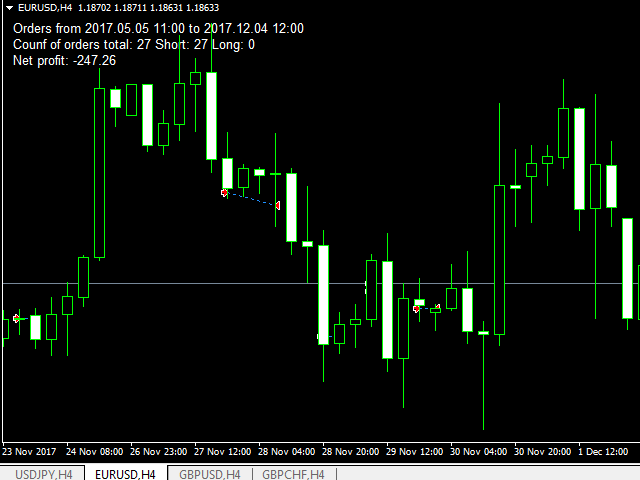
VisualHistory plots positions (Buy and sell orders only) from history of account on a chart. It draws the standard arrows for entry/exit and connects them by the dashed line. Also, VisualHistory displays information on the top left corner of a chart concerning displayed positions: positions count, net profit.
Download it to the <MQL4/Experts> directory of your MetaTrader.
Options
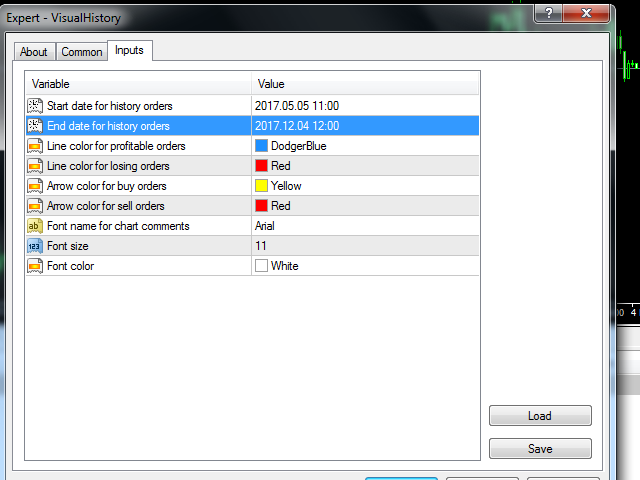
- Start date for history orders - start date of displayed trade history
- End date for history orders - end date of displayed trade history
- Line color for profitable orders - color of the line that connects entry and exit arrows on the chart for profitable orders
- Line color for losing orders - color of the line that connects entry and exit arrows on the chart for losing orders
- Arrow color for buy orders - color of the arrow for buy positions on a chart
- Arrow color for sell orders - color of the arrow for sell positions on a chart
- Font name for chart comments - font text for information labels in the top left corner
- Font size - font size for information labels in the top left corner
- Font color - font color for information labels
















































Good job.