Correlation Matrix and Open Position Exposure

  • Indicators
  • Kazuma Uezono
    Kazuma Uezono
    MQL5 / MQL4 / Pine Script v6 developer and active trader.
    Seller on the MQL5 Market (indicators for MT4/MT5).
    Services:
    - TradingView Pine Script to MT5/MT4 conversion (bar-by-bar matching, with tester report)
    - MT4 to MT5 migration
  • Version: 1.2
  • Activations: 5
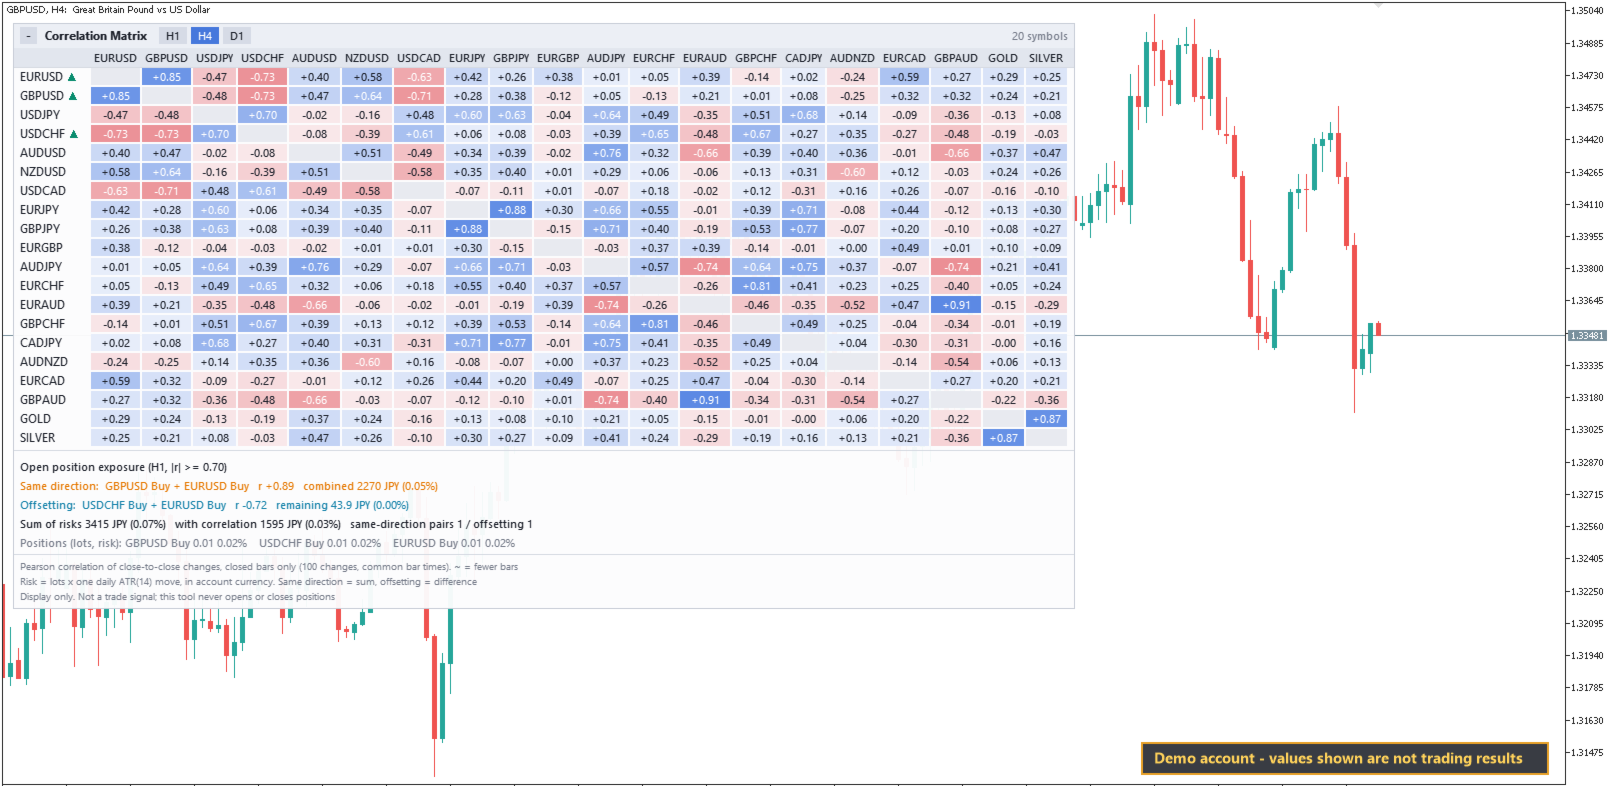
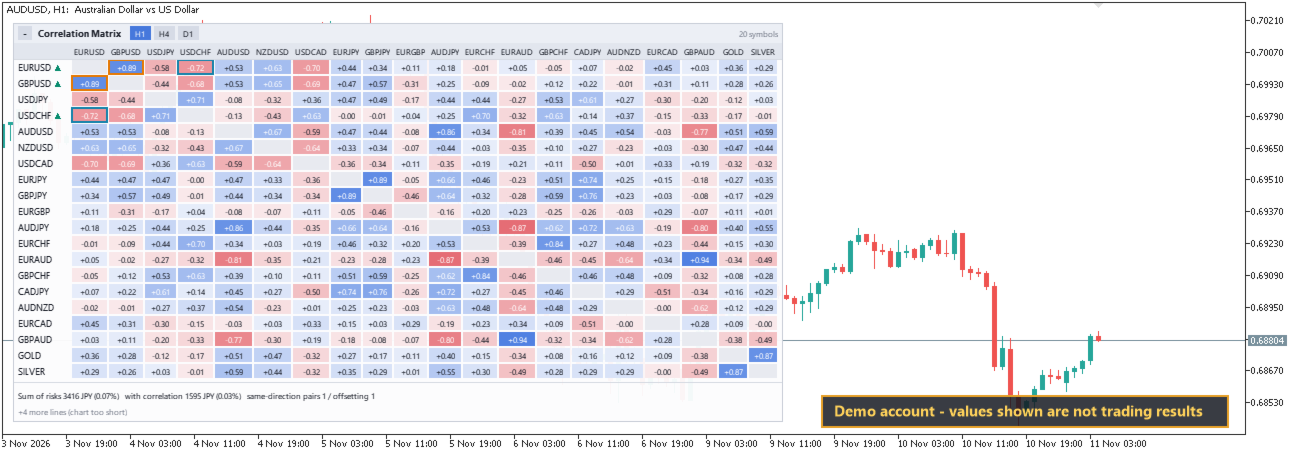
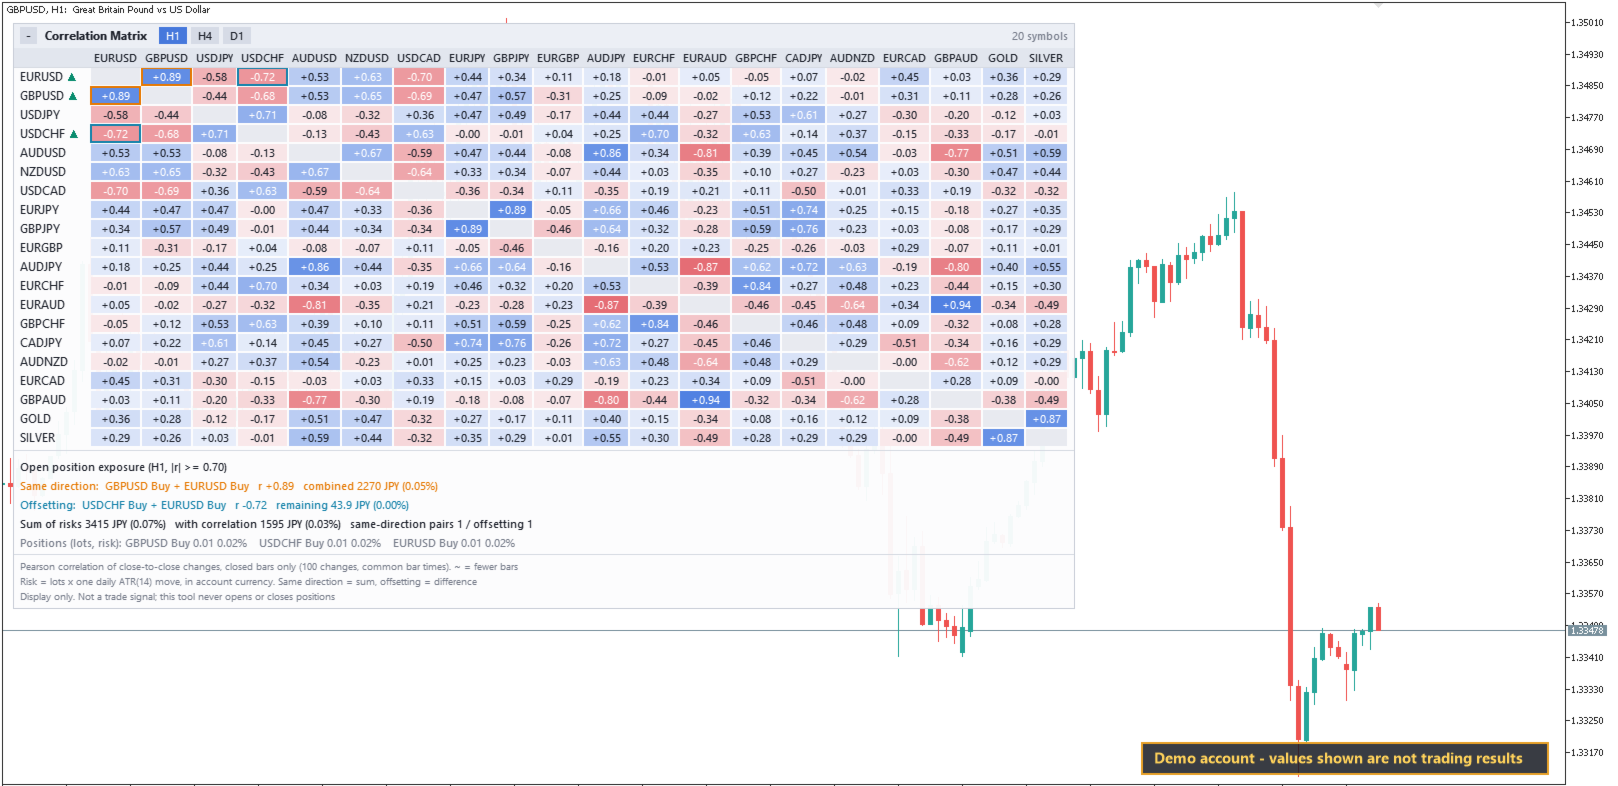
Correlation Matrix and Open Position Exposure shows two things in one panel on your MetaTrader 5 chart: a heat map of how closely up to 20 symbols have moved together, and a list of the pairs of your open positions that are highly correlated. A pair is marked either as same-direction concentration (the positions tend to win or lose together, so their risks add up) or as offsetting (they tend to cancel each other out).
It is meant for traders who hold several positions at once and want to see when, for example, a long EURUSD and a long GBPUSD are close to one bigger position. It is a display tool only: it gives no buy or sell signals and never opens, modifies or closes a position or order.

Features
- Correlation heat map for up to 20 symbols: the first 20 symbols in Market Watch, or your own comma-separated list (broker prefix and suffix detected automatically or set by hand). Symbols with open positions are always added (can be turned off).
- Timeframes M15, M30, H1, H4 and D1, each on or off (default H1, H4, D1). Switch between them with the tabs on the panel.
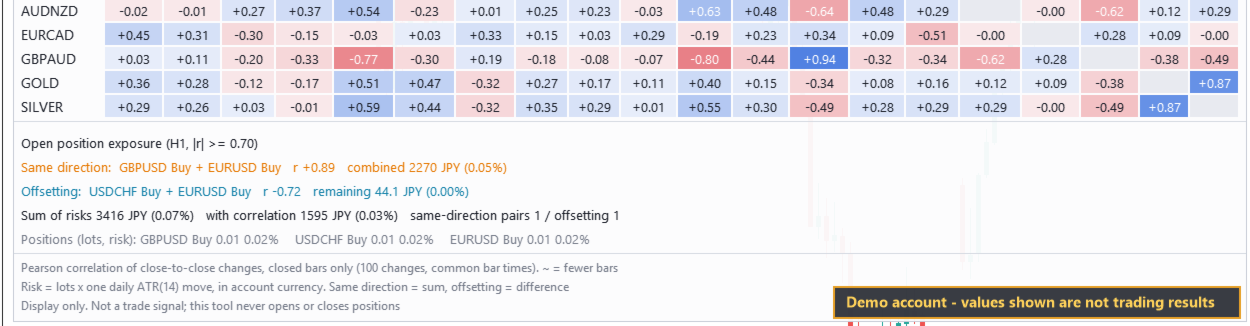
- Open position exposure on the timeframe you choose (default H1): net lots per symbol (buy +, sell -, a hedge on the same symbol is netted), a risk estimate per symbol, and every pair of held symbols with |r| at or above your threshold (default 0.70), marked "Same direction" with the combined risk or "Offsetting" with the remaining risk.
- Totals: the simple sum of the risks and an estimate that takes the correlations into account, both also as % of equity.
- Optional filter by magic number, to look only at the positions of one EA.
- Click a symbol row to switch the chart to that symbol. Collapse button, three sizes, light or dark colors from the chart background, four corners; several copies in the same corner are stacked.
- Alert when a new same-direction pair reaches a combined risk of X % of equity (off by default). Pop-up and push notification.
- Two buffers for your own EAs (iCustom).
- English or Japanese (Auto follows the terminal language).

Main Inputs
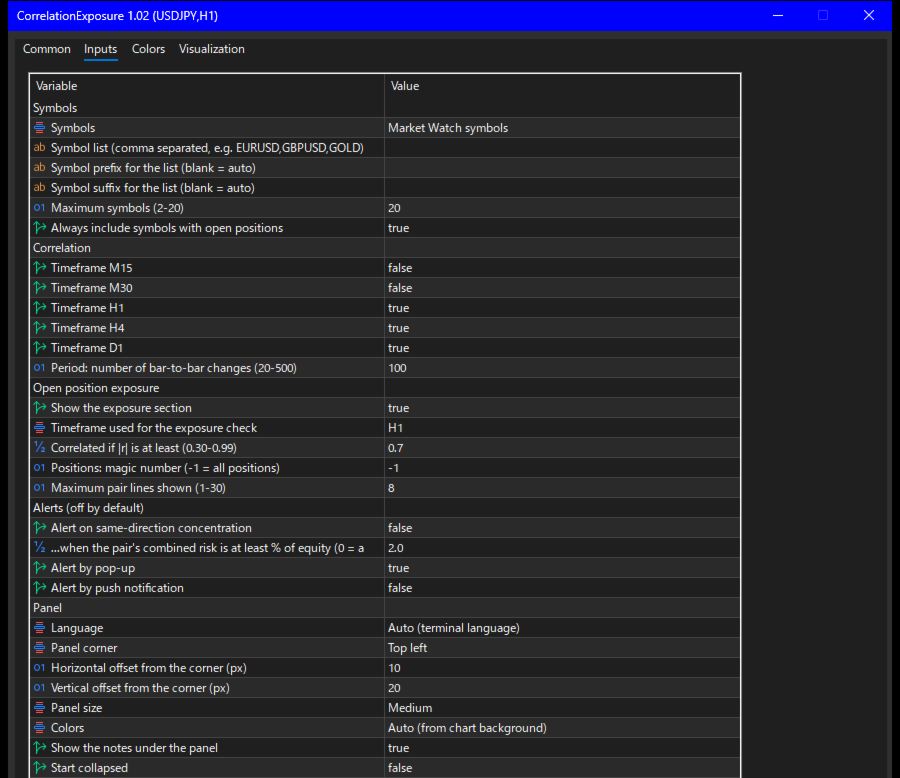
- Symbols: Market Watch or list, the list, prefix, suffix, maximum symbols (2-20), always include held symbols.
- Correlation: the five timeframes, period (number of bar-to-bar changes, 20-500, default 100).
- Open position exposure: show or hide, timeframe for the check, threshold |r| (0.30-0.99), magic number (-1 = all positions), maximum pair lines (1-30).
- Alerts: on or off, minimum combined risk in % of equity (0 = any pair), pop-up, push.
- Panel: language, corner, offsets, size, colors, notes under the panel, start collapsed.
- 30 inputs in 6 groups.

How It Is Calculated
- Closed bars only; the current bar is never used. For each pair of symbols only bars with the same open time on both symbols are used. From the latest "period + 1" common bars the indicator builds the close-to-close changes (close / previous close - 1) and calculates the Pearson correlation coefficient r.
- If two symbols have fewer common bars than the period (different trading hours, short history), r is calculated from what exists and shown faded with "~" as a reference value. With fewer than 10 changes it shows "-".
- Risk per symbol = net lots x the money value of one daily ATR(14) move, in the account currency. This is the size of one typical daily move, not a stop loss and not a maximum loss.
- For a pair, direction A x direction B x the sign of r decides the kind: positive = same direction (combined = sum of the two risks), negative = offsetting (remaining = difference).
- The estimate with correlation is the square root of E'CE (E = signed risks, C = the correlation matrix of the exposure timeframe). It is a rough figure, not a statistical forecast.

Notes and Limits
- Correlation describes how the symbols moved in the chosen period. It changes over time, can break down quickly (for example around major news) and is not a forecast. Colors show the sign and size of r; they are not buy or sell colors. Past values do not guarantee future results. Trade decisions are your own.
- The risk figures are an estimate based on one daily ATR. Real moves can be much larger, and gaps, slippage and spread are not included. They are not a limit on your loss.
- Only open positions are counted; pending orders are not. A held symbol that is not in the matrix is marked * (correlation unknown).
- Market Watch mode uses the first 20 symbols in Market Watch. To choose the symbols, use list mode. In list mode, symbols not in Market Watch are added to receive data and removed again when the indicator is removed (unless a chart, position or order uses them).
- The first time a symbol is used, the terminal may need some time to load its history; until then the panel shows that it is loading.
- Panel size: with 20 symbols and size Medium the panel is about 560 pixels high, with many positions about 630 to 800 pixels. On a lower chart the panel shrinks (text down to 75%), puts the exposure lines that do not fit into "+N more lines" (the line with the sum of risks stays), and if it still does not fit, shows only the top part with the title marked. To make it smaller: size Small, fewer symbols, notes off, fewer pair lines, or collapse it.
- One-click trading panel: in the top-left and bottom-left corners the panel moves out of its way automatically, also when you turn it on or off (within about one second). The right corners do not overlap it.
- Alerts: the same pair is reported at most once every 30 minutes. Pairs that already exist when the indicator starts are not reported. No alerts in the Strategy Tester or from iCustom. Push notifications need the terminal's settings.
- iCustom: buffer 0 = number of same-direction pairs, buffer 1 = the largest combined risk among them in % of equity. The values advance only when ticks arrive, so they can take from a few seconds to about 45 seconds to appear. Buffer 1 is EMPTY until the daily ATR is loaded and when there is no same-direction pair. Pass inputs in their valid ranges. In the Strategy Tester without visual mode the indicator does nothing (EMPTY).
- Strategy Tester visual mode: if there are no positions, the panel shows demo positions (marked as tester only) so that the exposure section can be seen. No orders are placed.
- Keep the input "Debug" off; it writes a check file for development.

Compatibility and Support
- MetaTrader 5 only. The MetaTrader 4 version is a separate product. Works on any chart with the forex, metal, index and other symbols your broker provides.
- No DLLs, no internet access.
- Support through MQL5 messages, reply within 3 business days: installation, settings and bug reports. Questions about market views, trade decisions or which positions to hold cannot be answered.
Recommended products
Stop wasting time scanning dozens of currency pairs. MaMI Pair Quality Engine v5 instantly shows which pairs deserve attention and which pairs should be avoided, helping traders focus only on the highest-quality currency pair opportunities. Full Product Description MaMI Pair Quality Engine v5 is a MetaTrader 5 indicator designed to help traders quickly identify which forex pairs deserve attention before moving to deeper analysis or execution. Instead of forcing you to scan many pairs manually,
Desi Bulls PA King Pro
Muhammad Bilal Hussain Khan Muhammad
Desi Bulls PA King Pro — Pure Naked Price Action Sniper Indicator Desi Bulls PA King Pro is an institutional-grade, 100% NON-REPAINTING Naked Price Action indicator designed for precision scalping on Gold (XAUUSD) and Bitcoin (BTCUSD) on the M5 and M15 timeframes. Unlike conventional indicators that clutter your chart with lagging moving averages, RSI, or stochastics, PA King Pro uses pure candlestick geometry, fractal liquidity sweeps, and macro trend flow to identify high-probability instit
Gold Pressure Matrix
Christopher Calmerin
OVERVIEW -------- Gold Pressure Matrix MTF is a professional MetaTrader 5 indicator designed to estimate bullish and bearish pressure in the gold market. Instead of relying on one signal, the indicator combines five analytical modules across five configurable timeframes. It then displays Buy Pressure, Sell Pressure, timeframe alignment, signal quality, market condition, and a final directional signal inside a clear black dashboard. The indicator is primarily designed for XAUUSD and can be used a
FREE
The indicator builds current quotes, which can be compared with historical ones and on this basis make a price movement forecast. The indicator has a text field for quick navigation to the desired date. Options: Symbol - selection of the symbol that the indicator will display; SymbolPeriod - selection of the period from which the indicator will take data; IndicatorColor - indicator color; Inverse - true reverses quotes, false - original view; Next are the settings of the text field, in w
EUR/USD Trade Plan Assistant Manual EUR/USD entry and risk-planning indicator for MetaTrader 5. It displays confirmed trade plans with entry, stop, target, position volume, time limit and combined account risk in a clear chart interface. Product description EUR/USD Trade Plan Assistant is designed for traders who want structured EUR/USD trade plans without automatic order execution. The indicator continuously evaluates EUR/USD and can display up to three independent trade plans based on differen
Xau Vector
Johnny Da Silva
If you would like to receive more high-quality free EAs, please support my work by leaving a review. My Products: View My Products My Profile / Support / Contact: Visit My Profile My Channel: Follow My Channel XAU Vector is an automated trading system developed specifically for Gold (XAUUSD), combining quantitative analysis with local machine learning architecture. Designed for structural capital management, the Expert Advisor focuses on disciplined execution, making it suitable for both pe
FREE
SMART EXIT Currency Strength Meter is a professional Forex currency strength indicator designed to identify the strongest and weakest currencies in real time. The indicator analyzes 27 major Forex pairs and ranks the 8 major currencies according to their relative strength. By combining EMA momentum analysis with volatility-adjusted calculations, traders can quickly identify market leaders and laggards without manually reviewing dozens of charts. Main Features • Real-time ranking of the 8 major c
XOATRHIST 5
Ainur Sharipov
3 (1)
Version for MetaTrader 5. The indicator is based on point and figure chart, but their period is equal to ATR indicator values. Displays in the form of steps. Steps above zero indicate an uptrend. Below zero on a downtrend. Parameters: ATRPeriod - ATR period for calculation of steps. Note: The indicator uses closes price, thus it is recommended to consider completed bars.
Buyer Seller Arrows – Trade with Confidence! Discover a revolutionary tool for visual analysis of buyer and seller strength across all timeframes – from M1 up to MN1. This indicator gives you an instant overview of market dynamics with color‑coded percentages and arrows. Key Features: Green upward arrows = buyer dominance Red downward arrows = seller dominance Percentage strength for each timeframe (M1, M5, M15, M30, H1, H4, D1, W1, MN1) Color coding for quick orientation (bright green and
Supply and Demand Monster
Tsog Erdene Borjigon Enkhkhudulmur
Supply and demand zones are at the heart of   supply and demand trading . These zones are areas that show  liquidity at a specific price.  The supply zone is also called the distribution zone, while the demand zone is called the accumulation zone.   Our indicator automatically draw supply and demand zones in Metatrader 5. It give opportunity to understand trading zone and avoiding risk.
Do you use volume in your reading of the market? Certainly many traders use it, and do not imagine operating without it. The Color Histogram Volume Set indicator allows the user to choose the value that he considers interesting to monitor. When you pass this you will have visual confirmation and if you want you will also have the audible alert that is given by the indicator. Of course, there are other ways to try to find a high volume, such as assessing whether the volume is above av
Like the logic of this tool? Explore the full ecosystem of professional indicators and utilities, built by a trader for traders: All author's products in MQL5 Market: https://www.mql5.com/en/users/musa1994/seller Trading philosophy and details: https://developer-mql4-mql5.netlify.app/ Volume Profile + CVD is a professional volume analysis indicator for MetaTrader 5 that displays volume distribution by price levels and cumulative volume delta. The indicator answers two key trader questio
Hourly Spread Profile reads your own account's closed bars and shows, hour by hour, what the spread actually cost on the symbol and timeframe you have open. It does not predict, and it does not advise. Every number on the panel already happened. How the numbers are built: for each of the 24 server-time hours it takes the median spread across up to 5,000 closed bars, whichever the terminal holds. Median, not average, so one wide spike during a news release does not relabel a whole hour. An hour
FREE
Volume Profil MT5
Vincent Jose Proenca
Volume Profile Rectangle Summary An interactive volume profile indicator that displays a horizontal analysis of traded volume at each price level within a selected area. It automatically creates a movable rectangle and shows colored bars representing bullish and bearish volume distribution. What it does: Displays horizontal volume : Visualizes the volume distribution at each price level as horizontal bars Bullish/Bearish analysis : Colors bars in green (bullish-dominant volume) or red (bearish-d
Volume Profile Dynamic
OSCAR GUTIERREZ JIMENEZ
1. Descripción: Dibuja perfiles de volumen dinámicos a partir de rectángulos dibujados manualmente. Para cada rango calcula POC, VAH, VAL, VWAP, mediana, máximo/mínimo y una barra open-close tipo Range Bar. Permite ajustar modos visuales en formato volumen, buy/sell, delta o TPO y estilos mediate inputs o HotKeys. Todos los niveles, los valores de balance y los de rotation son visibles en la Ventada de Datos y accesibles con iCustom(). 2. Leyenda:    POC = precio con mayor volumen    VAH/VAL =
Relative Volume Profile (RVP) Stop guessing where the smart money is trading. See the exact price levels that matter. Overview Traditional Volume Profiles tell you where volume occurred, but they leave out a crucial piece of the puzzle: intensity . The Relative Volume Profile (RVP) is a next-generation charting tool that fuses standard price profiling with Relative Volume (RVOL) analysis. Instead of drawing plain, monotone blocks, RVP color-codes every single price level based on aggressive buyi
Volume Bubble Pro
Alexander Henzel
5 (1)
Volume Bubble Pro is an advanced visualization tool for MetaTrader 5 that displays trading volume directly on the price chart. Instead of relying on separate histograms at the bottom of the screen, this indicator shows volume intensity through dynamic circles (bubbles) directly at the respective candle. Why Volume Bubble Pro? Standard volume displays merely show absolute numbers but often lack context. Volume Bubble Pro statistically compares the current volume with the average of the previous p
This indicator is designed for M1 timeframe and shows: Sum of points when the price goes up (Green Histogram). Sum of points when the price goes down (Red Histogram).  In other words, by the number and ratio of bullish points to bearish ones, you can do a technical analysis of the state of the market. If the green histogram prevails over the red one, you can conclude that at the moment the buyers are stronger than the sellers, and vice versa, if the red histogram prevails over the green, the se
Predictor 300 mt5
Joel Brito De Mesquita
Predictor 300: O Indicador Definitivo para Dominar a Tendência no Forex! Se você busca precisão, clareza e consistência no mercado financeiro, o Predictor 300 é a ferramenta de alta performance que faltava na sua plataforma MetaTrader 5. Desenvolvido com algoritmos de última geração, ele foi projetado para transformar a forma como você enxerga o gráfico. Aqui estão os grandes diferenciais que fazem do Predictor 300 um indicador indispensável: Universal e Adaptável : Ele é ótimo e auxilia
The Effort and Result indicator is based on the work of Karthik Marar; a volume spread analysis trader. It compares a price change (Result) to the volume size (Effort) for a certain period.  By comparing the effort and result, we can get more information about the future price movement. Both values are normalized and converted to a scale of 0 - 100 % based on a selectable look-back period. This indicator is also known as the Effort Index. The law of effort and result The law of effort vs. res
Titan Zaghaba Pro
Wissam Mostafa Mohamed Jaeitr
Titan Zaghaba Pro: The Ultimate Scalping & Risk Management System [AR] مؤشر تيتان زغابة برو: النظام المتكامل للمضاربة السريعة وإدارة المخاطر الاحترافية 1. Description / الوصف [EN] Titan Zaghaba Pro is a high-precision trading workstation designed for scalpers and day traders. It combines a sophisticated RSI Momentum algorithm with a built-in Professional Risk Manager . It doesn't just give you signals; it tells you exactly how much to risk and how to manage your trade from entry to the final ta
NovaTac Fixed Volume Profile displays configurable volume-at-price profiles with POC, value area, nodes and closed-bar context alerts. Overview NovaTac Precision Volume Profile is an analytical chart indicator for MetaTrader 5. It organizes available volume across price rows and displays the areas where trading activity was concentrated within a selected range. The indicator does not open, modify or close trades. It is intended to support chart analysis and discretionary decision-making. Pr
FREE
Volatility Range Bars Pro(MT5) Visualize Volatility. Sharpen Your Entries. Trade with Confidence. Volatility Range Bars Pro is a powerful MetaTrader 5 indicator designed for traders who want instant clarity on market volatility and pip-based positioning. Whether you're scalping or day trading, this tool gives you a visual "volatility ruler" that helps you: Instantly gauge current market volatility Estimate take-profit and stop-loss distances at a glance Stay grounded in your risk-reward strategy
Stats Summary
Elidio Xavier Guimaraes
Enhance Your Technical Analysis with Stats Summary . The Stats Summary is a robust analytical tool developed for MetaTrader 5 (MT5), providing a detailed statistical overview of price behavior. Unlike traditional indicators, it uses descriptive statistics to map the distribution of prices over a customizable sample period. By defining the sample size, the indicator calculates and displays the following values on the chart: Minimum and Maximum (Min/Max): The complete price range of the selected i
CURRENCYPOWER NAVIGATOR MT5 Currency Strength Ranking Dashboard TAGLINE See the strongest and weakest currencies before choosing the pair. PRODUCT OVERVIEW CurrencyPower Navigator MT5 is a currency-strength indicator for MetaTrader 5. Instead of focusing on one chart only, it evaluates a basket of major Forex pairs and estimates the relative strength of individual currencies. The indicator then ranks the main currencies and helps identify stronger-versus-weaker combinations that may offer
FREE
VR Grid Mt5
Vladimir Pastushak
3 (9)
The VR Grid indicator is designed to create a graphical grid with user-defined settings. Unlike the standard grid , VR Grid is used to build circular levels . Depending on the user's choice, the step between the round levels can be arbitrary. In addition, unlike other indicators and utilities, VR Grid maintains the position of the grid even when the time period changes or the terminal is rebooted. You can find settings, set files, demo versions, instructions, problem solving, at [blog] You can
FREE
Histogram Volume (Custom) An advanced indicator for precise and clear volume analysis. What It Does Displays bull/bear pressure based on current market activity Shows real trading volumes in real time Creates a color‑coded histogram visualizing buyer and seller strength Tracks average volume and deviations over the last X candles Normalizes values across timeframes — works seamlessly from M1 to MN1 Includes a live panel with key volume statistics Why It’s Useful Instantly reveals which side o
Reactivity
Vincent Jose Proenca
Reactivity Indicator – Economic Event Response Measurement for MT5 The Reactivity Indicator analyzes and quantifies market reactions to economic calendar events in real time. It automatically measures price movement (in pips) at 10, 30, and 60 seconds after each major economic announcement. Key Features  Automatic Event Retrieval Seamless integration with MT5’s native Calendar API – no external setup required.  Precise Post-News Volatility Measurement Calculates price movement speed (pips per
TradeAQ
Guo Sheng Zhao
LuoMo Volume & Price Structure 8.98 A multi-function chart indicator for   MetaTrader 4 and MetaTrader 5 , designed to display key volume, volatility, sentiment, and price-structure information directly on the main chart. Main Features Volume and price-based Support & Resistance Volume spike and exhaustion signals ATR volatility expansion alerts Volume Profile with HVN and LVN Bullish and bearish sentiment distribution Developing or fixed POC VAH and VAL levels Supply and Demand zones Volume-wei
Manzano Footprint Order Flow
Patricia Manzano Gomez
5 (1)
MANZANO FOOTPRINT ORDER FLOW Footprint, Order Flow and Volume Analysis for MetaTrader 5 Manzano Footprint Order Flow is an analytical indicator for MetaTrader 5 that brings together Footprint charts, Bid x Ask, Delta, Cumulative Delta (CVD), Imbalances, Volume Profile, VWAP, Market Depth and Time & Sales in an interactive environment. It allows traders to examine activity within individual candles, identify volume concentrations, compare buying and selling pressure, and analyse how market partic
Buyers of this product also purchase
Trend Sniper X
Sarvarbek Abduvoxobov
4.86 (44)
Trend Sniper X is a multi-timeframe trend-following indicator for MetaTrader 5 that helps traders identify trend direction and potential reversal points with clarity and precision. for MT4: https://www.mql5.com/en/market/product/193245 Price Information: The current price is promotional and is subject to change as upcoming updates and new features are released. Bonus Offer: To get the FREE Auto-Trade Assistant EA for this indicator, please message the author after purchasing. Code2Profit Channe
A new King in town - Indicator + Order management indications(tp1+tp2+tp3) + Optional Telegram Signal sender   INCLUDED (FREE) + Bonus EA Robot ( FULL TRADING  and SIGNAL SYSTEM ) Our best EA for Gold: Gold Slayer TRY > Reversion Queen  Expert advisor >JOIN Community Channel < NEW Free Automation EA link < click here ( disclaimer: this is new and still on testing and phase , use at your risk on demo) Free Telegram Bridge < click here  This indicator includes an advanced Strategy, a trading sys
Smart Trend Trading System — MetaTrader 5 Message me on MQL5 after purchase to receive Smart Universal Expert Advisor for FREE, plus the online course, PDF manual, and private group access. STTS brings trend direction, entry and exit signals, reversal zones, and important price levels together on your chart. Follow the system manually, or connect a separate compatible EA for automated execution using your chosen settings. ONE SYSTEM. FOUR TRADING APPROACHES. STTS organizes its trading approaches
M5 Sniper
MeanFX
5 (4)
Get your trading edge in the line of sight M5 Sniper   is a new indicator by MeanFX. It combines   precise trading signals   with   adaptive TP/SL levels   - creating best possible statistical trades as a result! The price increases every 5 purchases, the next price is 79$ Message me after purchase to receive tips/guide and bonus EA plus trading methodology Auto Optimisation only works on LIVE chart , needs data feed >JOIN Community Channel < What makes it stand out?   Proven statistical per
Entry Points Pro shows you where to enter, where to put the stop and what lot to trade — before you place the order. PRICE Now 199 USD: 10 copies at this price, then 249 USD. The final price is 349 USD. I make my money trading the markets, and I show it, so I don't need to sell this indicator to everyone. It is a tool for traders who think for themselves, not a magic button. The arrow appears when the candle closes and does not repaint. Two settings: your deposit and your risk per trade. Chec
Ultra Indicator
Ihor Otkydach
5 (1)
ULTRA is a technical indicator that operates on an “all-in-one” basis—it independently analyzes the market, generates trading signals, displays levels for setting stop-loss orders, and suggests when to close trades to lock in profits or minimize losses. In other words, it doesn't matter if you don't know how to analyze the market, determine levels—where to set your stop-loss—or struggle with money management. ULTRA will do all of that for you! BUYER BONUS: After purchasing the ULTRA indicator, s
Gann Made Easy   is a professional and easy to use Forex trading system which is based on the best principles of trading using the theory of W.D. Gann. The indicator provides accurate BUY and SELL signals including Stop Loss and Take Profit levels. You can trade even on the go using PUSH notifications. PLEASE CONTACT ME AFTER PURCHASE TO GET TRADING  INSTRUCTIONS   AND GREAT EXTRA INDICATORS  FOR FREE! Probably you already heard about the Gann trading methods before. Usually the Gann theory is a
SuperScalp Pro
Van Minh Nguyen
4.54 (37)
SuperScalp Pro - Professional Multi-Layer Confluence Scalping System SuperScalp Pro is an advanced scalping indicator that upgrades the classic Supertrend with multiple intelligent confirmation filters. It helps you identify higher-probability Buy/Sell opportunities while significantly reducing false signals. Clear Buy and Sell arrows appear directly on the chart, along with automatic ATR-based Stop Loss and Take Profit levels calculated in real time. After purchase, please message me on MQL5 to
Gold Trend Coach MT5
Cristhian Alexander Gaibor Cuasquer
4.27 (11)
Non-repainting buy and sell signals for gold (XAUUSD) on MetaTrader 5. Every signal comes with a stop loss and three take profits. A Smart Money Concepts filter with BOS and CHoCH, so you trade with the structure, not against it. A live Mentor on your panel that guides every step from the entry to TP3. And alerts straight to your phone and your own Telegram channel. That is Gold Trend Coach. Never trade alone again. FREE BUYER KIT with your purchase: 1. Telegram Alert Bridge: your signals go to
SMC Intraday Formula
VividMind Digital Solutions
5 (26)
Secure the Lowest Price Today. After purchase, contact via   MQL5 inbox   to receive your buyer kit and bonus. Let's be honest first. No indicator will make you profitable on its own. If someone tells you otherwise, they're selling you a dream. Every indicator that shows perfect buy/sell arrows can be made to look flawless — just zoom into the right window of history and screenshot the winners. We won't do that. SMC Intraday Formula is a tool. It reads the market structure for you, maps the hig
Boba Analysis Suite
Trade Ready Solutions LLC
5 (2)
Boba Analysis Suite Boba Analysis Suite is an analytical indicator for MetaTrader 5. It brings market structure, relevant price zones and broader market context together in a single chart view. Developed through practical experience as a trader and trading coach, it supports a structured analysis process: assessing market direction, identifying important levels and considering multiple timeframes together. Analysis in Context Individual signals gain meaning through context. Boba Analysis Suite h
Welcome to Entry In The Zone & SMC Multi Timeframe —  COMPLETE SMC ANALYSIS SYSTEM — ALL IN ONE INDICATOR Entry In The Zone & SMC Multi Timeframe  An indicator designed for market analysis based on Smart Money Concepts (SMC), displaying Market Structure, Key Zones (Order Blocks, Supply & Demand Zones, and Fair Value Gaps), Liquidity, and real-time BUY / SELL signals. It supports both Single-Timeframe and Multi-Timeframe analysis, along with the Confluence at Zone feature, which helps you evaluat
FX Power MT5 NG
Daniel Stein
5 (33)
FX Power: Analyze Currency Strength for Smarter Trading Decisions Overview FX Power is your go-to tool for understanding the real strength of currencies and Gold in any market condition. By identifying strong currencies to buy and weak ones to sell, FX Power simplifies trading decisions and uncovers high-probability opportunities. Whether you’re looking to follow trends or anticipate reversals using extreme delta values, this tool adapts seamlessly to your trading style. Don’t just trade—trade
M1 Sniper MT5
Oleg Rodin
5 (7)
M1 SNIPER  is an easy to use trading indicator system. It is an arrow indicator which is designed for M1 time frame. The indicator can be used as a standalone system for scalping on M1 time frame and it can be used as a part of your existing trading system. Though this trading system was designed specifically for short-term trading, it still can be helpful for all traders. This trading system can be used with any forex pair and time frame, though lower time frames are recommended from M1 up to M
FiboSniper Pro
Van Minh Nguyen
5 (4)
FiboSniper Pro - Multi-Filter Fibonacci System with Auto SL/TP and Control Panel FiboSniper Pro is a technical indicator that combines dynamic Fibonacci Envelopes with multiple confirmation filters to generate selective Buy and Sell signals. Fibonacci levels are calculated from Moving Average and ATR, then filtered by ADX, EMA, RSI, ATR, Volume, Time and Candle structure. The indicator displays automatic ATR-based Stop Loss and Take Profit levels directly on the chart, along with an interactive
Auto Optimized SpeedAngle is an institutional-grade momentum vectoring system that eliminates curve-fitting through continuous Walk-Forward Optimization (WFO). Rather than relying on static inputs that degrade when market regimes shift, the indicator dynamically recalibrates its parameters using Out-of-Sample (OOS) validation, ensuring the displayed signals represent genuine statistical edges rather than historical anomalies. By shifting the focus from subjective visual angles to normalized, qua
SQN Max indicator for MT5 by ITC
Renaud Herve Francois Candel
Sqn Max Indicator Sqn Max is an exclusive indicator to trade the market with high effectiveness. The indicator is based on price action, volatility and trend. This indicator is as simple as possible but not too simple. The indicator can generate alerts to ease the trading process. You don't have to stay all day in front of your screen. The indicator can be used with any class of assets and with any time frame. It is possible to achieve better results trading our list of selected assets. We achi
Smc Pro ToolKit
Talal N Z Aljarusha
5 (14)
SMC PRO TOOLKIT — SMART MONEY ANALYSIS & STRUCTURED TRADE PLANNING SMC Pro ToolKit is a professional Smart Money Concepts analysis workspace for MetaTrader 5. It combines market structure, multi-timeframe analysis, institutional price zones, setup evaluation, confirmation tools, volume context, alerts, and risk planning inside one organized chart environment. One workspace. Multiple layers of confirmation. One structured trading plan. OPEN COMPLETE USER GUIDE MULTI-CONDITION SETUP ENGINE At
SIO Oscillator: Self-Optimizing Semivariance Imbalance Oscillator Buy the indicator and get the Expert Advisor based on it for FREE. Most oscillators treat all price movement the same. SIO separates upside and downside market pressure and measures the imbalance between them, showing which side is really in control: buyers or sellers. When the imbalance reaches an extreme, SIO prints a clear signal with entry, Stop Loss and Take Profit levels. What makes SIO different is that it doesn’t rely on f
Power Candles MT5
Daniel Stein
4.58 (12)
Power Candles - Self-Optimizing Strength Indicator Strength usually lives in a sub-window. The line runs below, the candle above, and your eye keeps connecting the two. Power Candles puts the strength into the candle itself, colored from dark red to dark green, so the chart reads at a glance and the sub-window stays closed. The indicator also finds its own settings for the symbol and timeframe in front of you. One click on [ Apply Best ] draws entry, Stop Loss and Take Profit at the exact prices
Atomic Analyst MT5
Issam Kassas
4.51 (65)
Atomic Analyst — MetaTrader 5 Message me on MQL5 after purchase to receive Smart Universal Expert Advisor for FREE, plus the online course, PDF manual, and private group access. Atomic Analyst brings price action, trend direction, entry and exit signals, Stop Loss and multiple Take Profit levels together on your chart. SEE THE SIGNAL. UNDERSTAND THE SETUP. Atomic Analyst organizes its analysis into clear visual information: • Buy and sell arrows to identify potential entries. • Stop Loss and mul
Unix Scalper
Issam Kassas
4 (4)
Unix Scalper — MetaTrader 5 Message me on MQL5 after purchase to receive Smart Universal Expert Advisor for FREE, plus the online course, PDF manual, and private group access. Find the setup. See the plan. Choose how to trade it. UNIX Scalper brings market analysis, BUY/SELL/WAIT decisions and Entry, Stop Loss, TP1 and TP2 levels into one organized panel. SEE THE SIGNAL AND THE PLAN • Clear decisions: BUY, SELL or WAIT. • Defined levels: Entry, Stop Loss, TP1 and TP2. • Multi-timeframe overvie
Tokyo mt5 Indicator
Vasiliy Strukov
5 (15)
Tokyo Indicator provides a clear visual overview of trend direction, potential trading signals, and market conditions. Its colour-coded, stepped trend line distinguishes bullish phases in blue from bearish phases in magenta. Matching directional arrows highlight potential buying and selling opportunities when the displayed trend changes. An integrated dashboard brings together the current signal, market bias, momentum, volatility, and signal quality in one convenient view. This allows traders t
Astral Structure
Ottaviano De Cicco
Astral Structure Assess the setup. See the initial plan. Launch Special - $99. $149 after launch. A structure setup raises several questions at once: does the wider view agree, where is the stop reference, and how are targets defined? Astral Structure brings those questions into one workspace for discretionary traders who build their decisions around market structure. Focus on the relevant setup. Review the latest eligible setup, its direction and qualification together. See the wider agreement.
Crystal Heikin Ashi Signals
Muhammad Jawad Shabir
5 (5)
Crystal Heikin Ashi Signals—Professional Trend & Signal Detection Indicator Advanced Heikin Ashi Visualization with Intelligent Signal System for Manual & Automated Trading Final Price: $149 ---------> Price goes up $10 after every 10 sales . Limited slots available — act fast . Overview User Guide PDF Crystal Heikin Ashi Signals is a professional-grade MetaTrader 5 indicator that combines pure Heikin Ashi candle visualization with an advanced momentum-shift detection system. Designed for both m
Trend Catcher ind mt5
Ramil Minniakhmetov
5 (18)
TREND CATCHER INDICATOR Trend Catcher Indicator analyzes market price movements, using a combination of the author’s proprietary and customized adaptive trend-analysis indicators.  It identifies the true market direction by filtering out short-term noise and focusing on underlying momentum strength, volatility expansion, and price structure behavior.  It also uses a combination of smoothing and trend-filtering customized indicators such as moving averages, RSI, and volatility filters.   Real ope
Multi Currency Strength and Momentum Indicator MT5 Dynamic Forex28 Navigator is the evolution of our long-time, popular indicators, combining the power of five in one: Advanced Currency Strength28 Indicator (700 reviews) Advanced Currency IMPULSE with ALERT (530 reviews) Currency Strength EXOTICS GOLD Impulse with Alert CS28 Combo Signals (recent Bonus) No need to buy four indicators and stack them on your charts. All of it is merged into one powerful indicator: the strength of the 28 Forex pair
Scalper Vault is a powerful, fully-equipped trading system designed for traders who want to achieve consistency in intraday trading . This high-precision indicator serves as a complete, standalone trading system that delivers institutional-grade analysis for both Forex and Binary Options traders. PLEASE CONTACT ME AFTER PURCHASE TO GET MY TRADING TIPS PLUS A GREAT BONUS! By eliminating the guesswork and complex manual analysis, Scalper Vault allows you to focus purely on execution using easy to
The same chart, read in the same order, every day. Structure, the nearest zone, where you sit in the range and which way the trend points — on screen at once, always in the same form. BUYER BONUS — SMC Nexus Scanner Pro. A multi-symbol scanner built on this indicator's data: one panel shows the trend side, active order blocks and BOS / CHoCH for many symbols at once. It comes at no extra cost — after your purchase, message me on MQL5 and I will send it. Fifteen layers under one panel: market st
Azimuth Pro
Ottaviano De Cicco
5 (7)
Azimuth Pro V2: Synthetic Fractal Structure and Confirmed Entries for MT5 Overview Azimuth Pro is a multi-level swing structure indicator by Merkava Labs . Four nested swing layers, swing-anchored VWAP, ABC pattern detection, three-timeframe structural filtering, and closed-bar confirmed entries — one chart, one workflow from micro-swings to macro-cycles. This is not a blind signal product. It is a structure-first workflow for traders who care about location, context, and timing. Halloween P
More from author
Elliott Wave Auto Count for MetaTrader 4 labels Elliott waves automatically on four degrees at the same time: the base degree and the three degrees above it. It follows the rules and guidelines of "Elliott Wave Principle" (Frost & Prechter), and for the current wave it shows a price x time target zone and an invalidation level. It is meant for MT4 traders who use Elliott wave analysis and want a rule-based starting count, with the alternate count and the invalidation level always visible. It is
Fibo Price Time Zones combines Fibonacci price levels with Fibonacci time targets and draws them on the chart as boxes (price x time zones). Where boxes from several waves and from up to two higher timeframes overlap, the area is emphasized in three levels. It is meant for traders who already use Fibonacci retracements and extensions and also want to see roughly when a level is worth watching, without drawing every tool by hand. It is a display tool only: it gives no buy or sell signals and doe
Supply & Demand Zones marks supply and demand zones on a MetaTrader 5 chart with one fixed, fully published rule: a strong bar (body at least X times ATR) that leaves a short "base" of small-body bars behind it. The base becomes a demand zone when the strong bar is bullish and closes above it, or a supply zone when the strong bar is bearish and closes below it. Each zone shows its state: fresh, touched with a count, or broken. It is meant for traders who draw these zones by hand and want them d
FREE
RSI AutoScale is a clean, lightweight RSI for traders who use both TradingView and MetaTrader 5 and want the two charts to look the same. WHAT IT SHOWS - RSI (Wilder smoothing): the same values as the standard RSI, with any applied price. - Signal line on the RSI: SMA, EMA, SMMA or LWMA, with its own period. - Levels: upper, middle and lower lines (70 / 50 / 30 by default). They use MT5's native levels, so they reach the right edge and their values appear on the scale. - Zone fills: the middle
FREE
Stoch RSI Band Fill is a Stochastic RSI indicator for MetaTrader 5. MT5 does not include a built-in Stoch RSI, so this indicator adds one. It follows the same calculation steps as the built-in Stoch RSI on TradingView and uses the same layout: K and D lines, 80 / 50 / 20 levels and a shaded band between the upper and lower levels. CALCULATION, STEP BY STEP 1. RSI of the selected price (default: close, length 14), smoothed with Wilder's method (RMA). The first average is the simple average of the
FREE
Pivot Points Six Types with Level Alerts is a TV-compatible pivot point indicator for MetaTrader 5. It uses the same formulas and the same period boundaries as the "Pivot Points Standard" indicator that comes with TradingView, and it draws the levels the same way: short horizontal lines that start at the first bar of each period, with "R1 (price)" style labels in orange (#FB8C00). SIX CALCULATION TYPES The levels are calculated from the high, low and close of the previous period. - Traditional
FREE
Supertrend Trend Fill with Change Alerts is a TV-compatible Supertrend for MetaTrader 5. It uses the same calculation as the "Supertrend" indicator built into TradingView and draws it the same way: a green line below price in an up trend, a red line above price in a down trend, and a light fill between the line and the middle of each candle body. Supertrend shows the direction of the trend. It is a charting aid, not a buy or sell signal, and it does not predict where price will go. HOW IT IS C
FREE
MACD Four Color Histogram is a MACD for MetaTrader 5 that uses the same formula and the same look as the built-in MACD on TradingView. It is made for traders who use both platforms and want the MACD on each chart to read the same way. HOW IT DIFFERS FROM THE MT5 STANDARD MACD - MT5 standard MACD: the histogram is the MACD line itself, and the signal line is an SMA. - This indicator: three parts, as on TradingView. MACD line, signal line, and histogram = MACD - signal. The histogram has 4 colors.
FREE
VWAP Band Fills with Anchored VWAP is a TV-compatible VWAP for MetaTrader 5. It uses the same formula as the built-in "VWAP" indicator of TradingView (Pine ta.vwap), offers the same inputs - anchor period, source, offset, standard deviation or percentage bands #1 to #3 - and draws it the same way: a blue VWAP line, green / olive / teal bands and light fills between them. An optional anchored VWAP starts from a vertical line that you drag to any bar. HOW IT IS CALCULATED For every bar of the cu
FREE
Prior Day Week Month Levels with Touch Alerts draws the previous day, week and month high and low on your MetaTrader 5 chart as clean horizontal lines with labels at the right edge, in the style of TradingView. It can also show the previous day's close and today's open. LEVELS - PDH / PDL: previous day high and low (blue #2962FF, solid) - PWH / PWL: previous week high and low (orange #FF9800, dashed) - PMH / PML: previous month high and low (purple #9C27B0, dash-dot) - PDC: previous day close (
FREE
Candle Countdown Tag with Spread shows how long the current candle has left, in a small colored tag right next to the last candle - the way TradingView shows its bar countdown. The same tag can also show the current spread, the time left of up to two more timeframes and the open time of the next candle. It is a display tool for MetaTrader 5: no alerts, no signals, no trading. WHAT IT SHOWS - Time left of the chart timeframe: mm:ss under one hour, hh:mm:ss under one day, "2d 04:15:30" for longe
FREE
Do you mark supply and demand zones by hand and get a slightly different result every time? This free MetaTrader 4 indicator draws them with one fixed rule that is written out in full below, so you can check every zone yourself. The idea: a strong candle (body at least X times ATR) leaves a "base" of 1 to 10 small candles right before it. A bullish strong candle that closes above the base turns it into a demand zone; a bearish one that closes below it turns it into a supply zone. The indicator
FREE
This is the MetaTrader 4 edition of RSI AutoScale. It draws the standard Wilder RSI with a signal line, a shaded band between the levels, colored areas where the RSI leaves that band, and a choice of three scales. It is meant for traders who use TradingView and MetaTrader 4 side by side and want the RSI pane to look much the same on both. HOW IT LOOKS ON MT4 - RSI line: the same values as MT4's built-in RSI for the same period and applied price. - Signal line: a moving average of the RSI (SMA, E
FREE
Supertrend Trend Fill with Change Alerts MT4 brings a TV-compatible Supertrend to MetaTrader 4. If you also use TradingView, you know its built-in "Supertrend": a green line under price while the trend is up, a red line over price while it is down, and a soft colored band between the line and the candles. This MT4 indicator reproduces that calculation and that look. What it is for: seeing the current trend direction and where it would flip. What it is not: a buy or sell signal or a forecast. A
FREE
A MetaTrader 4 MACD built to read like the MACD you see on TradingView: a MACD line, a signal line, and a histogram of the gap between them, colored in four shades. If you switch between the two platforms during the day, the MACD pane on your MT4 chart will look and behave the way you are used to. WHY NOT THE MT4 BUILT-IN MACD? MT4's own MACD draws the MACD line as gray bars and smooths the signal line with an SMA. There is no separate histogram and no color change. This indicator calculates the
FREE
MetaTrader 4 ships with a Stochastic and an RSI, but not with a Stochastic RSI. This indicator fills that gap for MT4 users and is built to be TV-compatible: it follows the calculation of the Stoch RSI that comes with TradingView, and the pane looks the way TradingView users expect - a blue K line, an orange D line, dashed 80 and 20 levels, a dotted 50 line and a light band between 80 and 20. WHAT APPEARS IN THE SUBWINDOW - K and D lines. The Data Window lists only K and D. - Upper band (80) a
FREE
Pivot Points Six Types with Level Alerts MT4 brings TV-compatible pivot points to MetaTrader 4. If you also chart on TradingView, you know its built-in "Pivot Points Standard". This MT4 indicator reproduces it: the same six calculation methods, the same period choices from one day to ten years, and the same look - an orange (#FB8C00) line for each level, starting at the beginning of each period, labelled like "S2 (1.08345)". WHICH LEVELS EACH METHOD GIVES Method | Levels drawn | Note Tradition
FREE
Prior Day Week Month Levels with Touch Alerts MT4 puts yesterday's, last week's and last month's high and low on your MetaTrader 4 chart, drawn the way TradingView users are used to seeing them: thin horizontal lines with a short label and price at the right edge. Optional extras: previous day close and today's open, and an alert when price touches a line. WHAT YOU SEE Line | Meaning | Default look PDH | previous day high | blue #2962FF, solid PDL | previous day low | blue #2962FF, solid PWH |
FREE
VWAP Band Fills with Anchored VWAP MT4 brings the VWAP of TradingView to MetaTrader 4. If you use TradingView's built-in "VWAP", you will find the same inputs here (Anchor Period, Source, Offset, Bands Calculation Mode, Bands Multiplier #1 to #3, Hide VWAP on 1D or Above), the same formula (Pine ta.vwap) and the same colors - plus an anchored VWAP that starts wherever you drag a vertical line. THE FORMULA Within each anchor period, bar by bar: VWAP = sum(source x tick volume) / sum(tick volume
FREE
Candle Countdown Tag with Spread MT4 puts a TradingView-style countdown on your MT4 chart: a small tag beside the last candle that tells you when the bar closes, together with the current spread. Optional extra lines show the time left of two more timeframes and when the next candle opens. Nothing else - it does not trade, alert or give signals. ONE TAG, UP TO FIVE LINES Line | Example | Setting Chart timeframe | 12:41 | on by default Extra timeframe 1 | H4 02:12:41 | off (choose a timeframe t
FREE
Dow Structure MTF shows the Dow theory trend of five timeframes at once in MetaTrader 4, using the pullback low / rally high method that is common among Japanese traders. For each timeframe it shows whether the trend is up, down or range, which price would change it, and how far the current price is from that price. Only closed bars are used, so a confirmed result does not change afterwards (no repaint). It is meant for traders who check the trend structure of several timeframes by hand and wan
Fibo Price Time Zones for MetaTrader 4 combines Fibonacci price levels with Fibonacci time targets and draws them on the chart as boxes (price x time zones). Where boxes from several waves and from up to two higher timeframes overlap, the area is emphasized in three levels. It is meant for MT4 traders who already use Fibonacci retracements and extensions and also want to see roughly when a level is worth watching. It is a display tool only: it gives no buy or sell signals and does not place ord
Time Average Lines draws four averages measured by time, not by the number of bars, so each line keeps the same length of time when you switch timeframes: a time moving average, a TWAP, a same-time-of-day average and a time-based EMA. For the same-time average, the rest of today is shown as a dotted path that joins the past averages; the path is a summary of the past, not a forecast. It is meant for intraday traders who want averages that mean the same thing on M1 and on M15, and who want to co
Auto Trendline Channel MTF draws trendlines, parallel channels and horizontal support / resistance automatically from confirmed swing highs and lows in MetaTrader 4, and records for each line the touch count, close breaks, wick breaks and retests. A table shows, for the chart timeframe and two higher timeframes, the nearest line above and below the price, the distance to it and the Dow theory direction. It is meant for traders who draw trendlines and levels by hand and want them drawn by fixed,
Currency Strength Meter for MetaTrader 4 combines the 28 pairs of the 8 major currencies (USD, EUR, JPY, GBP, AUD, NZD, CAD, CHF) into one strength line per currency, with a ranking table for the chart timeframe, M15, H1, H4 and D1. The full formula is published below. It is meant for MT4 traders who compare currencies before choosing which pair to look at, and who want to know exactly how the numbers are made. It is an analysis aid: it does not tell you when to buy or sell and does not show fu
Trade History Stats Panel for MetaTrader 4 reads the closed trades in your own account history and sums them up in a panel on the chart: number of trades, win rate, profit factor, average P/L per trade, drawdown of the closed-trade curve, holding time, buy / sell, and tables by month, symbol, weekday and hour. It is meant for traders who want to look back at their own past trades, like a trading journal that fills itself in, and to check the numbers by period, symbol or magic number. It never p
Prop Challenge Loss Tracker for MetaTrader 4 shows, in a panel on the chart, how much room is left before the daily loss limit and the maximum loss limit of a funded-account (prop) challenge are reached, and sends staged alerts as the limits are used up. It is meant for traders taking a prop challenge who want to see their remaining loss room at a glance, set to the rules of their own program. It is a display and alert tool only: it never opens, modifies or closes any order. Whether a limit is
Market Structure Liquidity Map for MetaTrader 4 draws smart money concepts (SMC) style market structure on the chart: swing labels, break of structure (BOS), change of character (CHoCH), equal highs and lows, previous day and week levels, liquidity sweeps and unfilled fair value gaps (FVG), with a small table for the chart timeframe and two higher timeframes. It is meant for MT4 traders who read structure and liquidity by hand and want the same levels drawn the same way every time. It is a disp
Divergence Detector for MetaTrader 4 finds regular and hidden divergences between price swings and one oscillator of your choice (RSI, MACD histogram, Stochastic %K, OBV, CCI or Momentum) and draws them on the price chart and in the indicator window, with a small table for four other timeframes. It is meant for MT4 traders who look for divergences by eye and want them found by fixed, visible rules on closed bars. It is a display tool only: it gives no buy or sell signals and does not place orde
Multi Symbol Market Scanner Panel shows up to 30 symbols in one table on your MT4 chart: trend direction, RSI and ATR% on M15, H1, H4 and D1, plus today's range, distance from yesterday's high or low and a simple H1 / H4 swing structure. Click a symbol name to switch the chart to it. It is meant for MT4 traders who watch many forex pairs, metals or indices and want one overview instead of opening many charts. It is a display tool only: it gives no buy or sell signals, does not rank symbols to t
Filter:
No reviews
Reply to review