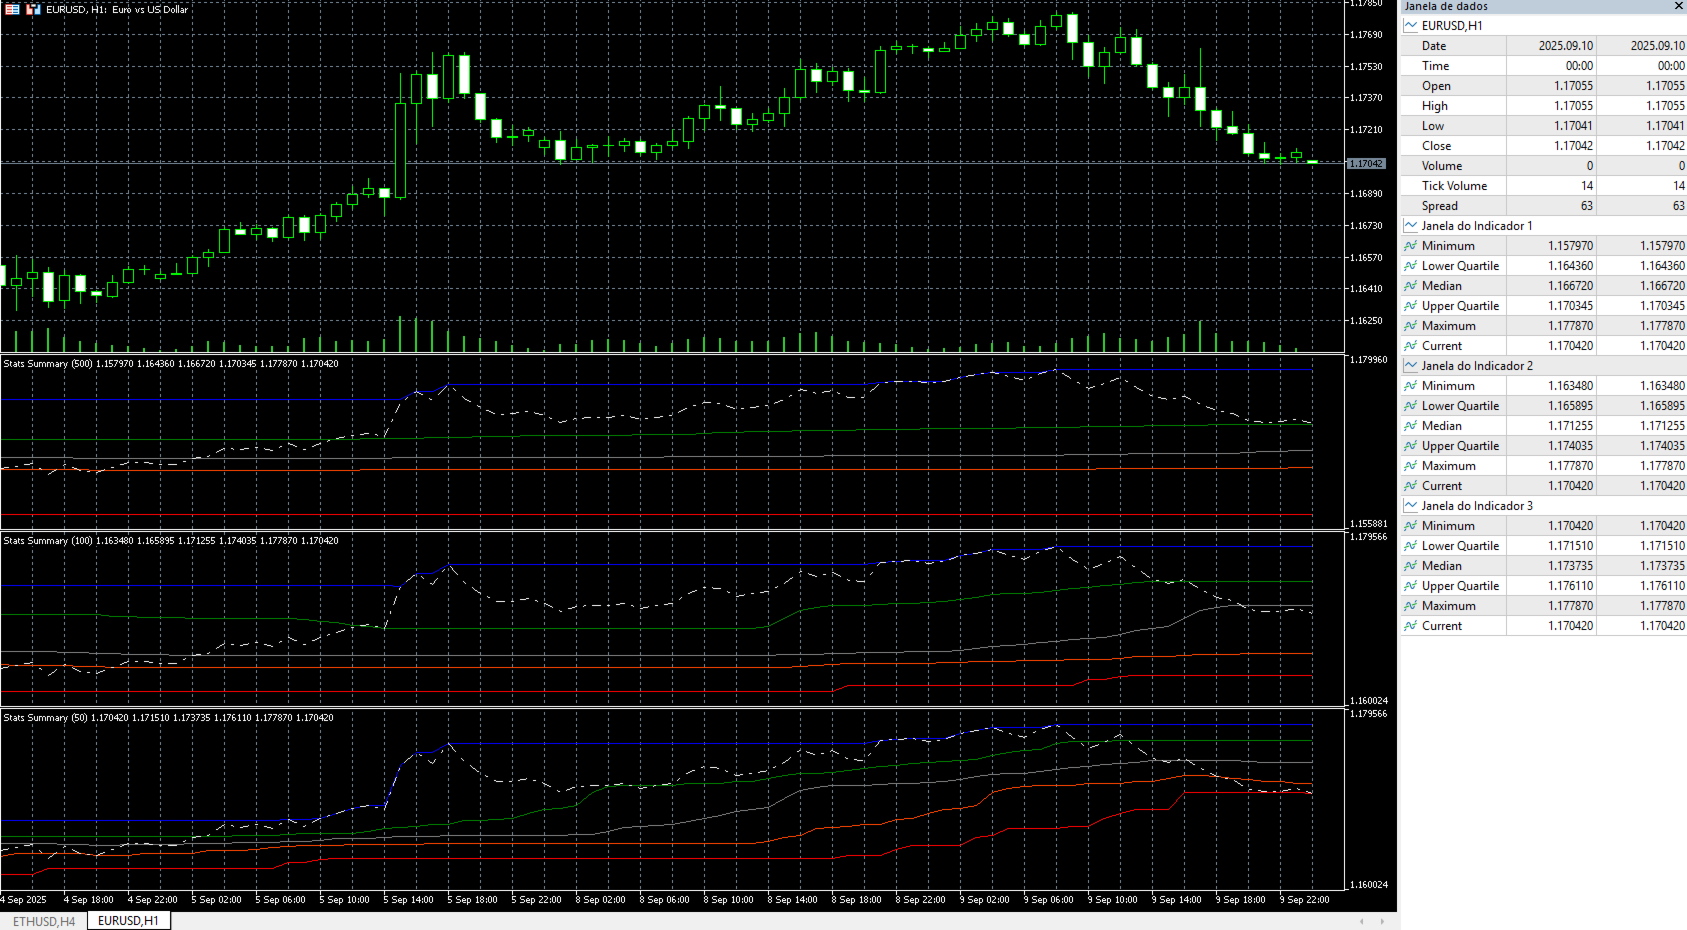
Stats Summary
- Indicators
- Elidio Xavier Guimaraes
- Version: 1.0
- Activations: 20
Enhance Your Technical Analysis with Stats Summary.
The Stats Summary is a robust analytical tool developed for MetaTrader 5 (MT5), providing a detailed statistical overview of price behavior. Unlike traditional indicators, it uses descriptive statistics to map the distribution of prices over a customizable sample period.
By defining the sample size, the indicator calculates and displays the following values on the chart:
-
Minimum and Maximum (Min/Max): The complete price range of the selected interval, showing the extremes reached.
-
Median (Q2): The value that divides the data set into two equal halves, representing the central point of the price movement.
-
First Quartile (Q1): The value that marks the 25th percentile, indicating the point below which 25% of the prices were traded.
-
Third Quartile (Q3): The value that marks the 75th percentile, indicating the point below which 75% of the prices were traded.
These quartiles are particularly useful for identifying the "value zone," where the majority of trading activity occurred, and can serve as strong support and resistance levels. Stats Summary is a powerful tool for traders seeking a quantitative and data-driven approach to market analysis.