Histogram Volume Custom
- Indicators
-
Oleksandr Sheyko
 I have been actively trading the markets since 2017. I help people understand trading better and create custom indicators and strategies that bring clarity and results.
 - Version: 1.0
- Activations: 5
An advanced indicator for precise and clear volume analysis.
What It Does
-
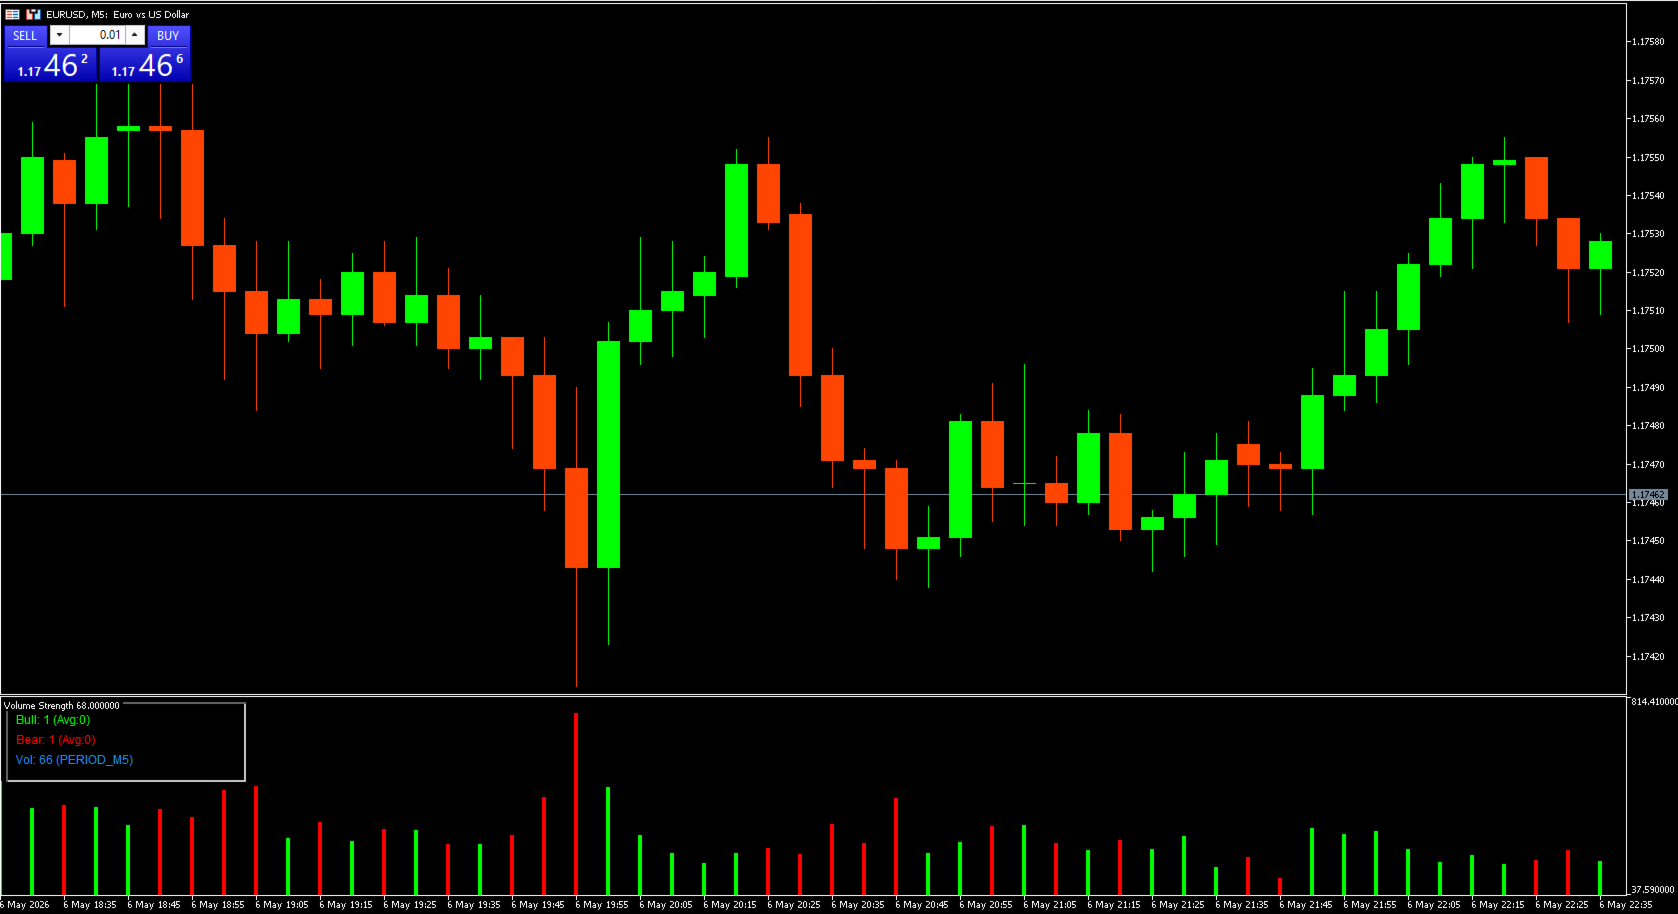
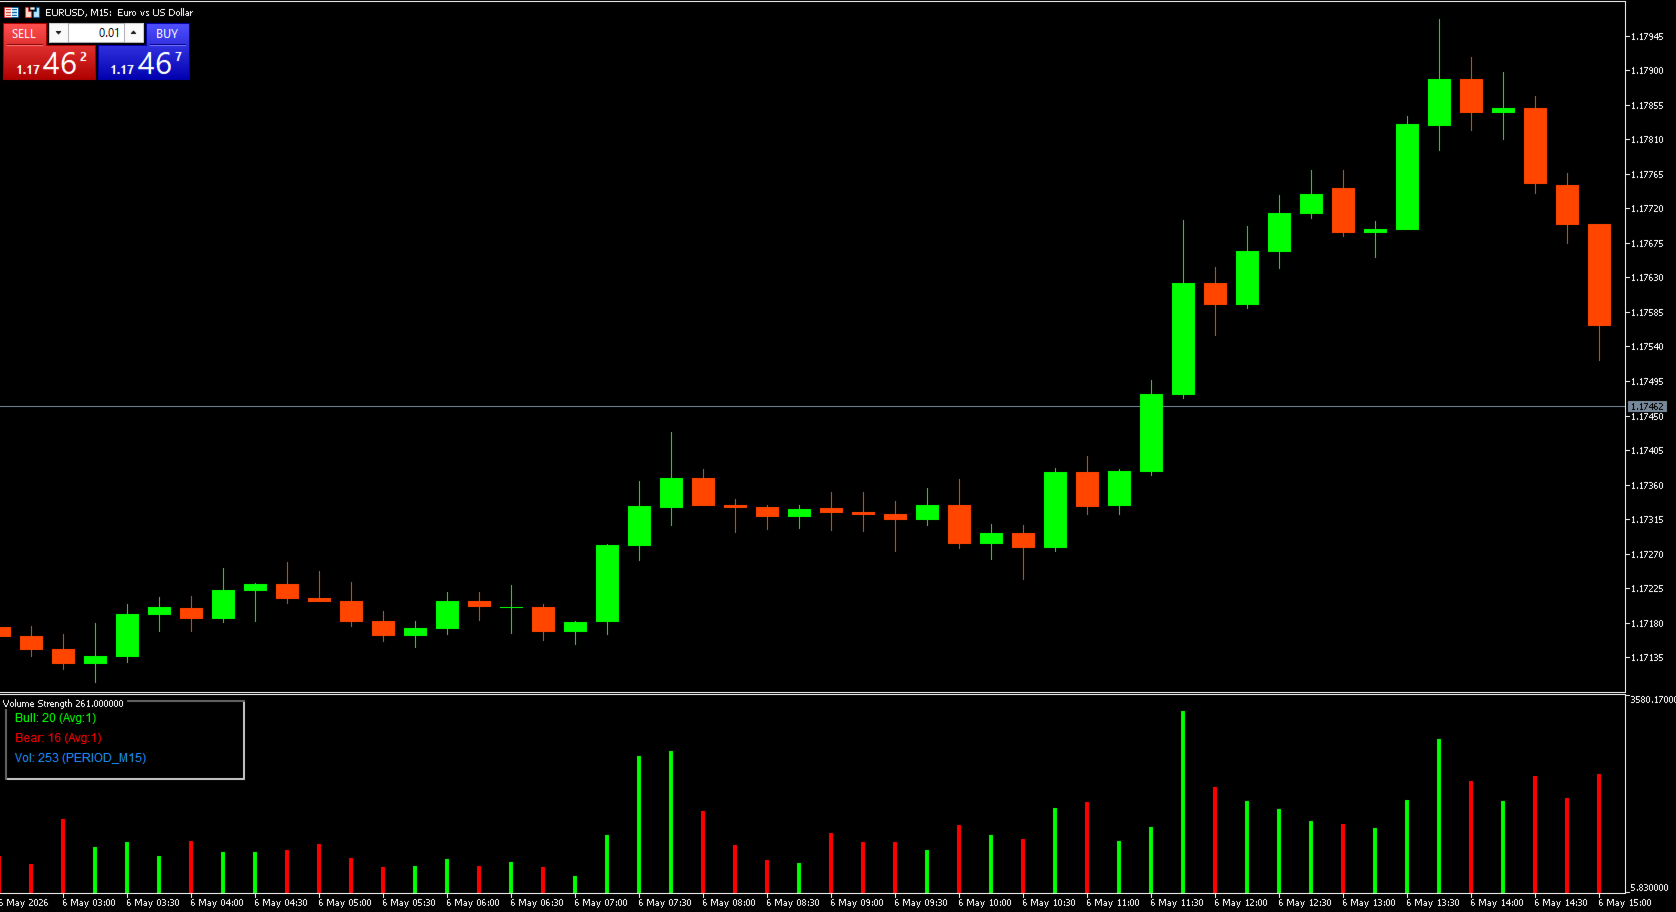
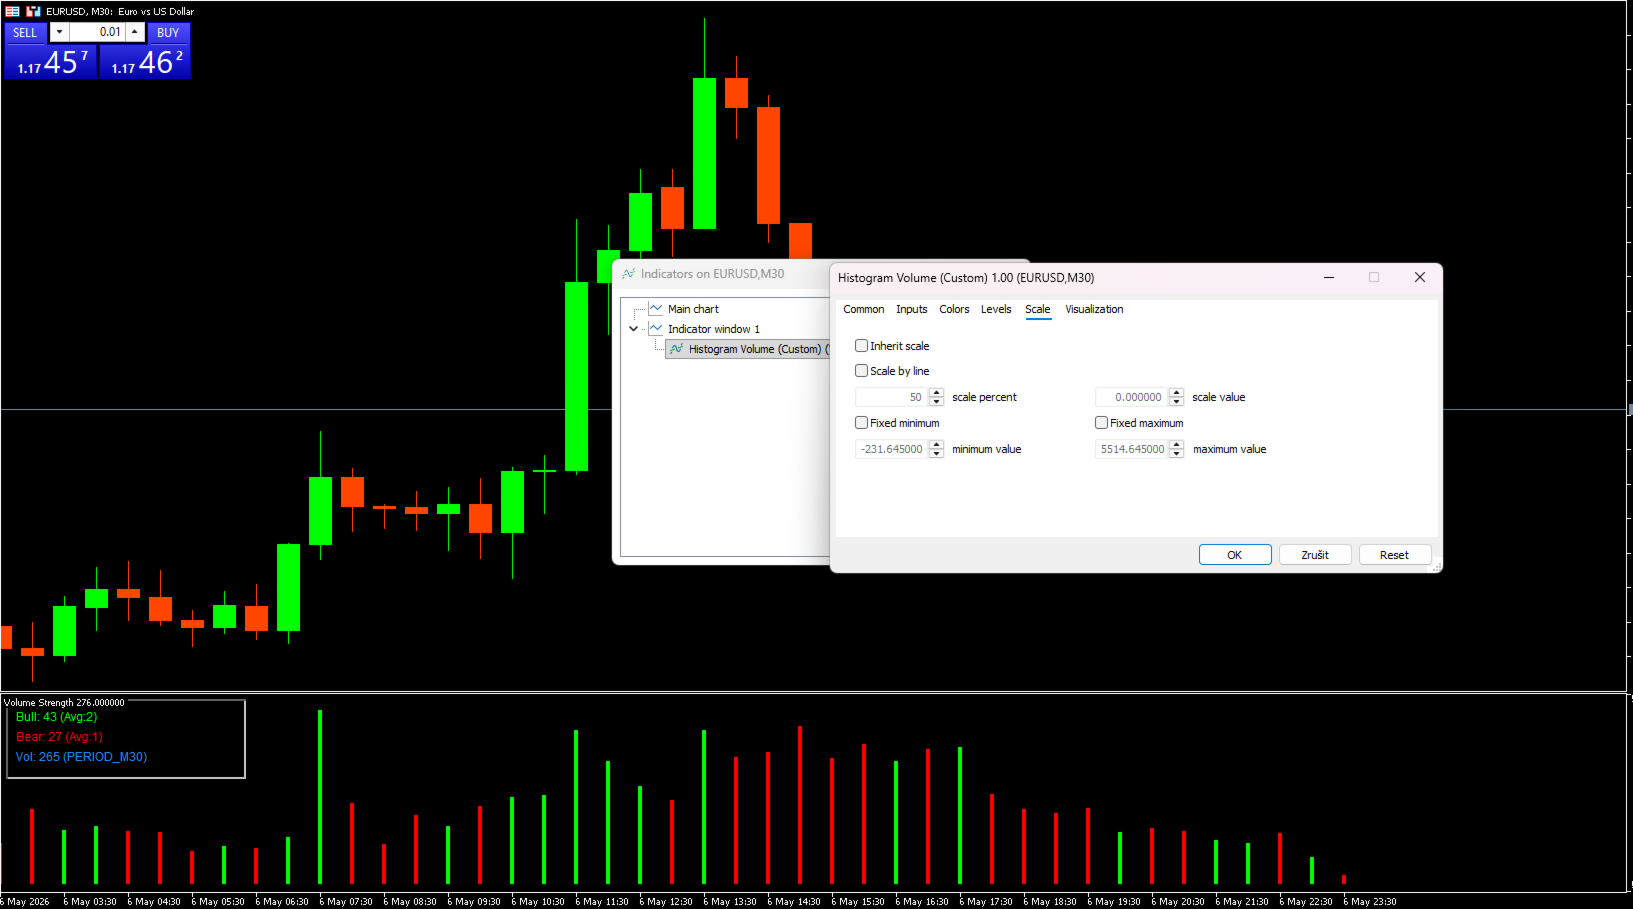
Displays bull/bear pressure based on current market activity
-
Shows real trading volumes in real time
-
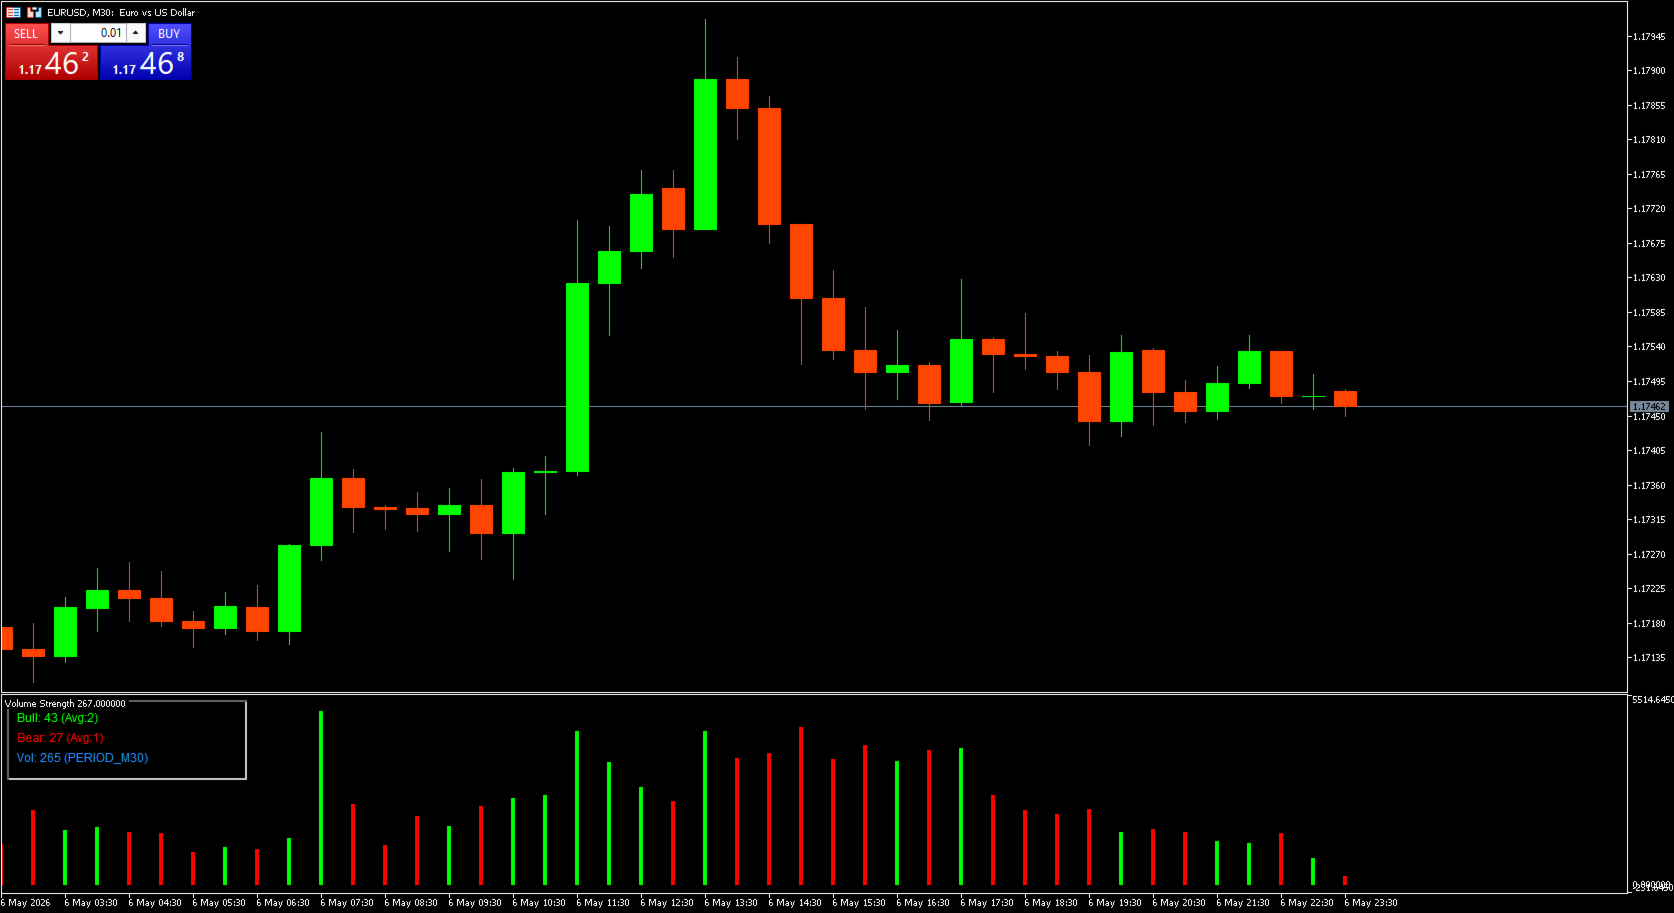
Creates a color‑coded histogram visualizing buyer and seller strength
-
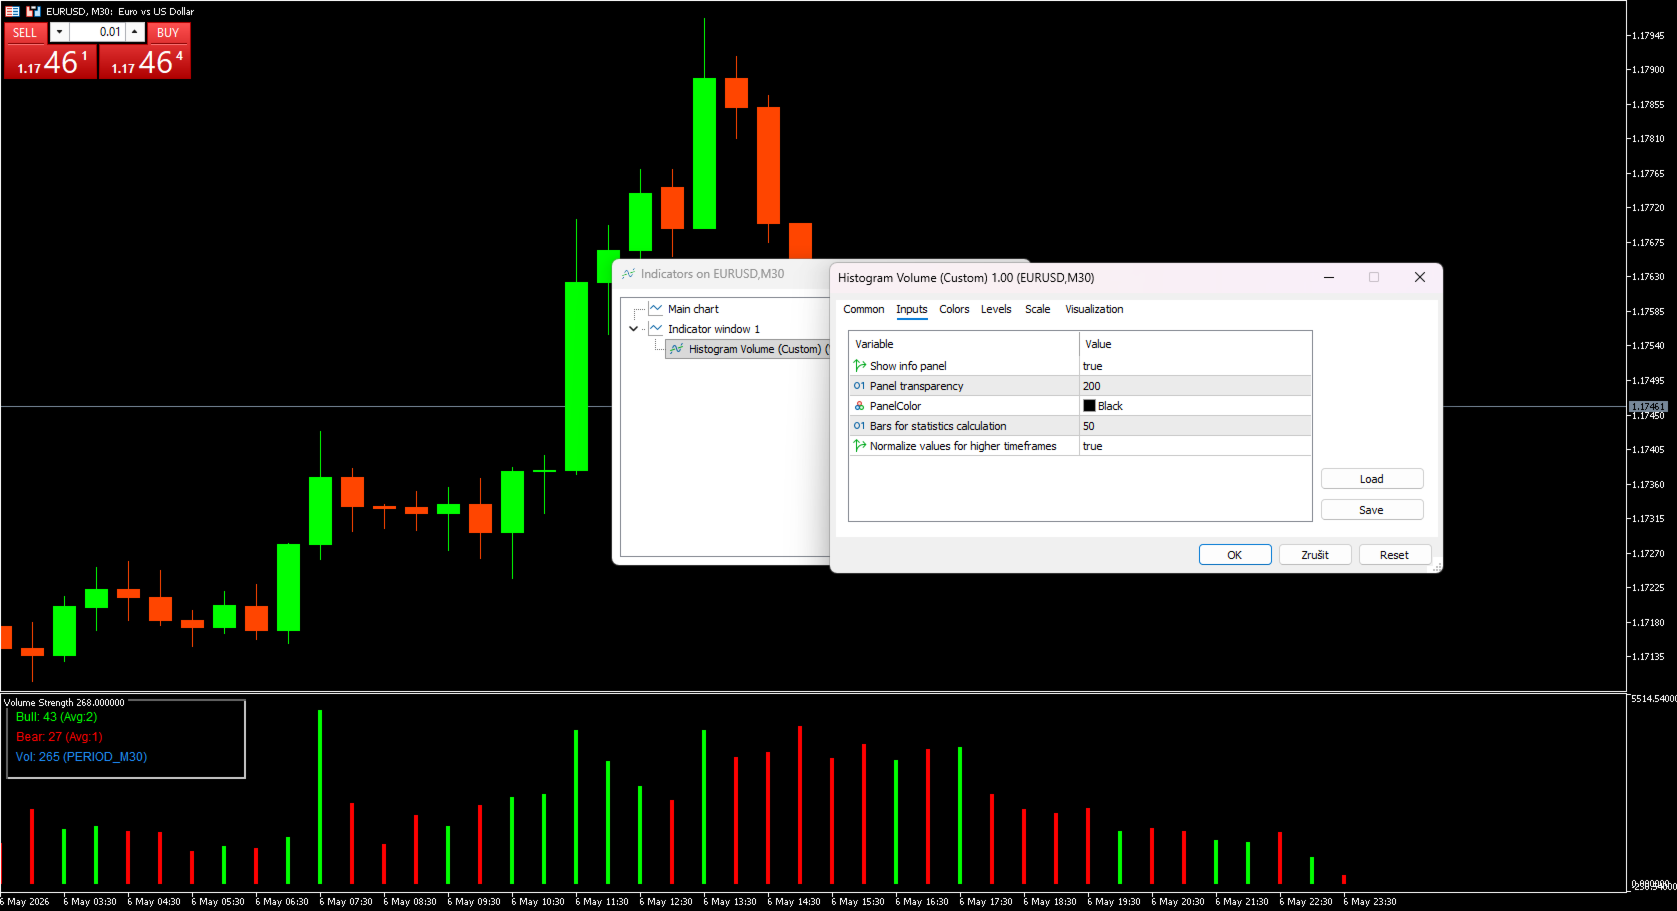
Tracks average volume and deviations over the last X candles
-
Normalizes values across timeframes — works seamlessly from M1 to MN1
-
Includes a live panel with key volume statistics
Why It’s Useful
-
Instantly reveals which side of the market dominates
-
Detects unusual increases in volume and trading activity
-
Helps distinguish strong price moves from weak ones
-
Works on all markets and timeframes
-
No repaint — stable and reliable values
Who It’s For
-
Intraday and swing traders
-
Anyone who wants to integrate volume analysis into their trading system
-
Traders who need fast, visual interpretation of market activity
Summary
Histogram Volume (Custom) delivers a clean and accurate view of current volume strength, its evolution over time, and which side of the market is in control.