
Ergosphere
- Indicators
- Konstantin Chechnev
- Version: 1.1
- Updated: 6 November 2026
ERGOSPHERE is an analytical indicator for MetaTrader 5 featuring built-in artificial intelligence (AI). It combines neural network analysis of tick data with a proprietary algorithmic model of market structure to generate BUY and SELL signals.
The primary neural network contains over 10 million parameters. An additional AI model evaluates signals proposed by the primary model using market context and may reject certain candidates.
The primary development and reference testing configuration is EURUSD M15 with default settings.
AI analysis is also technically available on other M15 currency pairs, including symbols with broker-specific suffixes. Signal quality may vary between instruments. Before using the indicator on another pair, evaluate its historical performance and the broker's pricing conditions.
All models are embedded directly into the indicator. No separate model files, external applications, DLLs, or cloud computing services are required. Price history is provided by the trading terminal.
How Signals Are Generated
The price structure engine analyzes repeated interactions between price and the centers and boundaries of structural zones. The neural network module analyzes sequences of real ticks and generates its own directional signal candidates. Additional validation and duplicate-signal controls are applied to these candidates.
Standard signals are calculated after a bar closes. The use of tick data does not mean that signals appear within an unfinished candle. AI analysis requires sufficient real-tick history; signals may be unavailable when the required data is missing.
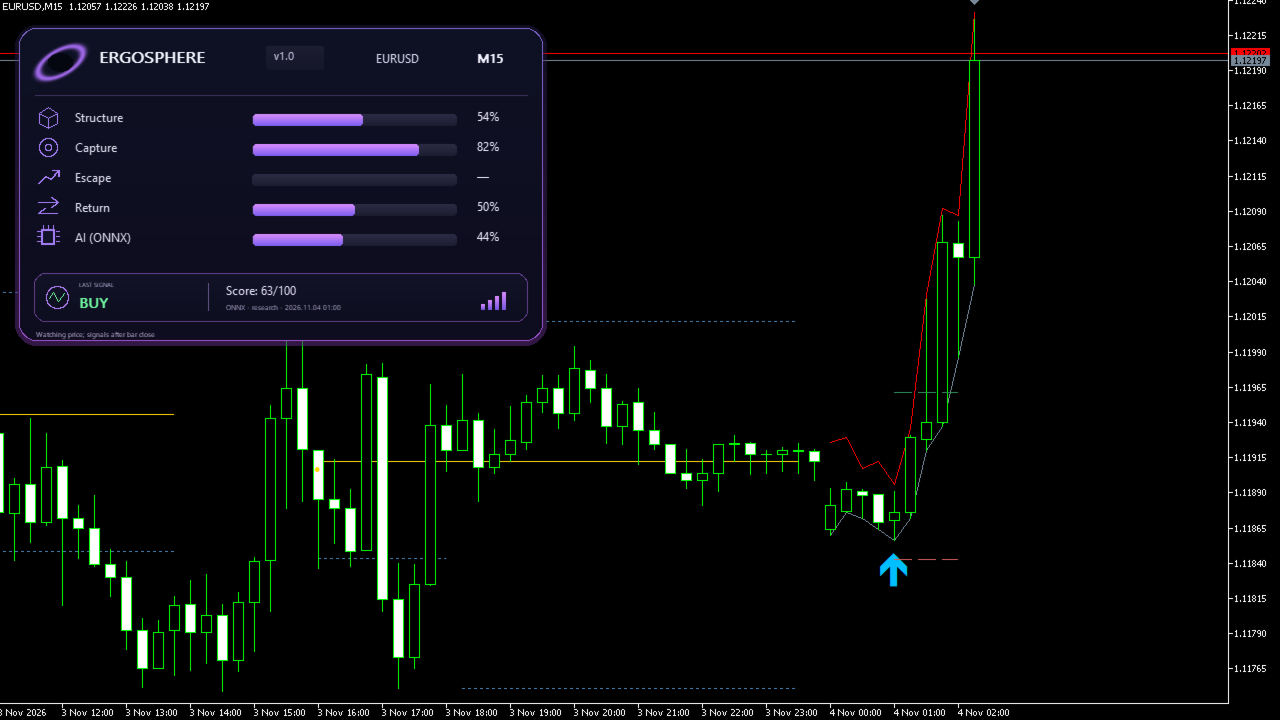
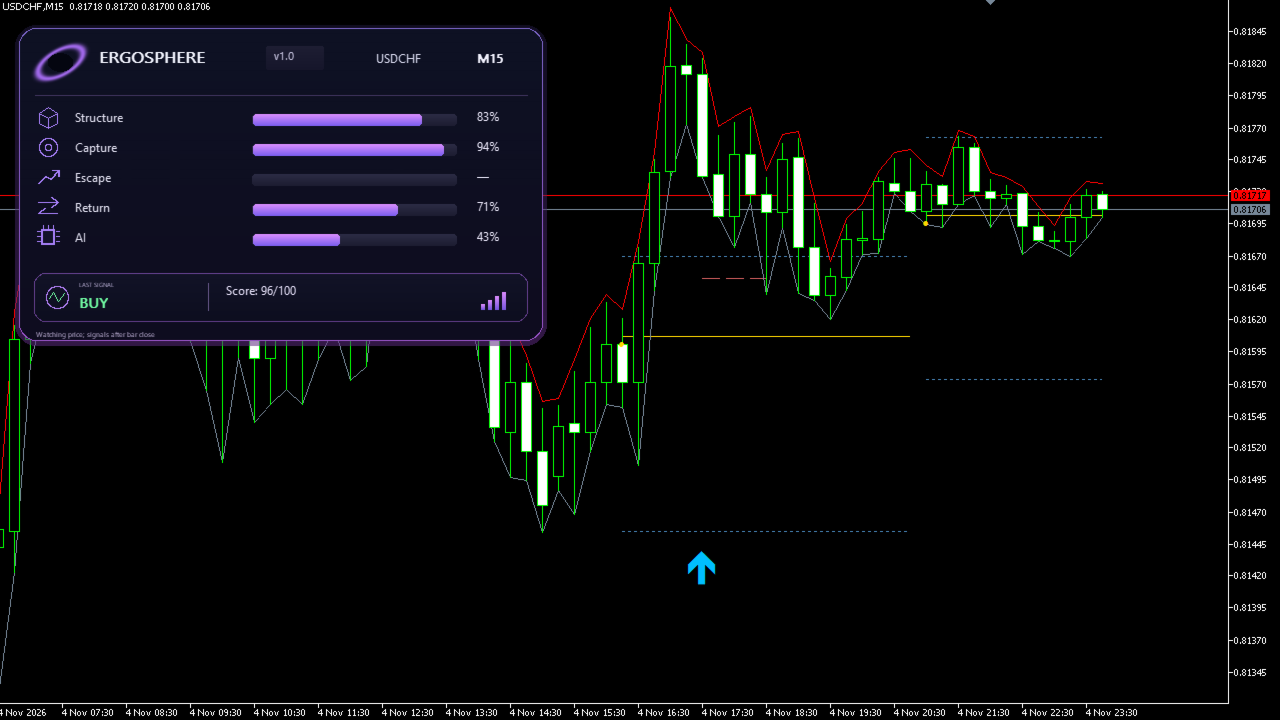
BUY signals are displayed with blue arrows, and SELL signals with red arrows. Arrow placement on the price chart is for visualization and does not represent a confirmed trade execution price.
Key Features
- Price Centers and Structural Zones — identifies areas of repeated price interaction and tracks their development.
- Structural Boundaries — displays the boundaries of selected price zones.
- Escape — identifies confirmed moves beyond structural boundaries according to the indicator's algorithmic conditions.
- Recapture — detects price returning inside a structural zone after moving beyond its boundary.
- Multiple Centers — analyzes several potential price centers and updates their relative significance.
- Higher Timeframe Context — provides additional market structure analysis, using H1 by default. This context is not a mandatory confirmation for every signal.
- AI Analysis — evaluates market direction using tick data and applies an additional neural network check to selected AI signal candidates.
- Duplicate Signal Control — applies directional, time-based, and price-distance restrictions to repeated signals.
- Chart Visualization — displays structural zones, price levels, signal arrows, and calculated SL/TP reference levels.
- Information Panel — shows the status of analytical modules and the most recent accepted signal.
- Notifications — supports popup and mobile push notifications for new price structure engine signals. In the current version, AI arrows do not trigger separate notifications.
- Diagnostics — records compact entries for new signal decisions in the terminal journal.
AI Settings
Enable AI — enables or disables neural network analysis.
AI score (0.50–0.95) — minimum directional score required for an AI signal candidate. This score is not the probability of a profitable trade.
AI picks/day (1–20) — daily limit on AI candidates before additional verification and duplicate-signal filtering. The actual number of displayed arrows may be lower. This limit does not apply to price structure engine signals. Daily boundaries follow the terminal's quote timestamps.
Second AI check — enables or disables additional neural network validation of AI candidates.
Price Structure Settings
Escape signals — enables signals generated when price moves beyond a structural zone.
Return signals — enables signals generated when price returns inside a structural zone.
Min captures (2–6) — minimum number of price returns to a center registered by the algorithm before a zone can be considered eligible. Other zone formation conditions also apply.
Zone ready (30–95%) — minimum algorithmic readiness score required for a structural zone.
Escape score (30–95) — minimum final score required for Escape signals.
Return score (30–95) — minimum score required for Recapture signals.
Signal Control and Display
Same-side gap (0–96 bars) — minimum time interval between accepted signals in the same direction, expressed in chart-timeframe bar durations. Setting this value to 0 disables this particular restriction; other duplicate-signal checks remain active.
Context time frame — selects the timeframe used for additional market structure context. Choose a timeframe higher than the chart timeframe. This setting does not change the fixed internal timeframes used by the additional AI verification model.
Show price zones — shows or hides structural price zone boundaries.
Popup alerts — enables popup notifications for price structure engine signals.
Phone alerts — enables mobile push notifications for price structure engine signals. MetaTrader 5 notifications must be configured. Notifications are not sent in the Strategy Tester.
Feedback and Future Development
You can use the product's Discussion section to ask questions and suggest improvements to settings, visualization, or currency pair priorities.
Possible areas of future development include enhanced neural network analysis, additional customization options, and improved chart visualization.
Development priorities will be determined based on testing results and user feedback. New features will be announced as they are implemented.
Important Information
ERGOSPHERE does not automatically open or close trading positions. Signal arrows and neural network scores are provided for market analysis and do not guarantee forecast accuracy or financial results.
Percentages and scores displayed on the information panel describe the corresponding analytical modules. They do not represent a verified probability of a successful trade.
Calculated Stop Loss and Take Profit levels are informational references, not trading orders. Their display does not confirm trade execution or that the indicated price levels have been reached.








































User didn't leave any comment to the rating