Correlation Impulse 3D MT5
- Indicators
- Konstantin Chechnev
- Version: 1.0
Two instruments, their relationship, and their divergence on one panel. Correlation Impulse 3D for MetaTrader 5 compares two price series on the H1 hourly timeframe and generates signals for the symbol on the current chart.
The decision uses a closed candle, and the arrow appears at the next bar's open. With source history and settings unchanged, subsequent candles do not alter a confirmed signal. The second instrument provides a comparison, not an instruction to open an opposite trade.
Main features
- Built-in profiles. Cover EURUSD/GBPUSD, USDCAD/USDCHF, USDCHF/EURUSD, NZDUSD/AUDUSD, GBPJPY/EURJPY, and XAUUSD/XAGUSD combinations. Automatic selection accounts for broker prefixes and suffixes. Model signals require a supported combination of chart symbol, comparison instrument, and H1 timeframe.
- Data synchronization. Bars from both instruments are matched by exact timestamp. A signal is not confirmed if the required history is unavailable or bar times do not match.
- Divergence analysis. Separate BUY and SELL models consider both instruments' momentum, relative displacement, volatility, trading session, and similarity to completed market episodes.
- Signal selection. Checks correlation and the model assessment. A pause between confirmations, a daily cap, and a single-active-episode rule also apply.
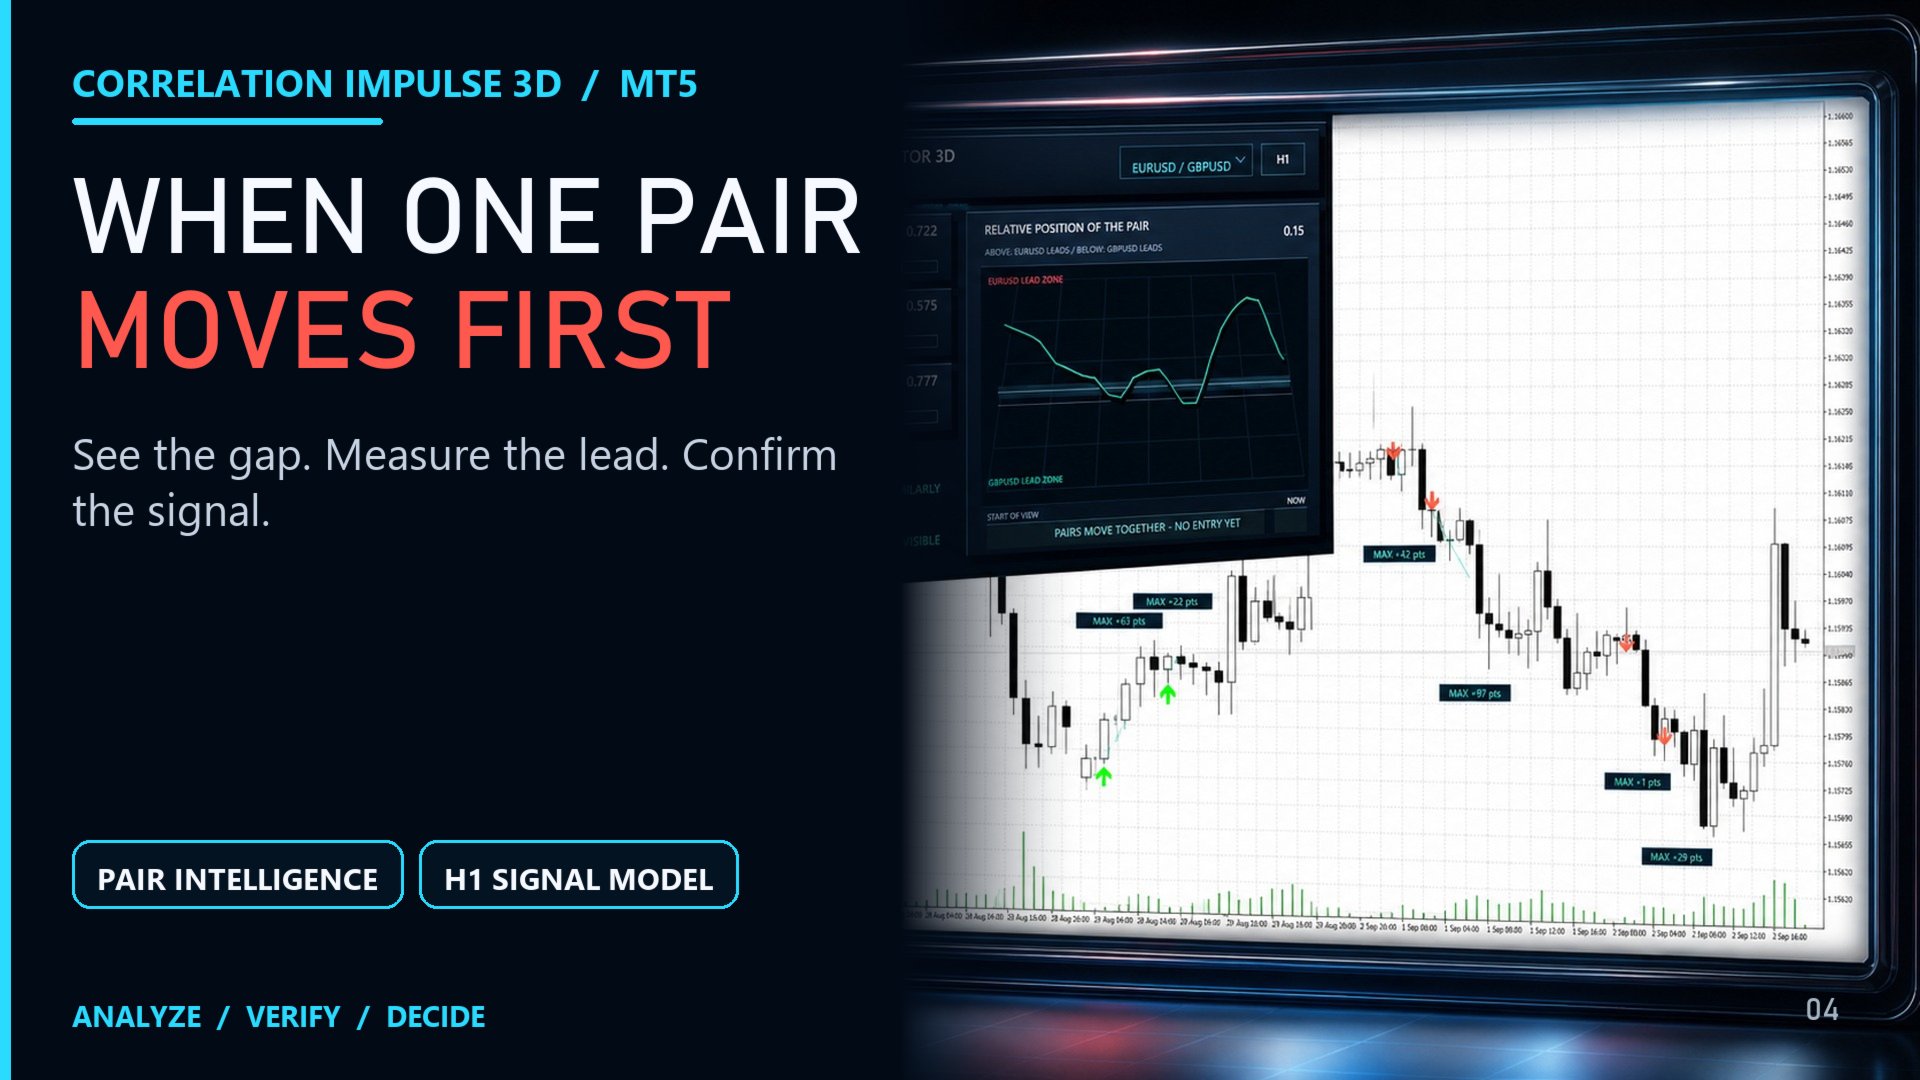
- Three-dimensional panel. Displays correlation, divergence magnitude, the beta coefficient, a trajectory of calculated values, and BUY/SELL estimates. Hovering reveals details, time remaining, and historical data status.
The model estimates relate to a 50-point movement within 24 H1 bars. This is a classification condition, not a ready-to-use Take Profit or a profit calculation. A confirmed episode is tracked until divergence contracts, correlation weakens, or the configured time limit expires.
An optional path displays the maximum observed movement in the signal's direction. The MAX marker refers to an extreme already reached, not an exit price known in advance or the result of an executed trade. Updating this path does not mean the original arrow has changed.
Usage and limitations
For testing, use the visual Strategy Tester on H1 with the "Every tick based on real ticks" modeling mode. Select a supported profile and wait for both instruments' histories to be ready. Observe the full sequence: confirmation at a new bar's open, the episode's development, and its completion.
Correlation Impulse 3D is an indicator, not an Expert Advisor. It does not open, modify, or close positions or calculate trade volume. BUY or SELL refers only to the current symbol. Correlation does not guarantee that the instruments will subsequently converge, and a model estimate is not the probability of a profitable trade. Signals and historical observations do not guarantee future results. Quotes, spread, history quality and synchronization, instrument specifications, and broker conditions affect calculations; trading and risk decisions remain with the user.
Settings
Instruments and calculation
- Automatic chart/pair profile. Default: true, automatically selecting the profile and comparison instrument for H1 calculations. In manual mode, Second comparison symbol selects the comparison instrument but does not create a trained model for an arbitrary combination.
- Correlation window. Default: 72 bars, range 24 to 500. Recent impulse: 3 bars, range 1 to 24. These set the correlation window and the length of the recent impulse.
- Minimum absolute correlation. Default: 0.00, range 0 to 1. Sets the minimum absolute correlation for selection; raising it excludes states with a weaker relationship.
Signal confirmation
- Minimum entry separation. Default: 0.20, range 0 to 10. In the current version, this sets a diagnostic readiness threshold on the panel and is not used as an arrow filter.
- Minimum signal quality. Default: 0.50, range 0.50 to 0.95. The stricter of the user-defined threshold and the profile's built-in threshold applies.
- Minimum bars between entries. Default: 4 bars, range 4 to 1000. Maximum confirmations per model day: 2, range 1 to 24. These limit confirmation frequency without specifying a required number of signals.
Completion and observation
- Exit contraction: 0.48. Exit correlation: 0.42. Both range from 0 to 1. These set episode completion conditions based on divergence contraction and weakening correlation; they are not trade-closing instructions.
- Maximum signal lifetime. Default: 24 bars, range 1 to 1000. Limits the duration of an active episode.
- Show best-price path. Default: true. Bars without a new peak: 4, range 3 to 5. Maximum result-path lifetime: 24 bars. These settings control additional tracking of price extremes already reached. Show exit markers enables completion markers.
History and interface
- The 0–24 session permits confirmations throughout the day according to the model's time reference. Alerts are disabled by default.
- Maximum bars to analyse: 0 means all available history. Background loading is enabled. Required bars and Loader limit: 1600 bars each.
- Keep signals after tester preserves chart objects after a test. The interface language is selected automatically. Diagnostic logging enables diagnostic messages.
For the first run, keep the correlation window at 72 and the impulse at 3: changing these parameters changes the features used by the built-in models. Then test changes individually on a later historical period that was not used for tuning.