Elder Ray Confluence MT4

Elder Ray Confluence MT4

Six readings, one confluence score, non-repainting closed-candle signals

Elder Ray Confluence builds on Dr. Alexander Elder’s classic Bull Power / Bear Power study. Instead of reading two histograms by eye and guessing whether a move is real, you get six separate readings that are checked against each other. When enough of them agree, you see it as one clear score and one clear arrow.

Non-repainting

  • STRONG BUY / SELL arrows are decided when the candle closes, using closed candles only. Nothing is drawn on the candle that is still forming.
  • Once drawn, arrows and divergence lines never move or disappear. Reloading the chart or switching timeframe shows exactly what you saw live.
  • Divergence lines appear as soon as a swing is confirmed, two candles after it, and connect the two swing points.

Why confluence

One signal on its own is often noise. A setup is more convincing when several different readings point the same way at the same time, and that agreement is what confluence means.

Elder Ray Confluence does that checking for you:

  • It reads six things separately: buyer pressure, seller pressure, the signal-line cross, divergence, trend alignment and momentum.
  • It works out how many of them agree with the current direction, and how strongly.
  • It shows the result as one confluence score, and draws an arrow only when that score is high enough.

What you see

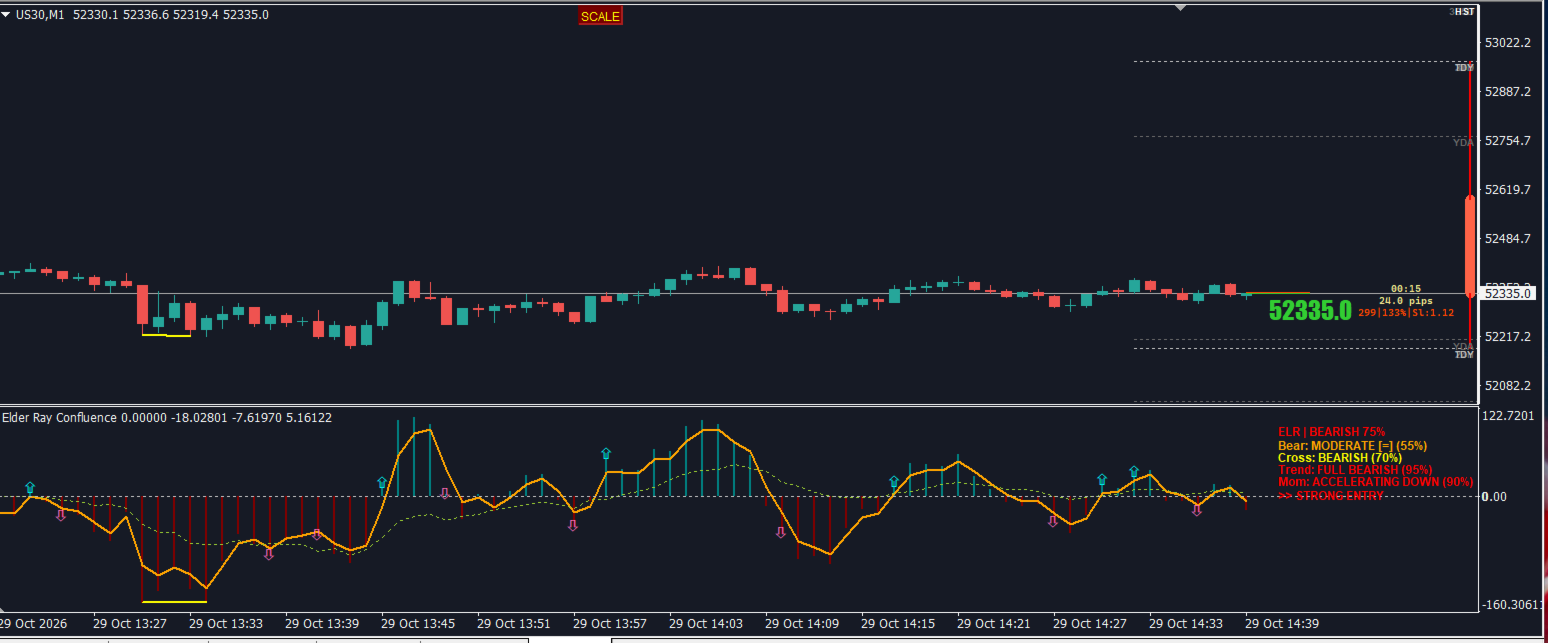
  • Elder Ray histogram: teal above zero, maroon below
  • Fast signal line (orange) and slow trend line (dotted)
  • Divergence lines between confirmed swings, in the indicator window and on the price chart: yellow = bullish, magenta = bearish
  • STRONG BUY (aqua) and STRONG SELL (pink) arrows, one arrow per move instead of a cluster
  • Live confluence panel inside the indicator window

The confluence panel

Six readings, each with a status and a strength percentage:

  • Bull – buyer pressure, with a tag showing whether it is building or fading
  • Bear – seller pressure, with the same tag
  • Cross – the histogram crossing its fast line, rated weak / normal / strong
  • Div – divergence between price and the indicator at confirmed swings
  • Trend – how well histogram, fast line and slow line agree (FULL, partial or MIXED)
  • Mom – momentum rising, falling or accelerating

Pressure tags: [++] strongly building, [+] building, [=] flat, [-] fading, [--] strongly fading.

The top line shows the overall bias (BULLISH / BEARISH) and the confluence score. The bottom line rates the setup, from WAIT FOR CONFIRMATION up to EXCELLENT ENTRY. The panel follows the forming candle live, so you can watch a setup build. Arrows are only placed once the candle has closed.

How the arrows work

  • An arrow is placed when a candle closes with a confluence score at or above the strong signal level (default 75%).
  • No second arrow in the same direction appears until the score has closed below the re-arm level (default 65%). You get one arrow per move.
  • A qualifying signal in the opposite direction is shown at once.

Main settings

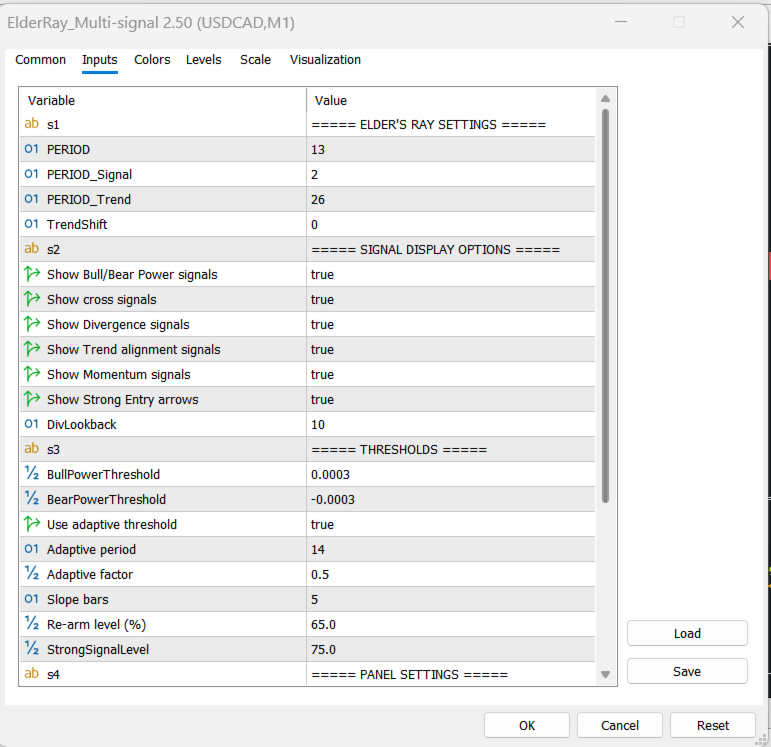
Setting Default What it does
PERIOD 13 Base period
PERIOD_Signal 2 Fast line period
PERIOD_Trend 26 Slow line period
TrendShift 0 Slow line offset, in bars back
Show buyer/seller pressure true Show or hide the Bull and Bear readings
Show cross signals true Show or hide the Cross reading
Show divergence true Show or hide divergence lines and the Div reading
Show trend alignment true Show or hide the Trend reading
Show momentum true Show or hide the Mom reading
Show strong entry arrows true Show or hide STRONG BUY / SELL arrows
DivLookback 10 How far back the previous swing is searched
Divergence lines on price chart true Also draw divergence lines on price
Bullish / Bearish divergence colour yellow / magenta Line colours
Divergence lines kept 100 Number of recent lines kept on the chart (0 = all)
Use adaptive threshold true Pressure levels adjust automatically to each symbol and timeframe
Adaptive period 14 Tunes the adaptive levels
Adaptive factor 0.5 Tunes the adaptive levels
BullPowerThreshold / BearPowerThreshold 0.0003 / -0.0003 Fixed levels, used only when adaptive threshold is off
Slope bars 5 Candles used for the building / fading tag
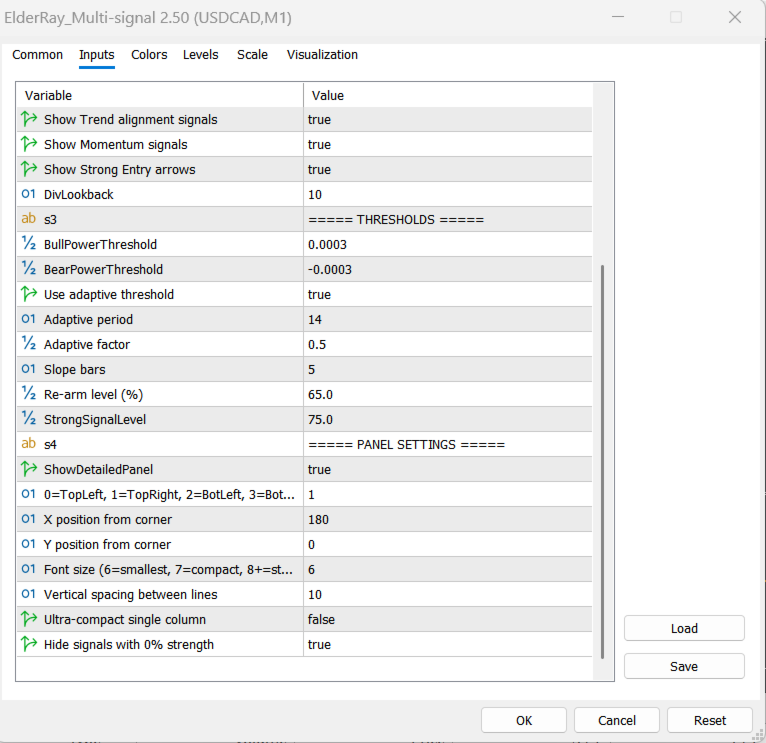
StrongSignalLevel 75 Confluence score needed for an arrow
Re-arm level (%) 65 Score the move must drop below before a new same-direction arrow
Panel settings — Show/hide, corner, X/Y position, font size, line spacing, compact mode, show only active readings

Good to know

  • Works on any symbol and timeframe.
  • Hiding a reading also removes it from the confluence score, so you can build the score from only the readings you trust.
  • Keep Use adaptive threshold on for metals, indices and JPY pairs. The fixed levels are in price units and suit 5-digit FX pairs.
  • Divergence and strong-arrow values are available in the Data Window, so an EA can read them on closed candles.
  • The indicator draws on the chart only. It has no pop-up, sound, push or e-mail alerts, and it does not place trades.

Trading involves risk. This indicator is an analysis tool and does not guarantee profit. Test it on a demo account before trading live.
Recommended products
FVG - Fair Value Gap The FVG - Fair Value Gap is an advanced MQL4 indicator designed for traders who utilize institutional order flow and Smart Money Concepts to identify market inefficiencies. This indicator automatically detects and highlights Fair Value Gaps (FVGs) on your chart, providing a clear visual representation of potential support and resistance zones, reversal points, and high-probability trading setups. Key Features: Automated FVG Detection: The indicator automatically identifies
FxBears Powers
Rachid Lafhil
3 (2)
FxBears Powers – Institutional Entry Levels with Precision Stop Chasing the Market. Trade the Levels That Matter. FxBears Powers is a professional trading indicator designed to identify high-probability reversal zones before price reaches them. Instead of reacting after the move has already started, FxBears Powers helps you prepare for the market by providing precise Buy Limit and Sell Limit levels based on advanced market structure analysis. The algorithm combines multiple layers of price behav
GreenBox
Taro Mitsuyasu
It is an indicator that analyzes the high and low prices in real time by Dow theory, draws a trend line, and draws the predicted arrival point in the Box format after breaking the low price and the high return price. The high and low prices are determined by the nBars parameter (initial value = 5), but displaying the corresponding moving averages (SMA and EMA 4 to 5 times nBars) at the same time makes it easier to understand the trend change. (D ownload the demo version of the free GreenBox and
Quantum Falcon Signal Free is a smart visual trading indicator for MetaTrader 4 designed for Forex and Gold traders. The indicator combines: • Trend analysis • RSI momentum confirmation • MACD momentum filtering • ATR volatility filtering • Higher timeframe confirmation • Smart exit signal detection Main Features: • Smart Buy and Sell signals • Exit Buy / Exit Sell alerts • Real-time dashboard on chart • Professional candle arrows • Multi-timeframe trend confirmation • ATR market volatility filt
FREE
Price Magnet — Price Density and Attraction Levels Indicator Price Magnet is a professional analytical tool designed to identify key support and resistance levels based on statistical Price Density. The indicator analyzes a specified historical period and detects price levels where the market spent the most time. These zones act as “magnets,” attracting price action or forming a structural base for potential reversals. Unlike traditional Volume Profile tools, Price Magnet focuses on price-time d
Daily Candle Predictor is an indicator that predicts the closing price of a candle. The indicator is primarily intended for use on D1 charts. This indicator is suitable for both traditional forex trading and binary options trading. The indicator can be used as a standalone trading system, or it can act as an addition to your existing trading system. This indicator analyzes the current candle, calculating certain strength factors inside the body of the candle itself, as well as the parameters of
El indicador "MR BEAST ALERTAS DE LIQUIDEZ" es una herramienta avanzada diseñada para proporcionar señales y alertas sobre la liquidez del mercado basándose en una serie de indicadores técnicos y análisis de tendencias. Ideal para traders que buscan oportunidades de trading en función de la dinámica de precios y los niveles de volatilidad, este indicador ofrece una visualización clara y detallada en la ventana del gráfico de MetaTrader. Características Principales: Canal ATR Adaptativo: Calcula
ENTRY AND EXIT ARROWS Indicator – Description The Entry and Exit Arrows indicator is a simple yet effective momentum-based tool designed to highlight potential buy and sell opportunities directly on the chart using visual arrows. It works by comparing two internal momentum measurements with different sensitivities. When both measurements align in the same direction, the indicator confirms a stronger directional bias and plots a signal. How It Works Buy Signal (Lime Arrow Below Candle): Appea
VR Cub
Vladimir Pastushak
VR Cub is an indicator for getting high-quality entry points. The indicator was developed to facilitate mathematical calculations and simplify the search for entry points into a position. The trading strategy for which the indicator was written has been proving its effectiveness for many years. The simplicity of the trading strategy is its great advantage, which allows even novice traders to successfully trade with it. VR Cub calculates position opening points and Take Profit and Stop Loss targe
Atomic CHOCH BOS Trend Indicator v1.4 TRADING AUTOMATION EXPERTS - MT4 tools designed to enhance trader performance. Master the Smart Money Strategy with Precision _____________________________________________________________________________________________________________________________________________________________________________ Smart Market Structure Analysis Unlock the power of smart market structure analysis with the Atomic Break of Structure Change of Character (CHOCH) / Break of Str
The indicator builds current quotes, which can be compared with historical ones and on this basis make a price movement forecast. The indicator has a text field for quick navigation to the desired date. Options: Symbol - selection of the symbol that the indicator will display; SymbolPeriod - selection of the period from which the indicator will take data; IndicatorColor - indicator color; Inverse - true reverses quotes, false - original view; Next are the settings of the text field, in w
Noize Absorption Index MT4
Ekaterina Saltykova
5 (1)
Noize Absorption Index - is the manual trading system that measures the difference of pressure between bears forces and bulls forces. Green line - is a noize free index that showing curent situation. Zero value of index shows totally choppy/flat market.Values above zero level shows how powerfull bullish wave is and values below zero measures bearish forces.Up arrow appears on bearish market when it's ready to reverse, dn arrow appears on weak bullish market, as a result of reverse expectation. S
Smart Phase Box (SPB) — Indicator Description Smart Phase Box automatically locates consolidation zones (bases, flats) on the chart and analyzes the candle microstructure inside each zone — wicks, tick volume, body-to-range ratio, and where price closes relative to the zone — to estimate whether the zone looks more like accumulation (buyers absorbing supply) or distribution (sellers absorbing demand), based on classic Wyckoff / Smart Money concepts. MT5-version:  https://www.mql5.com/en/market/p
Auto Fibo Pro m
DMITRII GRIDASOV
"Auto FIBO Pro"   Crypto_Forex  indicator  - is great auxiliary tool in trading! Indicator automatically calculate and place on chart Fibo levels and local trend lines (red color). Fibonacci levels indicate key areas where price can reverse. Most important levels are 23.6%, 38.2%, 50% and 61.8%. You can use it   for reversal scalping  or for zone grid trading. There are plenty of opportunities to  improve your current system using Auto FIBO Pro indicator as well. It has Info Spread Swap Displa
The R Var Moving Average Indicator is a trend following indicator designed for die-hard trend followers. It is a quite popular forex trading indicator among stock traders, as well as commodity traders, and its popularity stems from its ability to deliver genuine money making signals to its users. The indicator is comprised of green and red dots that are placed on a sienna line. The green dot is pointing to a bullish signal, while the red dot depicts a bearish signal. Basic Trading Signals Buy S
FREE
The Destroyer EA
Tibor Hartmut Sturm
The Price will increase every 2 weeks. Final Price 999 USD THE DESTROYER EA – Annihilate the Market. Conquer the Challenge. (Battle Tested Logic) THE MISSION The market is a battlefield. Only the disciplined survive. The Destroyer EA was not built to "participate" in the market—it was built to dominate it. Designed specifically for the grueling conditions of Prop Firm Challenges (FXIFY, FTMO, MFF, etc.) , this algorithm combines the lethal precision of the "D-Strategy" (EMA 21/55 Cross) with an
The indicator detects and displays 3 Drives harmonic pattern (see the screenshot). The pattern is plotted by the extreme values of the ZigZag indicator (included in the resources, no need to install). After detecting the pattern, the indicator notifies of that by a pop-up window, a mobile notification and an email. The indicator highlights the process of the pattern formation and not just the complete pattern. In the former case, it is displayed in the contour triangles. After the pattern is com
This is a new strategy for SUPPLY DEMAND areas It is based on a calculation using the tick volume to detect the big price action in market for both bear /bull actions this smart volume action candles are used to determine the supply and demand areas prices in between main supply and demand lines indicate sideway market  up arrows will be shown when prices moves above the main supply and the secondary supply lines Down arrows will be shown when prices moves below the main demand and the secondary
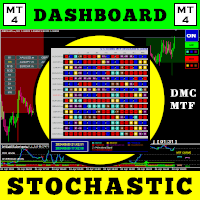
With this trading tool, you can scan 15 markets simultaneously . Introducing, new trading indicator 2024 : ️ Dashboard Multi Currency Multi Time Frame Stochastic. There are at least two reasons why I created this trading tool : First , I'm bored of only observing one market. Second , I don't want to lose the entry moment in another market. That's why I want to know other market conditions at the same time. For this reason, I need a scanner that can scan the conditions of several markets si
Gold Session Trap Distance Map Gold Session Trap Distance Map is a clean intraday liquidity-mapping indicator designed for XAUUSD traders who want to track where price still has unfinished business from major trading sessions. Instead of filling the chart with random support and resistance, this indicator focuses on one simple idea: unbroken session trap zones can act like future liquidity magnets. The indicator tracks key session trap areas from the major trading periods and displays live dista
Garuda Empire
Ellan Dirgantara Tholkhah
The Garuda Empire - Binary Options Experience the epitome of trading synthesis where the time-honored Ichimoku methodology seamlessly intertwines with revered Western indicators. It's a harmonious blend—Europe shaking hands with Japan, a true testament to the power of global financial collaboration. With years of dedicated observation and analysis, I've come to one conclusion: Mastery is achieved through specialization. My journey with the EURJPY has been transformative, leading to the birth of
Note : The slow loading of the indicator issue has been addressed . This new version loads fast and does not slow the platform. Version 1.3 : We have updated the indicator to include an historical bar scanning option . So instead of scanning all bars in the history (which can make the indicator slow sometimes ) , you can select the maximum number of bars it can scan which can increase the performance and make the indicator faster. This indicator scans the 1-3 Trendline pattern . The indicator i
For this set of indicators 1. General information     - Calculates with high performance mathematical algorithms.     - Calculated from the price of candles     - The entry point of this order is filtered by the train EMA and the oscillator.     - Calculate the integrity of the candle 2. How does it work?     - You can see two types of order entry points: the notification on the monitor and the arrow.     - You can trust 75-95 percent of this entry point. 3. Settings     - A complete candle i
Fibo Reversals is an indicator which has carefully been put together to attempt to indicate a time period in which an ongoing trend is most probably exhausted and a new trend (actually a reversal trend) inadvertently begins. At this, it should be okay for the manual trader to be on the look out for good trading opportunities. Input Settings Father Fibo  – This Input Determines The Highest Price For The Chosen Input Period. Son Fibo  - This Input Determines The Lowest Price For The Chosen Input
Alpha Trend sign has been a very popular trading tool in our company for a long time. It can verify our trading system and clearly indicate trading signals, and the signals will not drift. Main functions: Based on the market display of active areas, indicators can be used to intuitively determine whether the current market trend belongs to a trend market or a volatile market. And enter the market according to the indicator arrows, with green arrows indicating buy and red arrows indicating se
Pisces TheProfitZone "Pisces TheProfitZone MT4 Indicator Powered byFxGangster" This indicator will calculate new support and resistant zone everyday, and that give us a trading zone such as thats telling us TP and SL, So it still telling us for where should the price will go reach? Fore Example. Uptrend : If Price can stay upper a Line and price close higher above a Line, then the price will continue go up to reach next Line. Downtrend : If Price can't pass to stay upper a Line and the price
PZ Harmonacci Patterns
PZ TRADING SLU
3.17 (6)
Trade smarter, not harder: Empower your trading with Harmonacci Patterns This is arguably the most complete harmonic price formation auto-recognition indicator you can find for the MetaTrader Platform. It detects 19 different patterns, takes fibonacci projections as seriously as you do, displays the Potential Reversal Zone (PRZ) and finds suitable stop-loss and take-profit levels. [ Installation Guide | Update Guide | Troubleshooting | FAQ | All Products  ] It detects 19 different harmonic pric
New, more accurate version of the Xmaster indicator. More than 200 traders from around the world have conducted more than 15,000 tests of different combinations of this indicator on their PCs in order to get the most effective and accurate formula. And here we present to you the "Xmaster formula indicator forex no repaint" indicator, which shows accurate signals and does not repaint. This indicator also sends signals to the trader by email and push. With the arrival of each new tick, it constan
Happy Scalping Indicator
Leandro Bernardez Camero
This indicator was designed for aggressive scalping and quick entries in binary options , generating signals on every candle , so you can know exactly what is happening at all times. Join the Happy Scalping channel: MQL5 It does not repaint : the current candle's signal is generated in REAL TIME , which means it may change while the candle is still forming, depending on whether the price rises or falls compared to the previous candle's close. But once the candle closes , the signal color becom
DoIt Alpha Pulse AI: the AI trading EA for MT5 where GPT-6 Astra, Claude Fable 5.1 and Gemini 3.5 Pro make live trading decisions on gold (XAUUSD) and forex, with a Myfxbook-verified forward test, a dedicated Prop Firm Mode and a multi-symbol Portfolio Engine.   If you searched "chatgpt trading bot" or "ai forex robot", this is the one where the AI is real, and provable. v3.00 is live: the full roadmap, delivered. 397 USD, one-time, lifetime updates included. No rental. The AI is real, and prov
Buyers of this product also purchase
Trend SniperX MT4
Sarvarbek Abduvoxobov
5 (5)
Trend Sniper X is a multi-timeframe trend-following indicator for MetaTrader 5 that helps traders identify trend direction and potential reversal points with clarity and precision. For MT5: https://www.mql5.com/en/market/product/181101 Price Information: The current price is promotional and is subject to change as upcoming updates and new features are released. Code2Profit Channel Master the Market with Multi-Timeframe Analysis! How to Maximize Your Win Rate with Trend Sniper X: Key Rules & Sess
AW Prime Oscillator
AW Trading Software Limited
5 (1)
A combination of two oscillators. The first one displays the entry points, the second shows the current trend . The indicator can display oscillator signals by arrows in two modes, all fast oscillator signals or signals only in the direction of the current trend. It has a multi-timeframe panel and three types of signal notifications. Benefits: Suitable for day and scalping trading Trend filtering Simple and sensitive setup Multi-timeframe panel Suitable for integration into an advisor. Works on
Liquidity Scalper System: a liquidity-based trading system in indicator form. Most indicators only show an arrow, and the trader then has to decide where the stop goes, where the target is and whether the signal can be trusted at all. Liquidity Scalper System covers the full trade cycle: it finds liquidity pools, gives a signal when they are broken, immediately calculates Entry, Stop Loss and three targets, and shows statistics and out-of-sample test results on the panel. The system picks its o
Atomic Analyst
Issam Kassas
5 (14)
Atomic Analyst — MetaTrader 4 For product questions, setup guidance, or technical support, message me directly here on MQL5. The indicator turns complex market calculations into simple visual signals, color-coded candles, trend readings, stop-loss levels, and multiple take-profit zones that traders can understand quickly and use in real market conditions. Main Trading Uses: Scalping and intraday trading: Designed for fast decision-making, clear arrows, alerts, candle colors, and structured entry
Smart Trend Trading System is a chart indicator for MetaTrader 4 that brings trend information, entry and exit signals, and price levels into one workspace. It combines 10+ trading tools into one system, including trend detection, reversal zones, smart cloud, trailing stop logic, support and resistance, candle coloring, alerts, and multi-timeframe analysis. The system is designed to help you trade different market conditions: Trending markets: Identify the main trend, detect pullbacks, follow mo
Top Bottom Tracker is an indicator based on sophisticated algorithms that analyse the market trend and can detect the highs and lows of the trend / MT5 version . The price will progressively increase until it reaches 500$. Next price --> $99 Features No repainting This indicator does not change its values when new data arrives Trading pairs All forex pairs Timeframe     All timeframes Parameters ==== Indicator configuration ==== Configuration parameter // 40 (The higher the value, the
Scalper Vault
Oleg Rodin
5 (40)
Scalper Vault is a powerful, fully-equipped trading system designed for traders who want to achieve consistency in intraday trading . This high-precision indicator serves as a complete, standalone trading system that delivers institutional-grade analysis for both Forex and Binary Options traders. PLEASE CONTACT ME AFTER PURCHASE TO GET MY TRADING TIPS PLUS A GREAT BONUS! By eliminating the guesswork and complex manual analysis, Scalper Vault allows you to focus purely on execution using easy t
Neuro Poseidon MT4
Daria Rezueva
4.74 (46)
Neuro Poseidon is a new indicator by Daria Rezueva. It combines precise trading signals with adaptive TP/SL levels - creating best possible trades as a result! Message me and get  Neuro Poseidon Assistant  as a gift to automize your trading process! What makes it stand out? 1. Proven profitability on all assets and timeframes 2. Only confirmed BUY and SELL signals present on the chart 3. Adaptive TP & SL levels generated by the software for each trade 4. Easy to understand - suitable for all
Trading Special – 30% OFF Best Solution for any Newbie or Expert Trader! This dashboard software is working on 28 currency pairs plus one. It is based on 2 of our main indicators (Advanced Currency Strength 28 and Advanced Currency Impulse). It gives a great overview of the entire Forex market plus Gold or 1 indices. It shows Advanced Currency Strength values, currency speed of movement and signals for 28 Forex pairs in all (9) timeframes. Imagine how your trading will improve when you can watch
SR Liquidity
Oleg Rodin
5 (2)
SR Liquidity is a trading indicator designed to reveal the hidden zones where market liquidity concentrates and price reacts most strongly. These special liquidity areas act as powerful support and resistance levels, giving you a clear map of where the market is most likely to reverse. Instead of drawing ordinary Support/Resistance lines, SR Liquidity analyzes real price behavior to detect the zones where buying and selling pressure accumulate. These are actually the pools of liquidity that driv
M1 Sniper
Oleg Rodin
4.97 (30)
M1 SNIPER  is an easy to use trading indicator system. It is an arrow indicator which is designed for M1 time frame. The indicator can be used as a standalone system for scalping on M1 time frame and it can be used as a part of your existing trading system. Though this trading system was designed specifically for short-term trading, it still can be helpful for all traders. This trading system can be used with any forex pair and time frame, though lower time frames are recommended from M1 up to M
Advanced Supply Demand
Bernhard Schweigert
4.91 (302)
Trading Special – 30% OFF Best Solution for any Newbie or Expert Trader! This indicator is a unique, high quality and affordable trading tool because we have incorporated a number of proprietary features and a new formula. With this update, you will be able to show double timeframe zones. You will not only be able to show a higher TF but to show both, the chart TF, PLUS the higher TF: SHOWING NESTED ZONES. All Supply Demand traders will love it. :) Important Information Revealed Maximize the pot
Cycles Predictor Indicator This indicator uses past market cycles to predict future price movements. The indicator scans through past data and considers  combinations  of cycles. When cycles  coincide  at the same future date/time then it is considered a valid future prediction. The predictions are drawn as vertical lines on the right side of the chart in the future. A prediction will often result in type of candle (ex. bull or bear) and/or a reversal point (ex. bottom or top) forming at this ex
GoldRush Trend Arrow Signal V1.6 The GoldRush Trend Arrow Signal indicator V1.6 continues to provide precise, real-time trend analysis tailored for high-speed, short-term scalpers in XAU/USD , but it now has additional features and improved efficiency and reliability. Built specifically for the 1-minute time frame, this tool displays directional arrows for clear entry points, allowing scalpers to navigate volatile market conditions with confidence. The indicator consists of PRIMARY and SECONDARY
Break and Retest Hunter MT4 is a powerful MetaTrader 5 indicator designed to automatically identify support and resistance levels, breakout structures, and potential retest opportunities in real time. Bonus Indicator: After purchasing Break and Retest Hunter , contact me to receive Trade Indicator Assistant EA completely free as a bonus utility. $65 for the next 10 copies . Next price is $120.  Combining adaptive market analysis, clear BUY/SELL signals, Fibonacci-based profit targets, and a pre
PRO Renko System
Oleg Rodin
5 (31)
PRO Renko System is a highly accurate trading system specially designed for trading RENKO charts. The ARROWS and Trend Indicators DO NOT REPAINT! The system effectively neutralizes so called market noise giving you access to accurate reversal signals. The indicator is very easy to use and has only one parameter responsible for signal generation. You can easily adapt the tool to any trading instrument of your choice and the size of the renko bar. I am always ready to provide extra support to help
ForexTrendMT4
Andriy Sydoruk
5 (1)
ForexTrendMT4 Indicator: A Reliable Tool for Market Tracking The ForexTrendMT4 indicator offers reliable market trend tracking, filtering out sudden fluctuations and market noise. This tool helps identify trends and signals favorable entry points into the market using arrows. It is suitable for both scalping on shorter timeframes and long-term trading strategies. Based on the principles of technical analysis, ForexTrendMT4 takes into account the cyclical nature of the market. Key Features and A
CRT Multi-Timeframe Market Structure & Liquidity Sweep Indicator Non-Repainting | Multi-Asset | MT5 Version Available MT5 Version:   https://www.mql5.com/en/market/product/162075 Full User Guide — explains what each feature does and why:   https://www.mql5.com/en/blogs/post/767525 Quick Start User Guide  — explains how to configure and in what order:  https://www.mql5.com/en/blogs/post/767540 Indicator Overview CRT Ghost Candle HTF Fractal is a complete institutional-grade market structure too
Super Signal – Skyblade Edition Professional No-Repaint / No-Lag Trend Signal System with Exceptional Win Rate | For MT4 / MT5 It works best on lower timeframes, such as 1-minute, 5-minute, and 15-minute charts. Core Features: Super Signal – Skyblade Edition is a smart signal system designed specifically for trend trading. It applies a multi-layered confirmation mechanism to detect only strong, directional moves supported by real momentum. This system does not attempt to predict tops or bottoms
Currency Strength Wizard is a very powerful indicator that provides you with all-in-one solution for successful trading. The indicator calculates the power of this or that forex pair using the data of all currencies on multiple time frames. This data is represented in a form of easy to use currency index and currency power lines which you can use to see the power of this or that currency. All you need is attach the indicator to the chart you want to trade and the indicator will show you real str
Trading Special –40% OFF Best Solution for any Newbie or Expert Trader! This Indicator is a unique, high quality and affordable trading tool because we have incorporated a number of proprietary features and a new formula. With only ONE chart you can read Currency Strength for 28 Forex pairs! Imagine how your trading will improve because you are able to pinpoint the exact trigger point of a new trend or scalping opportunity? User manual: click here Looking for the MT5 version? Click here: https:/
Volume Orderflow Profile
Suvashish Halder
5 (2)
Introducing Volume Orderflow Profile , a versatile tool designed to help traders visualize and understand the dynamics of buying and selling pressure within a specified lookback period. Perfect for those looking to gain deeper insights into volume-based market behavior! MT5 Version -  https://www.mql5.com/en/market/product/122657 The indicator gathers data on high and low prices, along with buy and sell volumes, over a user-defined period. It calculates the maximum and minimum prices during this
An arrow tells you to buy. Obsidian Scalper Pro tells you where to buy, where the stop goes, where the three targets are, how big the position should be for your risk, and how good the setup is out of 100. Every signal arrives as a finished trade plan drawn on the chart, and a built in statistics window shows the honest result of the last hundred of them, win rate with a confidence interval and all. Every decision is made on a closed bar, so the history you are looking at is the history you woul
This indicator works on MT4 and is very easy to use. When you receive a signal from it, you wait for that candle with the signal to close and you enter your trade at the beginning of the next new candle . A red arrow means sell and a green arrow means buy. All arrows comes with Alert  like for easy identification of trade signal. Are you okay with that? 1 minute candle 1 minute expire
Trend Lines PRO
Roman Podpora
5 (2)
TREND LINES PRO    helps understand where the market is truly changing direction. The indicator shows real trend reversals and points where major players re-enter. You see   BOS lines   Trend changes and key levels on higher timeframes — without complex settings or unnecessary noise. Signals don't repaint and remain on the chart after the bar closes. VERSION MT 5     -     Reveals its maximum potential when paired with the   RFI LEVELS PRO  indicator What the indicator shows: Real shifts   tren
Binary Trader Master is an arrow based indicator that predicts the close of the candle. It does its analysis within one candle only. When the candle opens it requires a few moments to make the analysis and predict the close of the candle. Then it generates a signal. The indicator also allows you to apply time limits that it can use for the analysis which means that you can actually tell the indicator how much time it is allowed to have for the analysis within the candle. The indicator monitors s
This is a professional chart indicator designed for traders focused on stability and clear price action. It helps filter market noise and provides clear visual entry and exit zones for your trading decisions. Core Features: Strictly Non-Repainting: The system is built with strict non-repaint logic. What you see on the chart is the true historical performance. Confirmed Signals: Signals are triggered and confirmed only after the candle closes . Once a trading arrow appears on a closed candle, it
Gann Made Easy
Oleg Rodin
4.84 (173)
Gann Made Easy is a professional and easy to use Forex trading system which is based on the best principles of trading using the theory of W.D. Gann. The indicator provides accurate BUY and SELL signals including Stop Loss and Take Profit levels. You can trade even on the go using PUSH notifications. PLEASE CONTACT ME AFTER PURCHASE TO GET TRADING  INSTRUCTIONS   AND GREAT EXTRA INDICATORS  FOR FREE! Probably you already heard about the Gann trading methods before. Usually the Gann theory is a
KT Parabolic RSI MT4
KEENBASE SOFTWARE SOLUTIONS
KT Parabolic RSI overlays Parabolic SAR directly on the RSI line to highlight likely market turning points. Classic RSI overbought and oversold readings already hint at reversals, and the added PSAR filter removes much of the noise and sharpens those signals, giving you clearer trade setups. Big Square Signals: A Parabolic SAR flip on an RSI that sits in overbought or oversold territory. These mark high-probability market turns. Small Square Signals: A SAR flip inside the neutral RSI band. Treat
SmartSignal
Pavel Krysanov
For any trader, the result of market analysis is the correct identification of the market entry and exit points. The more correctly they are selected, the more profitable the trading. The SmartArrows indicator does not display any excessive information that may distract or confuse the trader, but only the mot important things. The indicator is very simple to use. When a down arrow appears, open a SELL trade, with an up arrow open BUY. Despite its seeming simplicity, the SmartArrows indicator con
More from author
Enhanced TP SL
Gordana Batic
5 (1)
Enhanced TP/SL  MT5 Short description Shows the Take Profit and Stop Loss levels of open positions on the chart, with the distance in pips, the value in account currency, the percentage of account balance and the risk to reward ratio. Full description The Enhanced TP/SL indicator draws the entry price, Take Profit and Stop Loss levels of each open position on the chart. Next to the Take Profit and Stop Loss lines, the indicator can show: the distance from the open price in pips, the value
FREE
Silent Arrow MT5– Clear BUY/SELL Signals That Never Repaint Silent Arrow places one BUY or SELL arrow on your chart when price turns in a new direction and the market structure agrees. It is built for traders who want clean, simple entries without a cluttered chart. Non-repainting, guaranteed by design Every arrow is decided once, when its candle closes, using closed candles only. After that it never moves, changes or disappears. What you see live is exactly what you see after reloading the ch
MTF High Low indicator displays key price levels across multiple timeframes directly on your chart,  so you always know where the market has been and what levels matter most. The   NY Session High/Low Levels  automatically plot the highest and lowest prices of the New York trading session on your chart. It provides clear horizontal lines for the   Today (TDY) ,   Yesterday (YTD) ,   Week (7D) , and   Month (30D)   sessions, with customizable display options.           Inspired by MTF.HighLow.
FREE
Session lines that are actually correct. Marks Sydney, Tokyo, London, and NY open/close in your broker's local time — with automatic DST adjustment for all three regions. You set your session times once in GMT, toggle DST for Sydney/London/NY, and forget about it. The indicator handles the rest - broker offset, daylight saving, label positioning - all in the background. Clean labels, toggleable sessions, zero CPU drag. Built for traders who need the market rhythm on their chart without the clut
FREE
Trades Visualizer
Gordana Batic
4 (1)
TradeVisualizer is a dynamic chart-based indicator for MetaTrader 5, designed to visually display recent trades directly on the chart. It includes: Trade arrows for entry and exit points, color-coded by direction and profit/loss. Dotted lines connecting open and closed trades. Profit/loss labels in pips and currency. Interactive toggle button to show/hide drawings. Trade history panel showing time, ticket, type, lot size, pips, and P/L. Customizable appearance via inputs for colors, fonts, and
FREE
Enhanced TPSL
Gordana Batic
5 (1)
Enhanced TP/SL  MT4 Short description Shows the Take Profit and Stop Loss levels of open positions on the chart, with the distance in pips, the value in account currency, the percentage of account balance and the risk to reward ratio. Full description The Enhanced TP/SL indicator draws the entry price, Take Profit and Stop Loss levels of each open position on the chart. Next to the Take Profit and Stop Loss lines, the indicator can show: the distance from the open price in pips, the value i
FREE
MTF High Low indicator displays key price levels across multiple timeframes directly on your chart,  so you always know where the market has been and what levels matter most. The   NY Session High/Low Levels    automatically plot the highest and lowest prices of the New York trading session on your chart. It provides clear horizontal lines for the   Today (TDY) ,   Yesterday (YTD) ,   Week (7D) , and   Month (30D)   sessions, with customizable display options.           Inspired by MTF.HighLow
FREE
Features: Sydney, Tokyo, London, and New York session lines — open and close Automatic DST adjustment: Australian (Oct–Apr), European (Mar–Oct), US (Mar–Nov). Tokyo fixed, no DST Toggle each session on or off independently Fully customizable: colors, line styles, line width, label size and position Runs on new bar only — no unnecessary recalculations Works on M1 through H1. Disabled on higher timeframes automatically Inputs: Show/hide each session independently Session open and close times in GM
FREE
Advanced Trade Information Dashboard –  MT5 Everything I need to know about my account and open positions, right on the chart. I got tired of clicking between the terminal, the trade tab, and the calculator just to check my margin, pip value, or total profit in pips. So I built this dashboard to put it all in one place. What It Shows Total P&L   – Real profit/loss from the positions I care about (filter by symbol, magic number, or include swap/commission). Margin Level   – The one number th
FREE
Trade Visuals is a dynamic chart-based indicator for MetaTrader 4, designed to visually display recent trades directly on the chart. It includes: Trade arrows for entry and exit points, color-coded by direction and profit/loss. Dotted lines connecting open and closed trades. Profit/loss labels in pips and currency. Interactive toggle button to show/hide drawings. Trade history panel showing time, ticket, type, lot size, pips, and P/L. Customizable appearance via inputs for colors, fonts, and la
FREE
Advanced Trade Information Dashboard –  MT4 Everything I need to know about my account and open positions, right on the chart. I got tired of clicking between the terminal, the trade tab, and the calculator just to check my margin, pip value, or total profit in pips. So I built this dashboard to put it all in one place. What It Shows Total P&L – Real profit/loss from the positions I care about (filter by symbol, magic number, or include swap/commission). Margin Level – The one number that k
FREE
ClearEdge HUD MT4 Trading dashboard for MT4 with market structure, support and resistance, trend, momentum, multi-timeframe bias and an 8-point BUY/SELL confluence score. One Dashboard. A Clearer Market Picture. Price is trending up, but momentum is fading. A BUY setup appears right under resistance. The market has already covered most of its daily range. When indicators disagree, decisions get hard. ClearEdge HUD puts everything you check before a trade into one compact panel beside price, and
QuadZig MT4: 4-Level ZigZag Semafor & Multi-Timeframe Dashboard. Real-time market structure, smart trend mapping & 8-TF analysis for professional MT4 traders. Most traders lose not because they lack information — but because they have too much of it. QuadZig cuts through the noise by mapping the market’s full structural skeleton across 4 levels and 8 timeframes, all inside one clean, intelligent dashboard. What Is QuadZig? QuadZig is a professional 4‑Level ZigZag Semafor Indicator with a buil
MACD FuturePredict Panel Pro MT4 MACD indicator for MT4 with non-repainting BUY/SELL arrows confirmed on candle close, a forward momentum projection, higher-timeframe filter and a 7-point signal score. Go Beyond the MACD Crossover A MACD crossover tells you momentum has changed. It does not tell you whether the trend agrees, whether the higher timeframe agrees, or whether the move has room to run. MACD FuturePredict Panel Pro answers those questions on one chart, so you can tell a strong setup
Keltner Channel Forecast MT4 Keltner Channel indicator for MT4 with ATR volatility bands, forward price projections, trend strength panel and optional non-repainting BUY/SELL arrows. See Where the Channel Is Going A standard Keltner Channel shows where price has been. It cannot tell you whether the trend is strong or fading, or where the channel is heading next. Keltner Channel Forecast adds both: forward projections on the chart and a plain-word strength panel beside it. Keltner Channel Price
Kalman Cone Forecast MT4 Kalman Filter indicator for MT4 with adaptive trend smoothing, a forward price prediction cone, volatility bands and non-repainting exhaustion dots. Find Clarity in Noisy Markets Short-term price noise makes it hard to tell a real move from random wiggles. Ordinary moving averages either lag too much or react to every spike. Kalman Cone Forecast gives you a clean trend line, a realistic price range ahead, and a clear answer on whether conditions suit a trade. Kalman Fil
Silent Arrow MT4 – Clear BUY/SELL Signals That Never Repaint Silent Arrow places one BUY or SELL arrow on your chart when price turns in a new direction and the market structure agrees. It is built for traders who want clean, simple entries without a cluttered chart. Non-repainting, guaranteed by design Every arrow is decided once, when its candle closes, using closed candles only. After that it never moves, changes or disappears. What you see live is exactly what you see after reloading the c
Equity Pulse MT4 Real-time equity, drawdown, and portfolio performance tracking in one clean trading panel. Equity Pulse MT4 is a practical account-monitoring indicator for MetaTrader 4. It helps traders see exactly where they stand across today, yesterday, recent days, the current week, month, and year. Instead of checking account history manually or relying only on the terminal’s floating profit number, Equity Pulse gives you a clear performance snapshot directly on the chart. It is designed
ClearEdge Daily Candle MT4 New York-close daily candle on any timeframe, with candle countdown, live spread and volatility information. Overview  ClearEdge Daily Candle draws the current day's candle next to the live price on any chart timeframe. On the 1-minute, 5-minute, 15-minute, 1-hour or higher charts, you can see where the trading day opened, how far price has moved in both directions, and whether the day is currently bullish or bearish, without switching to the daily (D1) chart. Why
ClearEdge HUD MT5 Trading dashboard for MT5 with market structure, support and resistance, trend, momentum, multi-timeframe bias and an 8-point BUY/SELL confluence score. One Dashboard. A Clearer Market Picture. Price is trending up, but momentum is fading. A BUY setup appears right under resistance. The market has already covered most of its daily range. When indicators disagree, decisions get hard. ClearEdge HUD puts everything you check before a trade into one compact panel beside price, and
QuadZig ZZ Semafor 4L Dashboard MTF MT4 Four-level market structure, ZigZag pivots, and multi-timeframe direction in one clean trading dashboard. QuadZig is a professional market-structure indicator for MetaTrader 4. It combines a 4-level ZigZag Semafor system with a compact multi-timeframe dashboard, helping traders see where price has turned, which structure level is active, and whether higher timeframes are supporting the current move. Instead of relying on one basic ZigZag line, QuadZig se
MACD FuturePredict Panel Pro MT5 MACD indicator for MT5 with non-repainting BUY/SELL arrows confirmed on candle close, a forward momentum projection, higher-timeframe filter and a 7-point signal score. Go Beyond the MACD Crossover A MACD crossover tells you momentum has changed. It does not tell you whether the trend agrees, whether the higher timeframe agrees, or whether the move has room to run. MACD FuturePredict Panel Pro answers those questions on one chart, so you can tell a strong setup

Keltner Channel Forecast MT5 Keltner Channel indicator for MT5 with ATR volatility bands, forward price projections, trend strength panel and optional non-repainting BUY/SELL arrows. See Where the Channel Is Going A standard Keltner Channel shows where price has been. It cannot tell you whether the trend is strong or fading, or where the channel is heading next. Keltner Channel Forecast adds both: forward projections on the chart and a plain-word strength panel beside it. Keltner Channel Price
Kalman Cone Forecast MT5 Kalman Filter indicator for MT5 with adaptive trend smoothing, a forward price prediction cone, volatility bands and non-repainting exhaustion dots. Find Clarity in Noisy Markets Short-term price noise makes it hard to tell a real move from random wiggles. Ordinary moving averages either lag too much or react to every spike. Kalman Cone Forecast gives you a clean trend line, a realistic price range ahead, and a clear answer on whether conditions suit a trade. Kalman Fil
Equity Pulse MT5 Real-time equity, drawdown, and portfolio performance tracking in one clean trading panel. Equity Pulse MT5 is a practical account-monitoring indicator for MetaTrader 5. It helps traders see exactly where they stand across today, yesterday, recent days, the current week, month, and year. Instead of checking account history manually or relying only on the terminal’s floating profit number, Equity Pulse gives you a clear performance snapshot directly on the chart. It is designed
ClearEdge Daily Candle New York-close daily candle on any timeframe, with candle countdown, live spread and volatility information. Overview  ClearEdge Daily Candle draws the current day's candle next to the live price on any chart timeframe. On the 1-minute, 5-minute, 15-minute, 1-hour or higher charts, you can see where the trading day opened, how far price has moved in both directions, and whether the day is currently bullish or bearish, without switching to the daily (D1) chart. Why bro
Elder Ray Confluence MT5 Six readings, one confluence score, non-repainting closed-candle signals Elder Ray Confluence builds on Dr. Alexander Elder’s classic Bull Power / Bear Power study. Instead of reading two histograms by eye and guessing whether a move is real, you get six separate readings that are checked against each other. When enough of them agree, you see it as one clear score and one clear arrow. Non-repainting STRONG BUY / SELL arrows are decided when the candle closes, using clos
Filter:
No reviews
Reply to review