Blahtech Supply Demand MT5
- Indicadores
-
Blahtech Limited
 Professional IT developer with over 20 years of experience working with top tier investment banks (Barclays Capital, Credit Suisse, Merrill Lynch, ABN Amro, Mizuho Bank) - LinkedIn profile available on request
 - Versión: 4.3
- Actualizado: 2 julio 2024
- Activaciones: 8
Antes: $299 Ahora: $99
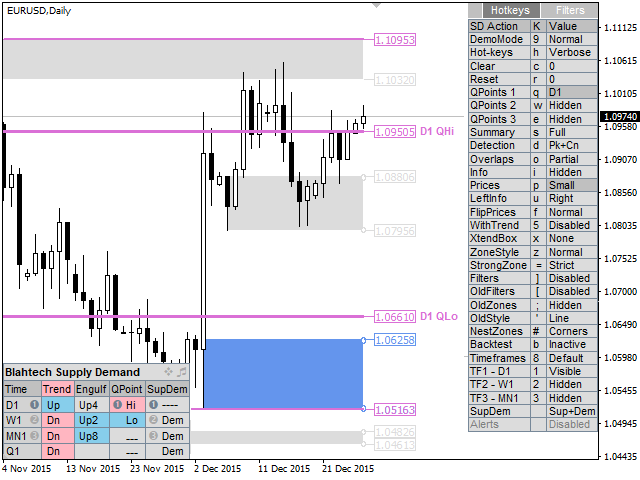
Oferta Demanda utiliza la acción previa del precio para identificar desequilibrios potenciales entre compradores y vendedores. La clave está en identificar las zonas con mejores probabilidades, no sólo las que no se han tocado.
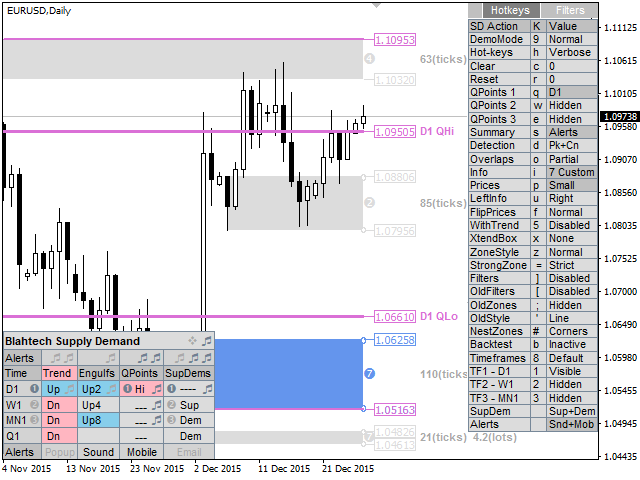
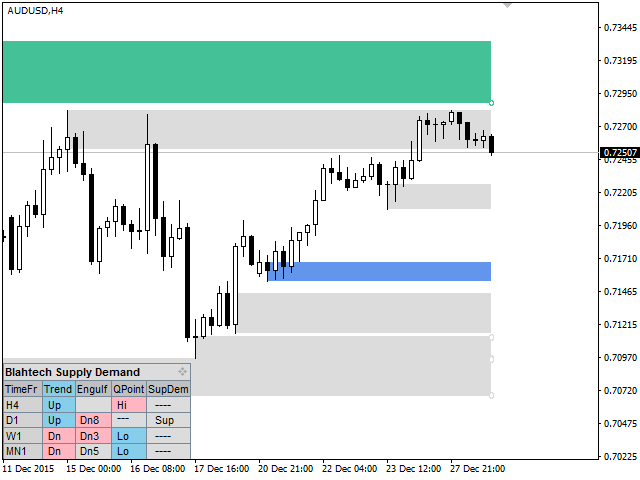
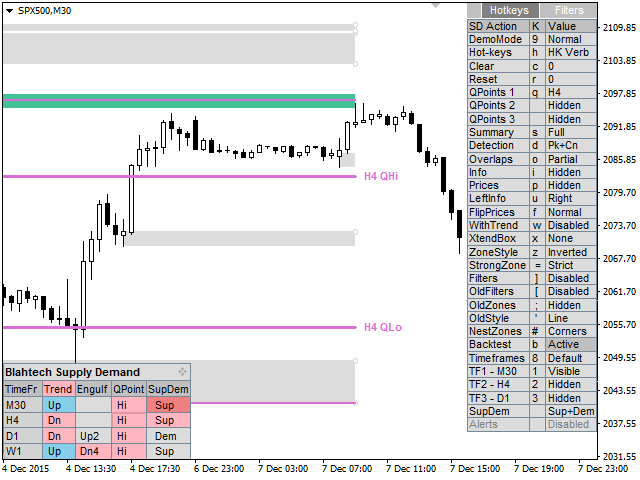
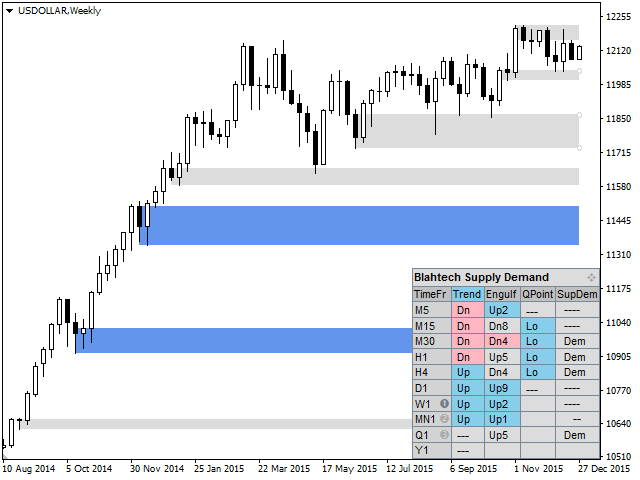
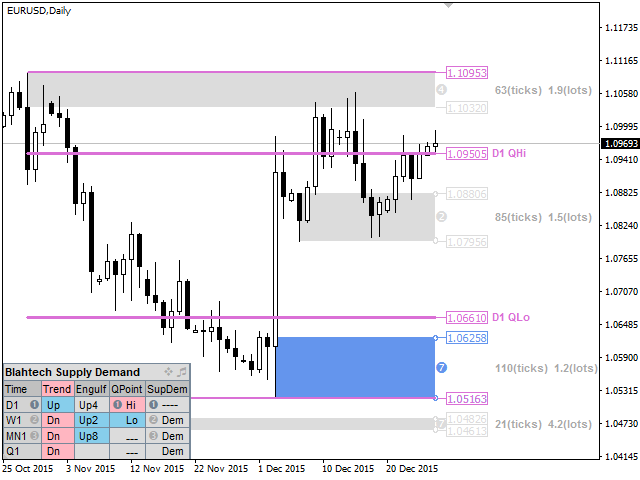
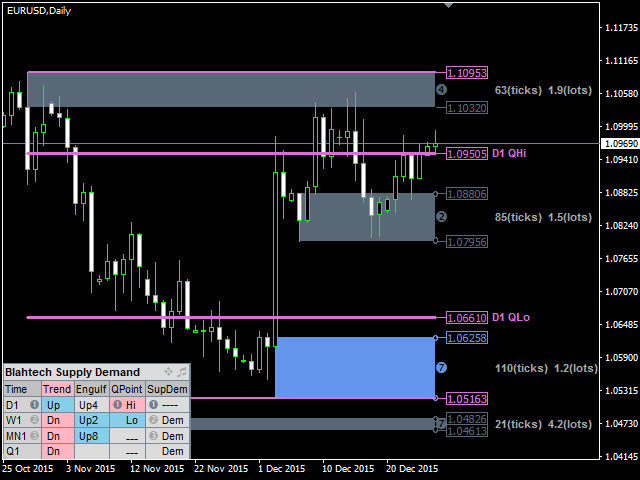
El indicador Blahtech Supply Demand ofrece una funcionalidad que antes no estaba disponible en ninguna plataforma de negociación. Este indicador 4 en 1 no sólo destaca las zonas de mayor probabilidad utilizando un motor de fuerza multicriterio, sino que también lo combina con análisis de tendencias en múltiples marcos temporales, oscilaciones confirmadas previamente y detectores de engulfing. Impulsado por una interfaz fácil de usar y un innovador modo de backtest, este indicador es imprescindible para todos los operadores de oferta y demanda.
Enlaces [ Instalar | Actualizar | Documentación & Formación ]
Características destacadas
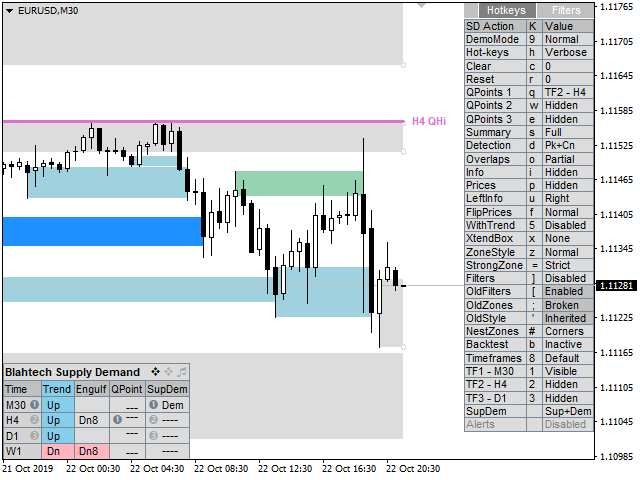
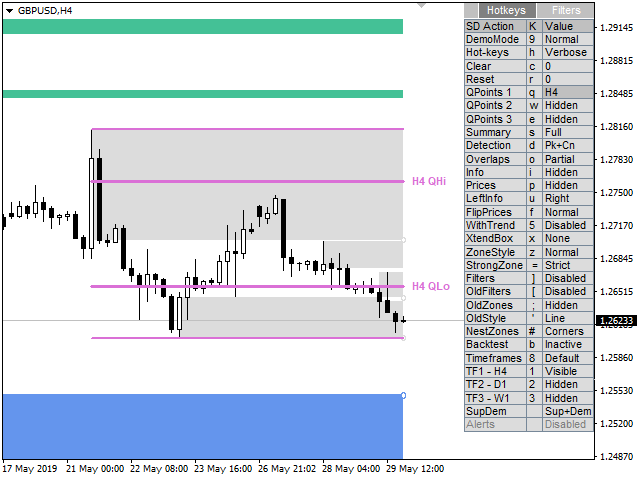
- Visualización en múltiples marcos temporales
- Backtest directamente en el gráfico
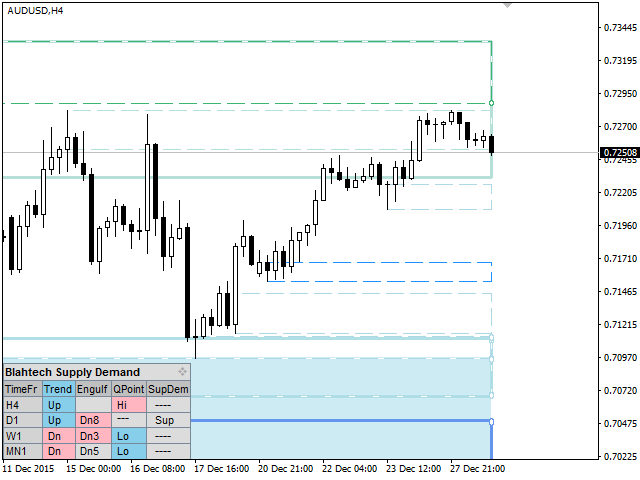
- Panel de resumen
- Análisis de tendencias en múltiples marcos temporales
- Oscilaciones confirmadas (puntos Q altos y bajos)
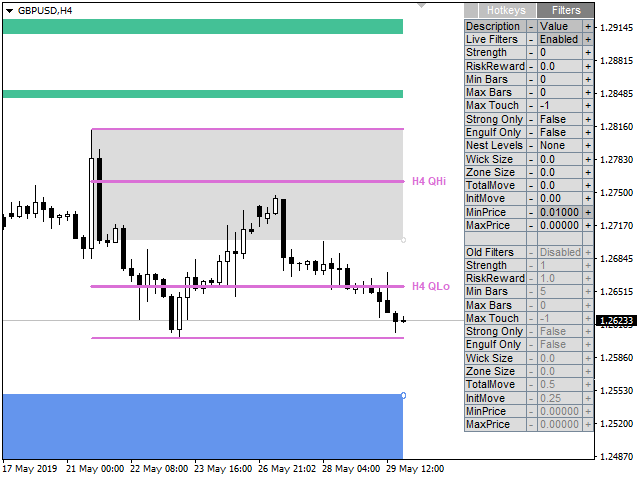
- Motor de fuerza zonal (siete criterios)
Características más destacadas...
- Detección avanzada de niveles (picos, consolidaciones, caídas)
- Teclas de acceso rápido
- Alertas
- Detector de engullimiento
- Filtros de visibilidad
- Zonas antiguas (niveles rotos o cambios de tendencia)
- Resaltado de zonas anidadas
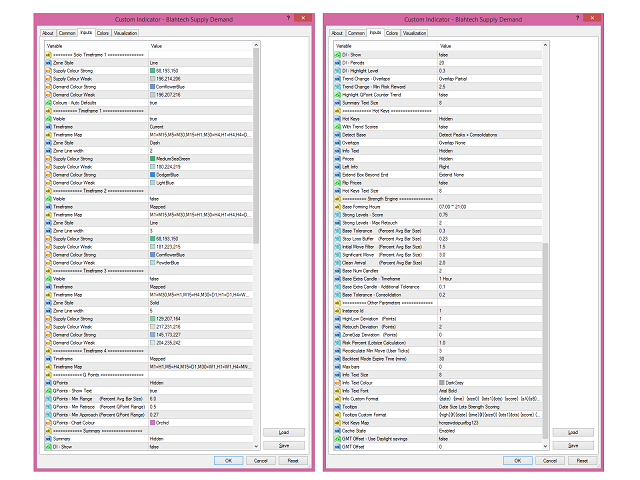
Parámetros de entrada
- Descargue la documentación utilizando el enlace anterior para más detalles


5 Sterne, es hält was es verspricht, hilft wirklich sehr gut, es ist professionell bearbeitet.