Blahtech Supply Demand MT5
- Indikatoren
-
Blahtech Limited
 Professional IT developer with over 20 years of experience working with top tier investment banks (Barclays Capital, Credit Suisse, Merrill Lynch, ABN Amro, Mizuho Bank) - LinkedIn profile available on request
 - Version: 4.3
- Aktualisiert: 2 Juli 2024
- Aktivierungen: 8
War: $299 Jetzt: $99
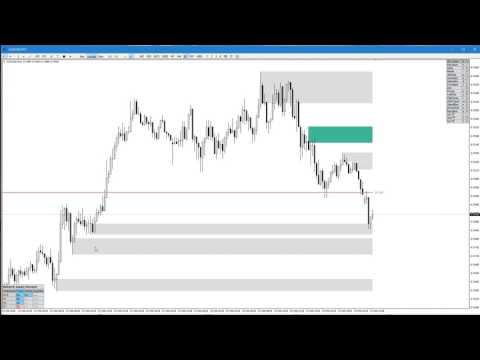
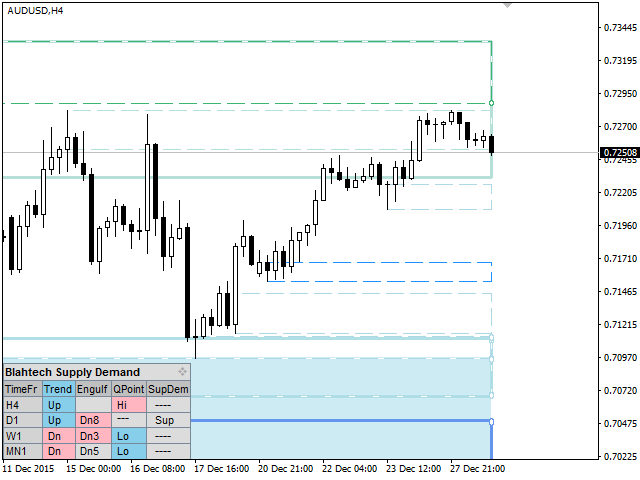
Supply Demand nutzt frühere Kursbewegungen, um potenzielle Ungleichgewichte zwischen Käufern und Verkäufern zu erkennen. Der Schlüssel liegt darin, die Zonen mit den besten Chancen zu identifizieren, nicht nur die unberührten Zonen.
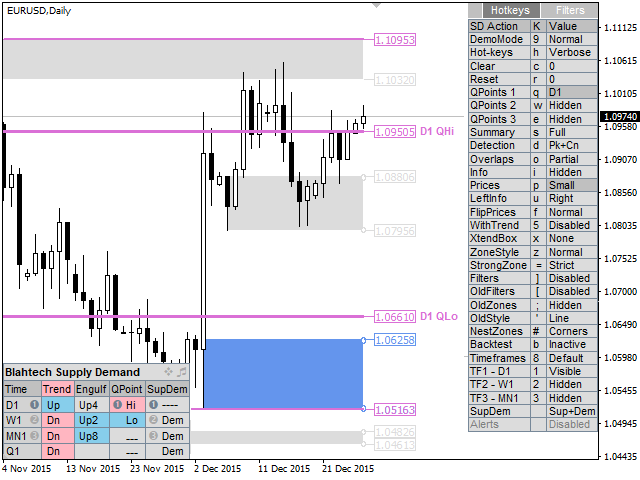
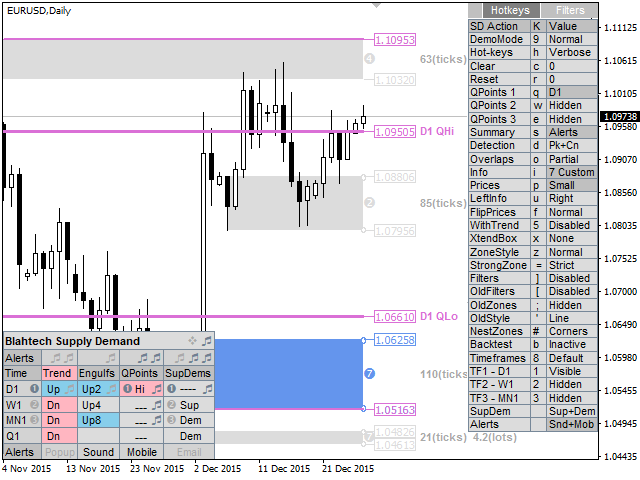
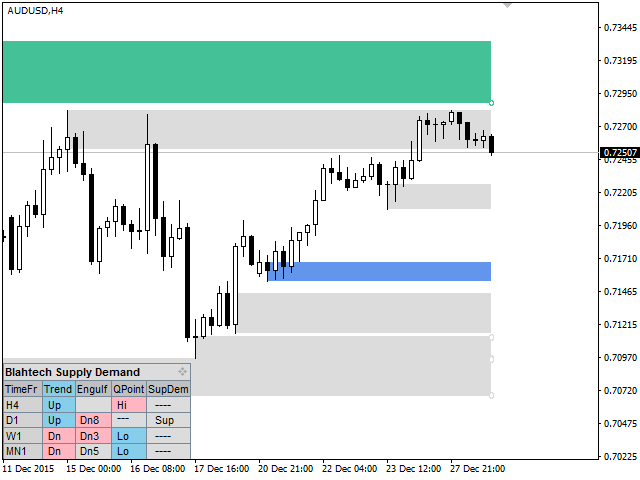
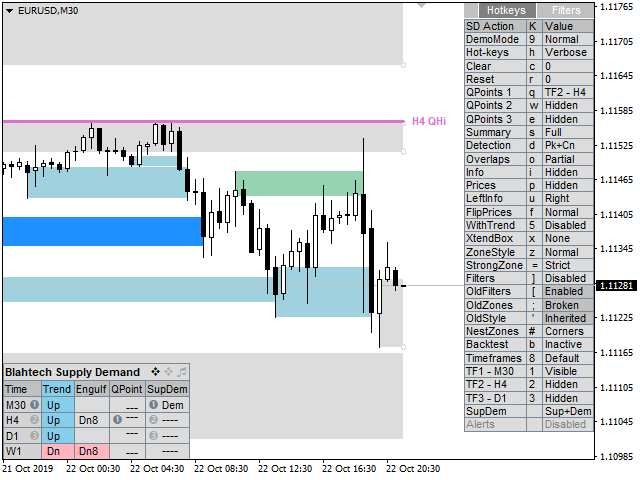
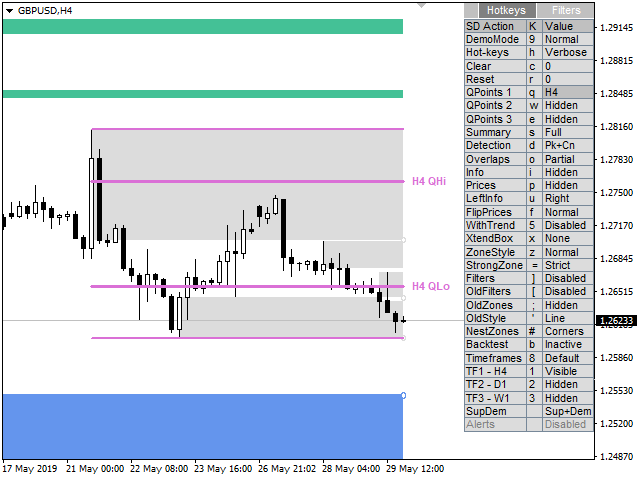
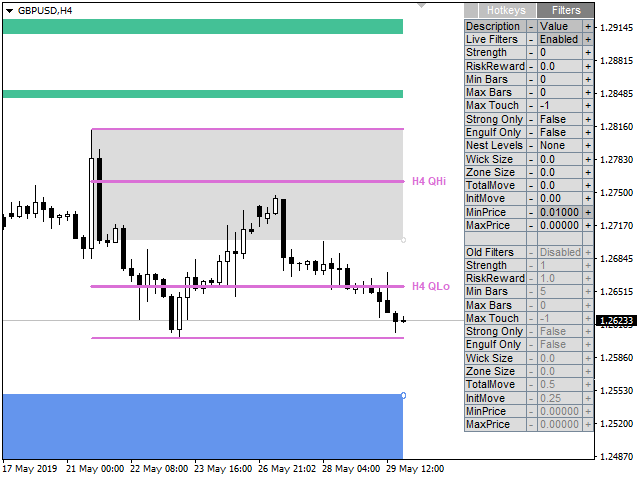
Der Blahtech Supply Demand Indikator bietet eine Funktionalität, die bisher auf keiner Handelsplattform verfügbar war. Dieser 4-in-1-Indikator hebt nicht nur die Zonen mit höherer Wahrscheinlichkeit hervor, indem er eine Multikriterien-Stärke-Engine verwendet, sondern kombiniert diese auch mit einer Multi-Timeframe-Trendanalyse, zuvor bestätigten Schwankungen und Engulfing-Detektoren. Mit einer einfach zu bedienenden Benutzeroberfläche und einem innovativen Backtest-Modus ist dieser Indikator ein Muss für alle Angebots-Nachfrage-Händler.
Links [ Installieren | Aktualisieren | Dokumentation & Schulung ]
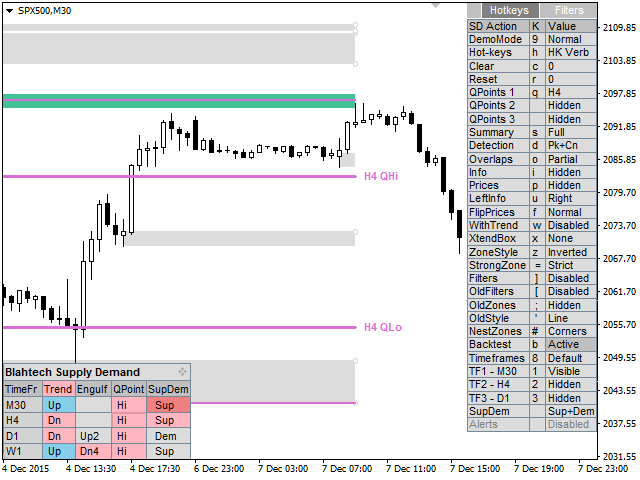
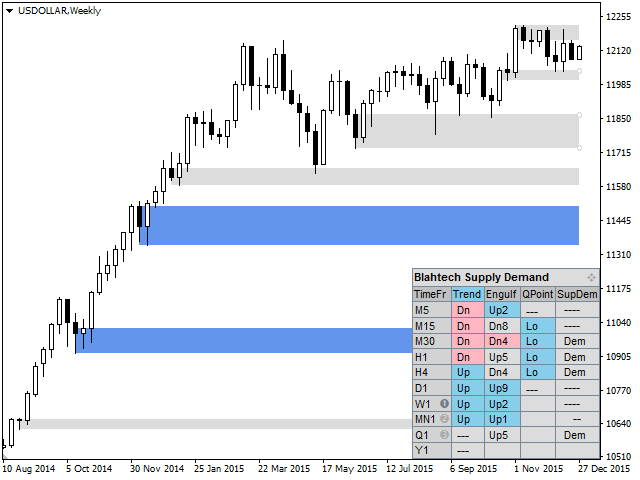
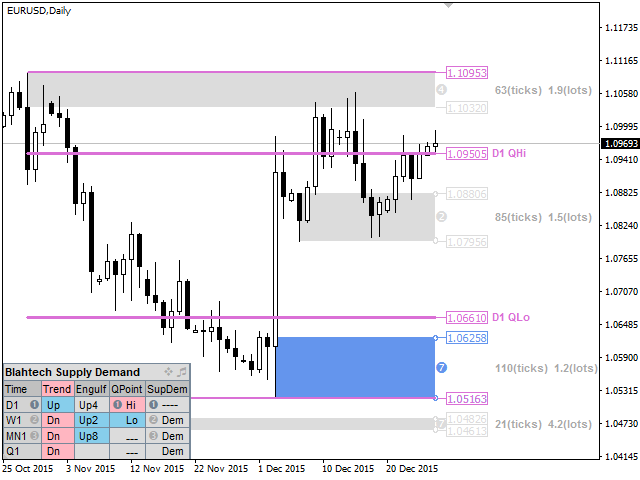
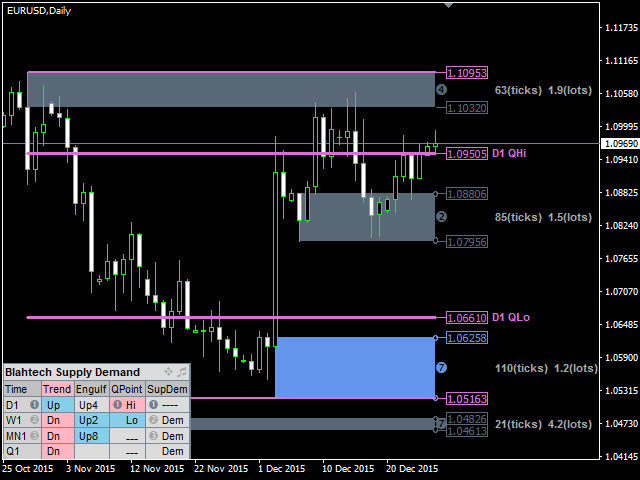
Funktions-Highlights
- Multi-Timeframe-Anzeige
- Backtesting direkt auf dem Chart
- Zusammenfassendes Panel
- Multi-Timeframe-Trendanalyse
- Bestätigte Schwankungen (High und Low QPoints)
- Zonenstärke-Engine (sieben Kriterien)
Funktions-Highlights Fortsetzung...
- Erweiterte Level-Erkennung (Spitzen, Konsolidierungen, Drop-Base-Drops)
- Schneller Zugriff über Hotkeys
- Warnungen
- Engulfing-Detektor
- Sichtbarkeits-Filter
- Alte Zonen (gebrochene Niveaus oder Trendwechsel)
- Hervorhebung von verschachtelten Zonen
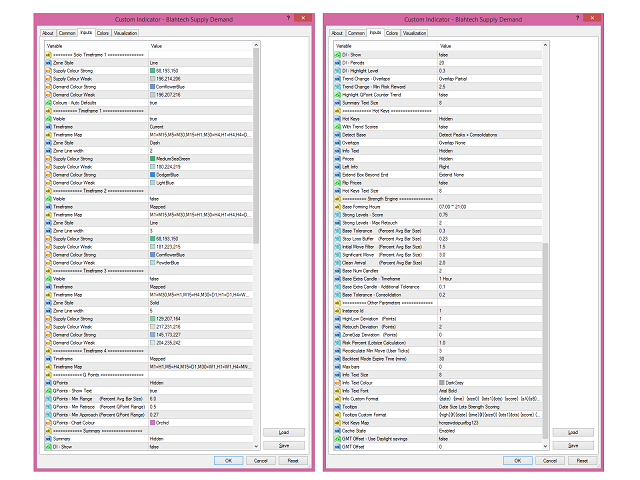
Eingabe-Parameter
- Laden Sie die Dokumentation über den obigen Link herunter, um Details zu erfahren


5 Sterne, es hält was es verspricht, hilft wirklich sehr gut, es ist professionell bearbeitet.