Blahtech Supply Demand MT5
- インディケータ
- バージョン: 4.3
- アップデート済み: 2 7月 2024
- アクティベーション: 8

Was: $299 Now: $99
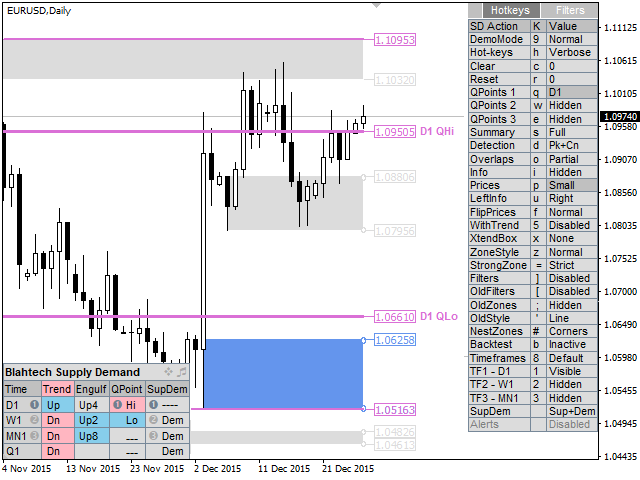
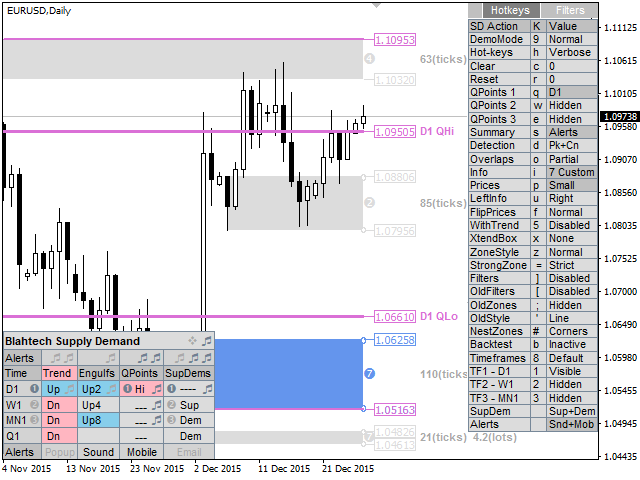
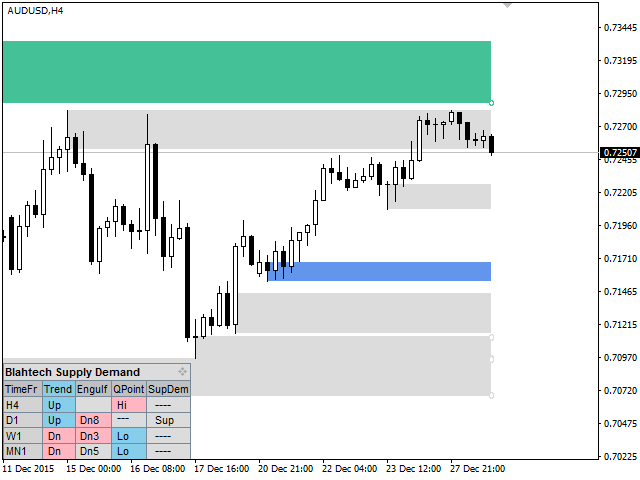
Supply Demand uses previous price action to identify potential imbalances between buyers and sellers. The key is to identify the better odds zones, not just the untouched ones.
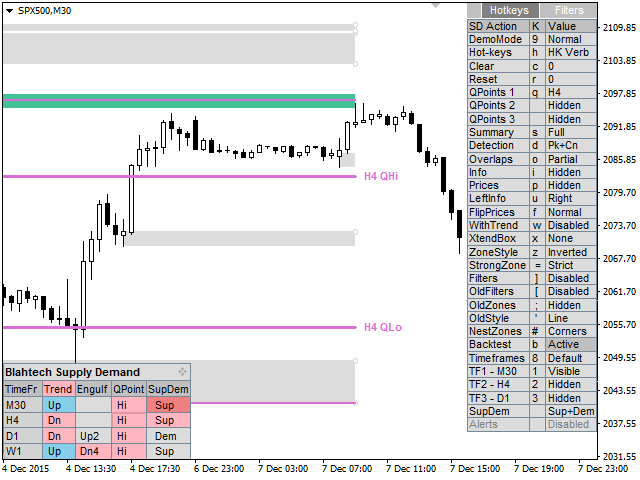
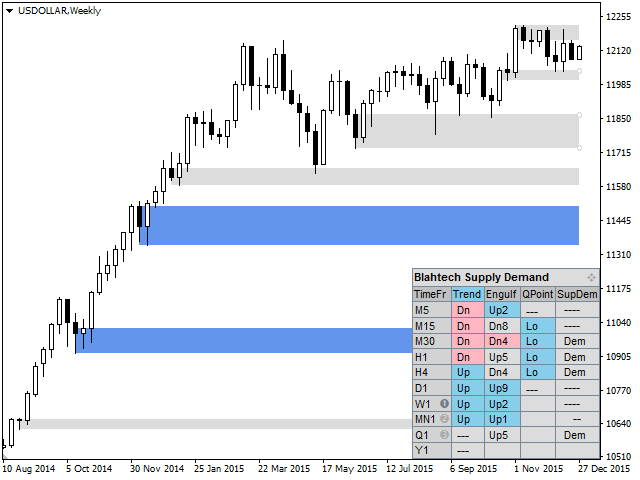
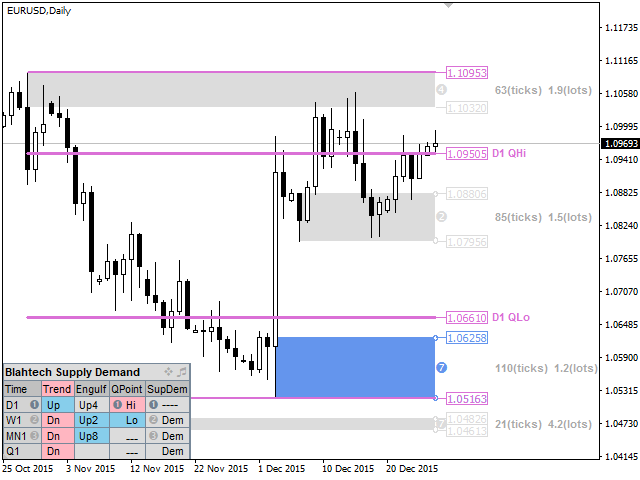
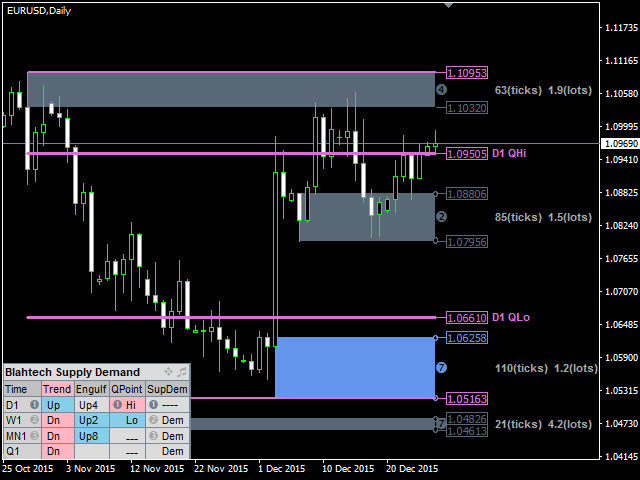
Blahtech Supply Demand indicator delivers functionality previously unavailable on any trading platform. This 4-in-1 indicator not only highlights the higher probability zones using a multi-criteria strength engine, but also combines it with multi-timeframe trend analysis, previously confirmed swings and engulfing detectors. Driven by an easy to use interface and innovative backtest mode this indicator is a must-have for all supply demand traders.
Links [ Install | Update | Documentation & Training ]
Feature Highlights
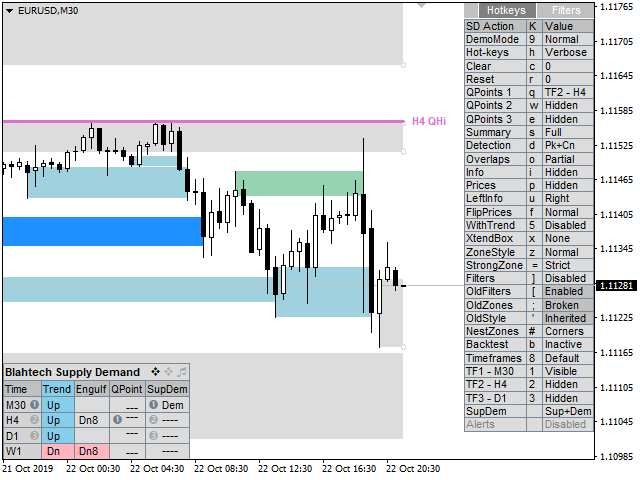
- Multi-timeframe display
- Backtest directly on the chart
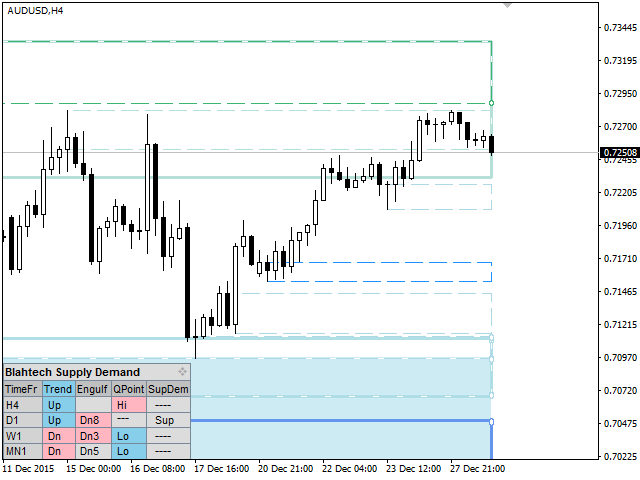
- Summary panel
- Multi-timeframe trend analysis
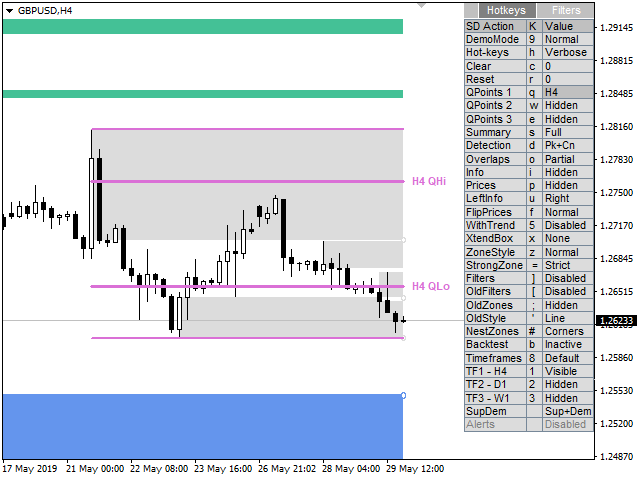
- Confirmed swings (High and Low QPoints)
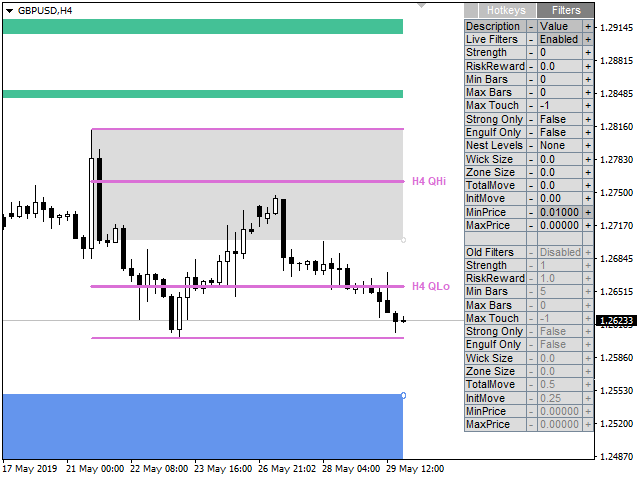
- Zone strength engine (seven criteria)
Feature Highlights continued...
- Advanced level detection (peaks, consolidations, drop-base-drops)
- Fast access hot-keys
- Alerts
- Engulfing detector
- Visibility Filters
- Old zones (broken levels or trend changes)
- Highlight of Nested zones
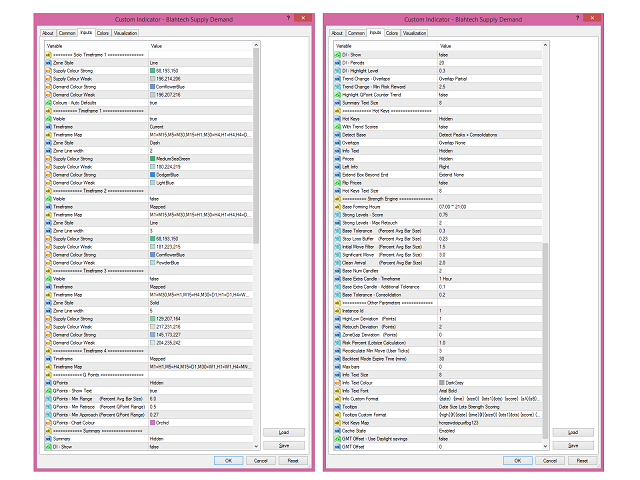
Input Parameters
- Download documentation using link above for details


5 Sterne, es hält was es verspricht, hilft wirklich sehr gut, es ist professionell bearbeitet.