Trend Liquidity
- Indicators
- Version: 1.0
- Activations: 5

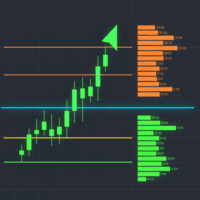
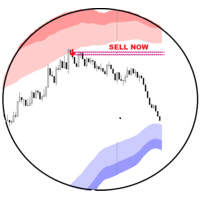
The Liquidity Sweep Filter is an institutional-grade Smart Money Concepts (SMC) & Order Flow indicator designed for MetaTrader 5. It tracks market trend direction using adaptive smoothed deviation bands while dynamically mapping resting stop-loss liquidity (Swing Highs and Swing Lows).
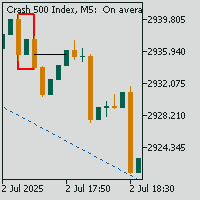
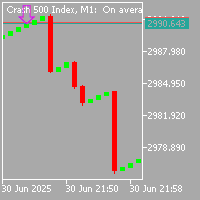
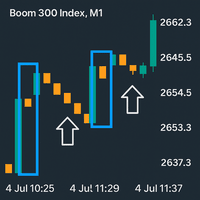
When price hunts and absorbs these liquidity pools, the indicator flags the event with on-chart Sweep Dots, measures the absorbed volume via Volume Badges, and displays an anchored Volume Profile for the current market cycle.
How the Engine Works
-
Double-Smoothed Trend Filter:
-
Calculates an initial Exponential Moving Average (EMA), followed by a Simple Moving Average (SMA) of that EMA.
-
Creates an envelope using Mean Absolute Deviation smoothed over Length × 3.
-
A breakout above the upper band establishes a bullish trend; a breakdown below the lower band establishes a bearish trend.
-
-
Swing Liquidity Pool Detection:
-
In a downtrend, whenever a 3-bar swing high forms beneath the upper band, a red horizontal liquidity level is created and tracked.
-
In an uptrend, whenever a 3-bar swing low forms above the lower band, a green horizontal liquidity level is created and tracked.
-
-
Sweep Absorption & Volume Normalization:
-
When price pierces an active liquidity line, the line terminates (swept).
-
The volume of the swept candle is normalized (
0 − 100 % 0−100%
) against rolling volume history. -
If normalized volume exceeds the Major Sweep Threshold (default 50), it is classified as a Strong Sweep (large institutions absorbed stops).
-
-
Dynamic Trend-Anchored Volume Profile:
-
Automatically isolates the bars from the most recent trend flip to the current candle.
-
Bins the volume across price tiers to visually highlight where smart money accumulated or distributed.
-
How to Trade With This Indicator
1. Trend-Continuation Pullback (Highest Win Rate)
-
Bullish Setup:
-
Main trend is Green (trend > 0).
-
Price pulls back into a green horizontal liquidity line or near the lower band.
-
A Green Sweep Dot (●) forms below a candle, showing that retail sell-stops were swept and bought up.
-
Look for a long entry with a stop below the sweep wick.
-
-
Bearish Setup:
-
Main trend is Red (trend < 0).
-
Price retraces up toward a red horizontal liquidity line or near the upper band.
-
A Red Sweep Dot (●) forms above a candle, showing buy-stops were hunted.
-
Look for a short entry with a stop above the sweep wick.
-
2. Exhaustion / Counter-Trend Reversal
-
When multiple Strong Sweeps occur consecutively with massive volume text tags (e.g., > 1.0M) without moving price further in that direction, this signals climax absorption, often preceding a major trend change (▲ or ▼ arrow).