BlueprintQuant Structural Break Scanner MT5
- Indicators
-
Patrick Murimi Njoroge
 Quantitative researcher building production-grade ML pipelines for MetaTrader 5.
Author of the "MetaTrader 5 Machine Learning Blueprint" (20+ parts) and
"Feature Engineering for ML" series on MQL5 Community — the most comprehensive - Version: 2.20
- Updated: 6 August 2026
- Activations: 5
A mean-reversion system and a trend-following system fail under opposite conditions. Knowing which condition the market is currently in is a statistical question, not a matter of opinion.
The Structural Break Scanner classifies every symbol on your watch list into one of three regimes and tells you how much evidence supports that classification. It applies five structural break tests from the econometrics literature, reports the result as a plain label rather than a wall of numbers, and alerts you when a symbol changes regime.
The three regimes
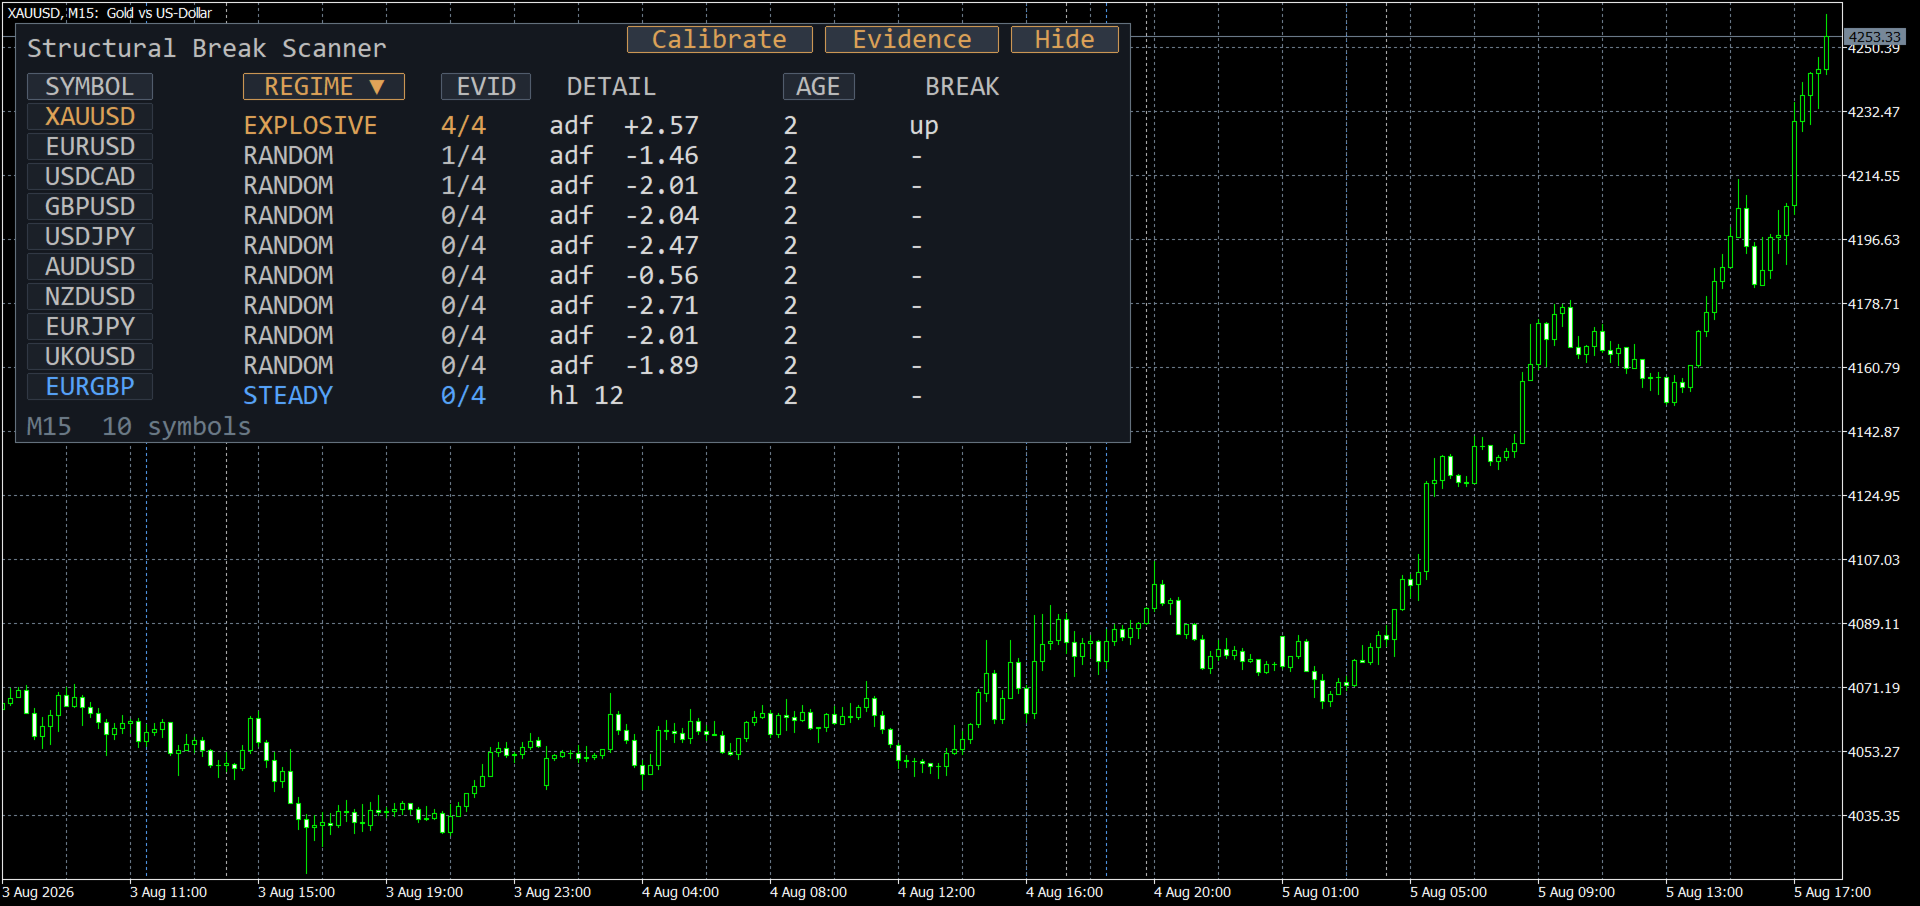
- STEADY. The series is mean-reverting. Deviations tend to be corrected. The panel also reports the estimated half-life in bars, so you know whether reversion is fast enough to be worth trading.
- RANDOM. The series behaves like a random walk. Neither mean reversion nor trend persistence has statistical support here.
- EXPLOSIVE. The series shows trending or bubble-like behavior, where deviations tend to grow rather than correct.
Classification is driven by the Augmented Dickey-Fuller statistic computed over the whole evaluation window. The default STEADY threshold of -2.86 is the standard five percent Dickey-Fuller critical value, not an arbitrary round number, and every threshold can be overridden per symbol.
Evidence, not just a label
Each row shows a confluence count, such as 3/4, indicating how many independent tests corroborate the classification. Two symbols can both read EXPLOSIVE with one and four supporting tests respectively, and that difference matters. The scanner reports it rather than hiding it inside a single blended score.
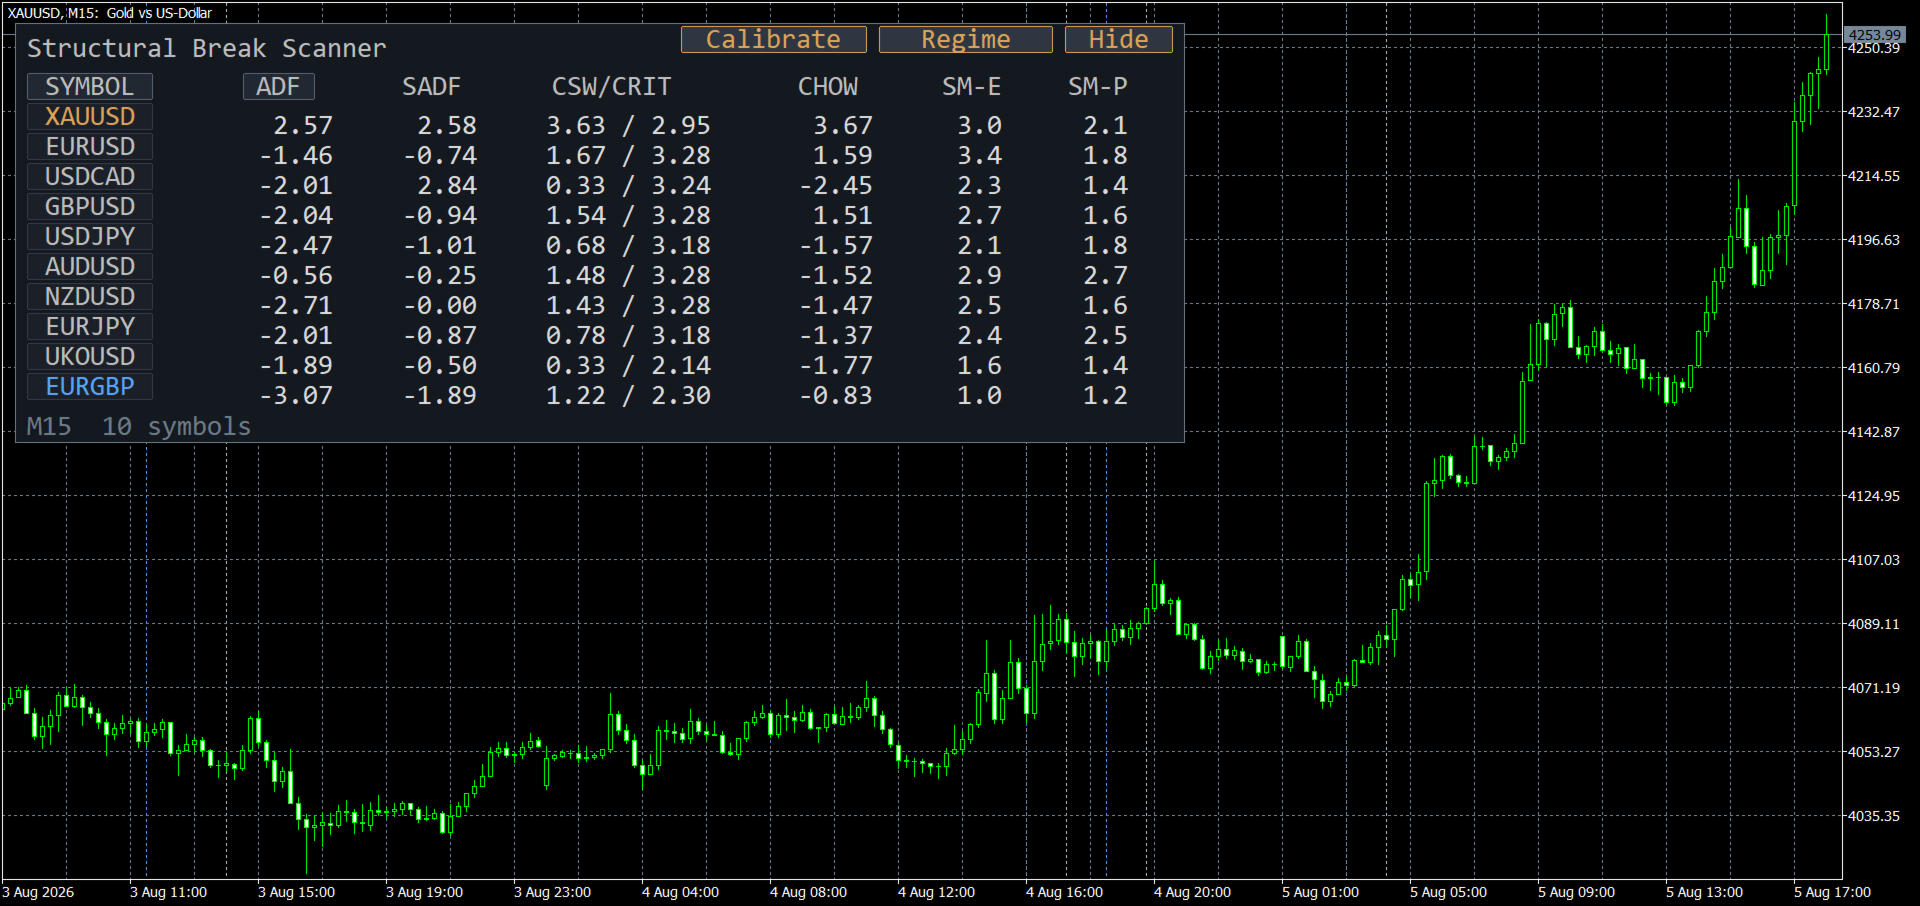
The four supporting tests are the Chu-Stinchcombe-White CUSUM test, the Chow-Type Dickey-Fuller test for a break at an unknown date, the Supremum Augmented Dickey-Fuller test, and the sub-martingale and super-martingale trajectory tests. Switch the panel to Evidence mode to see every raw statistic behind the classification.
Threshold calibration
Regime thresholds are not universal. A value that indicates explosive behavior on one instrument can be unremarkable on another. Press Calibrate on the panel and the scanner sweeps your history, builds the empirical distribution of the test statistic for each symbol, and derives per-symbol thresholds from percentiles of that distribution. Progress is shown on the panel and the sweep can be cancelled at any point.
The new thresholds are adopted as soon as the sweep finishes. The journal reports what percentage of history each regime would have occupied under them, so you can confirm that EXPLOSIVE remains a rare state rather than a constant one. If you never calibrate, the scanner uses published critical values instead, so it works before you configure anything.
What it is not
- It is not an Expert Advisor and places no trades.
- It does not predict direction and makes no claim about the profitability of trading regime changes.
- It does not repaint. With the default setting the tests evaluate completed bars only, so a value does not change after the fact.
Panel
Regime mode shows one row per symbol with the regime, the confluence count, the half-life or current statistic, the time since the last regime change, and whether a break is currently active with its direction. Evidence mode shows the raw statistics for all five tests.
Click any column header to sort by it, and click again to reverse the order. The default sort places EXPLOSIVE symbols first, so the symbols worth attention are always at the top of a long list. Click a symbol to switch the chart to it. The panel collapses to a single title bar when you need the chart clear.
Features
- Scans an explicit symbol list or every symbol in Market Watch, on any timeframe, independent of the chart symbol.
- Broker suffix handling, so a list written as EURUSD works on an account where the instrument is EURUSD.m or similar.
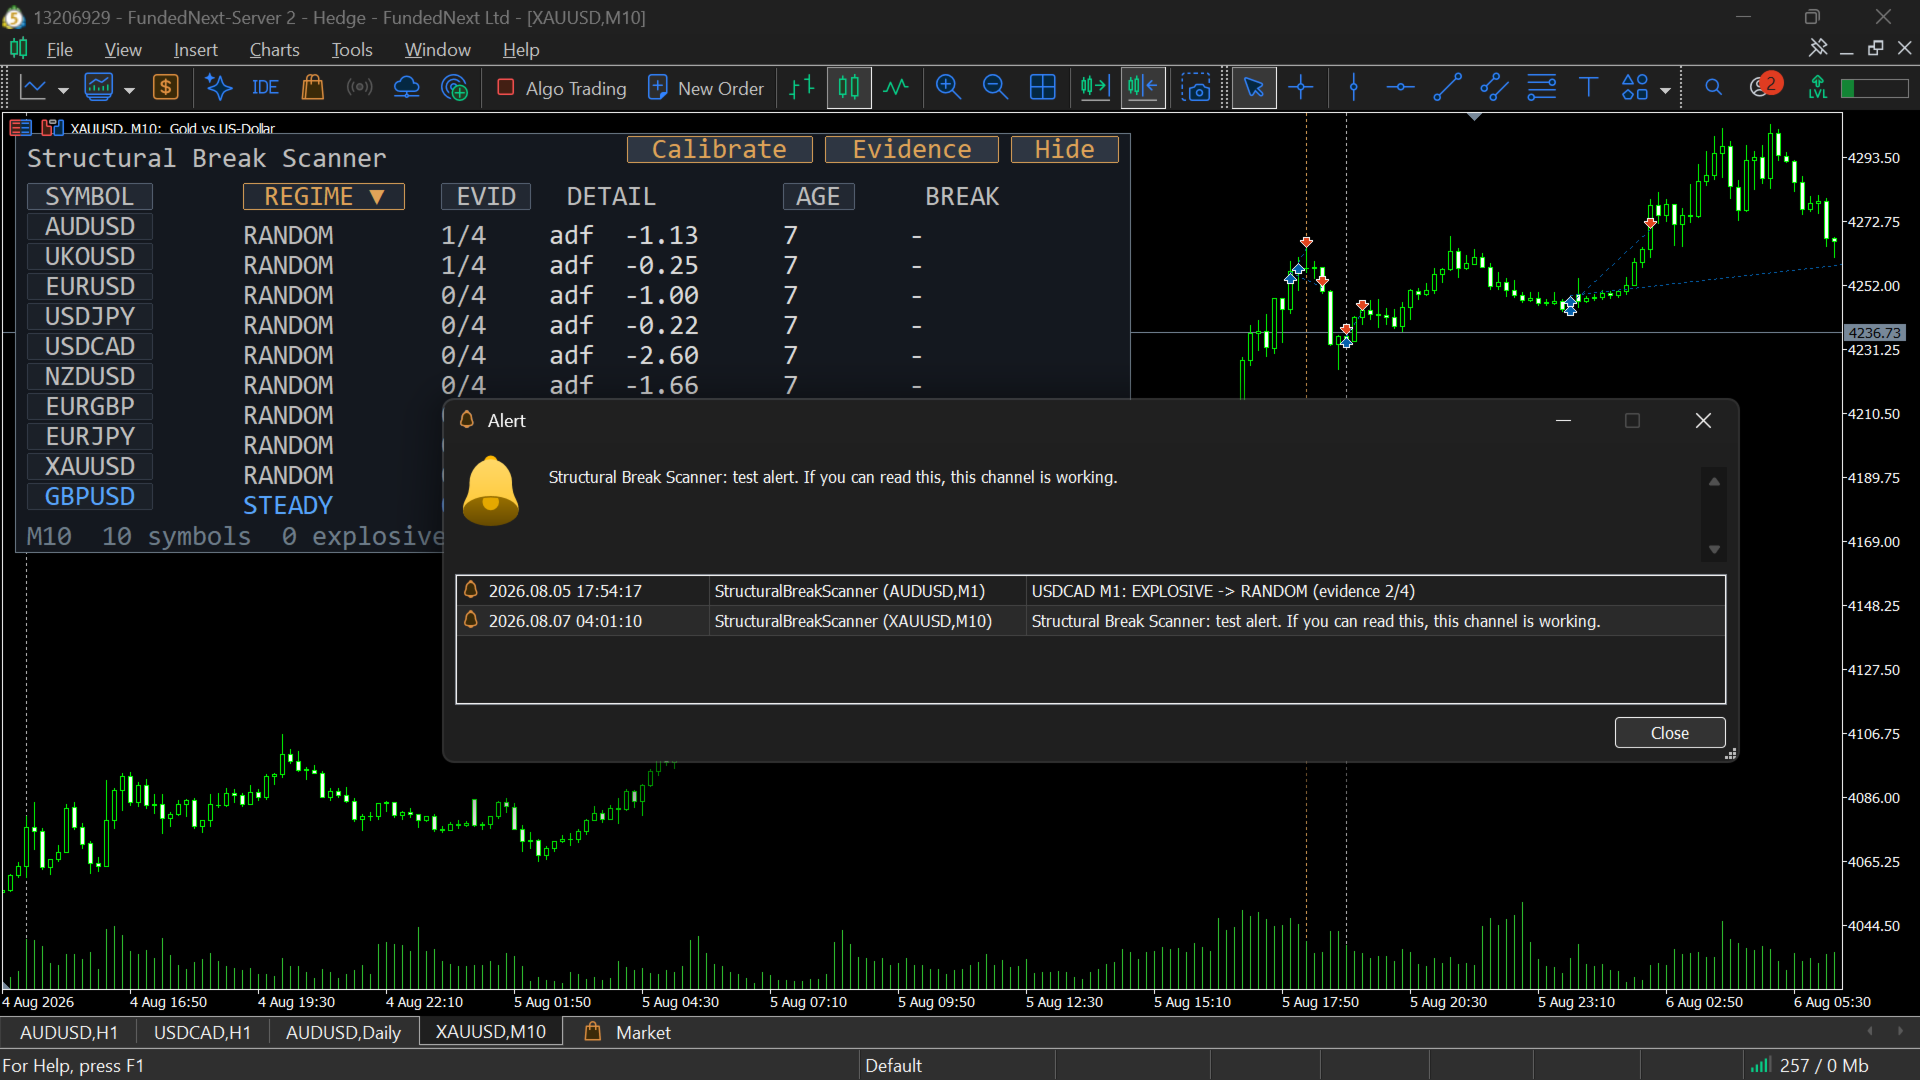
- Alerts tell you when a symbol changes regime, not that it is in one. A symbol that turns explosive and stays that way for three days produces one alert, not three days of them.
- A new regime must persist for several consecutive scans before it counts as a change, so a reading that jitters across a threshold does not generate alerts.
- Alerts also require a configurable level of corroborating evidence, and each symbol has its own re-arm interval. Delivery is by terminal popup, push notification to the MetaTrader mobile application, and email, each switchable independently.
- Threshold calibration runs inside the panel, in the background, without freezing the terminal or requiring any additional file.
- Individual tests can be disabled, and computation for a disabled test is skipped entirely.
- Scanning is spread across refresh cycles rather than processing every symbol at once, so a large watch list does not stall the terminal.
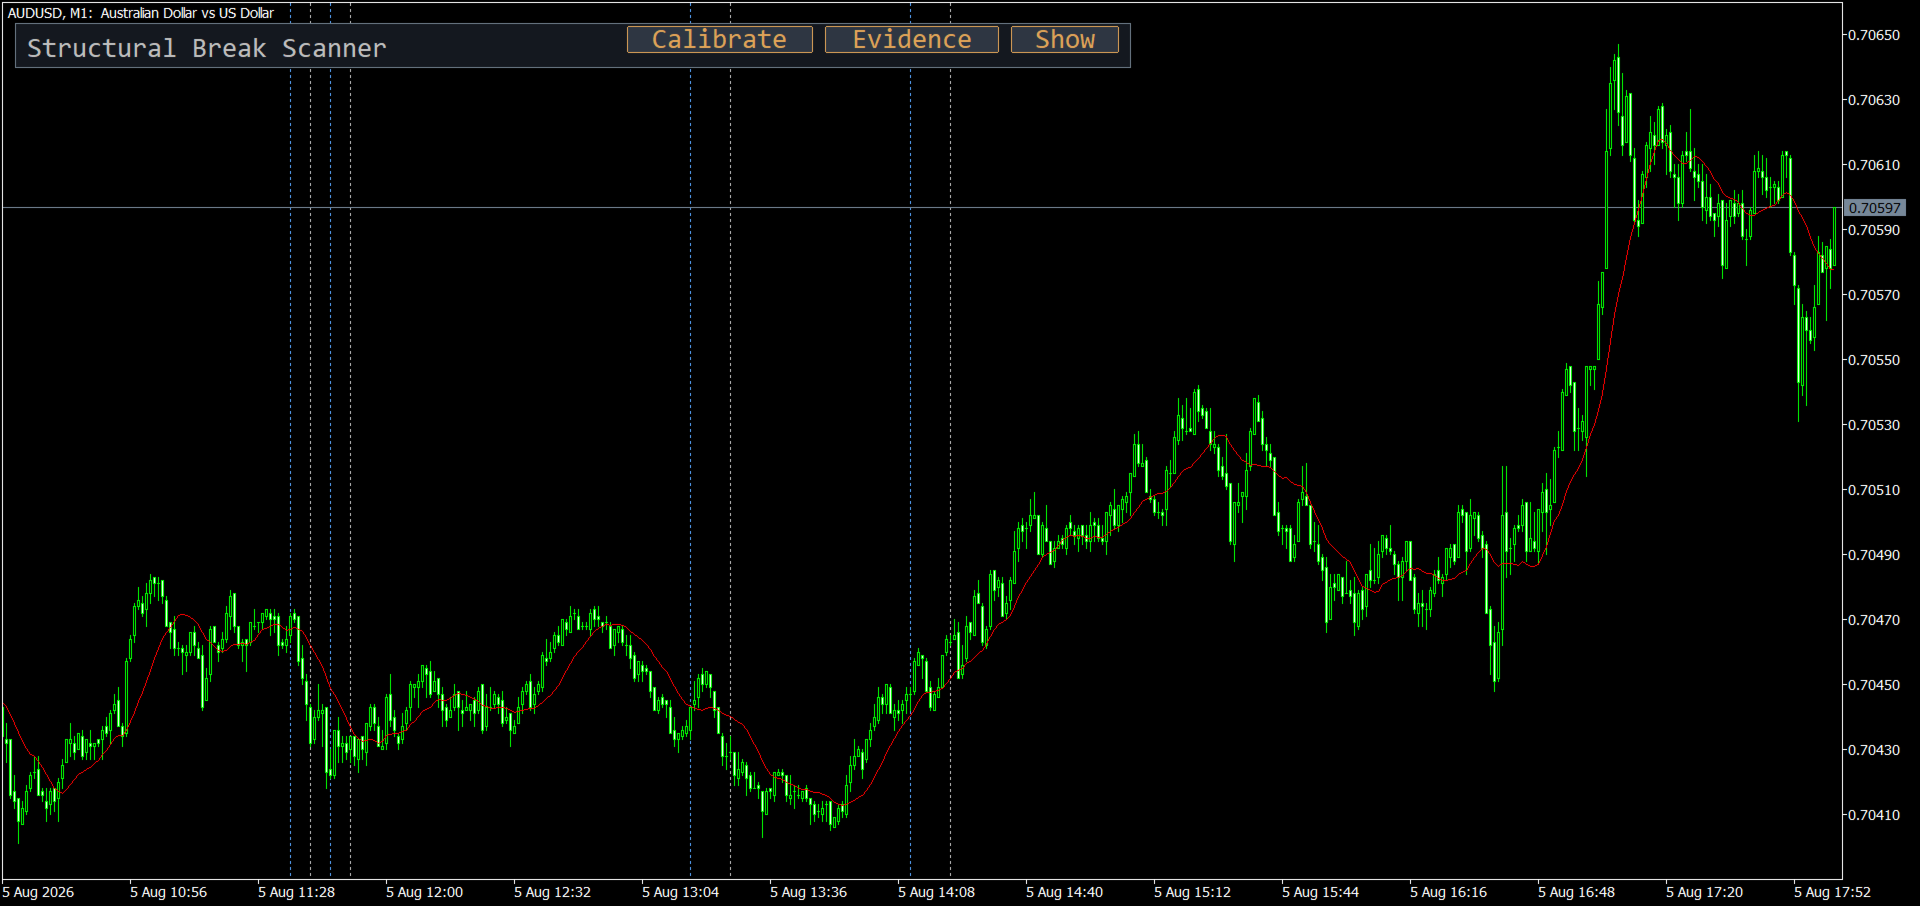
- Optional vertical markers on the chart at past regime changes, so you can see whether the classification lands where price behavior visibly changed.
- Optional export of the current scan to a comma-separated file.
Method and honest limits
The tests are drawn from the structural break literature: Chu, Stinchcombe and White as developed for financial series by Homm and Breitung (2012); the Chow-Type test following Chow (1960) and Andrews (1993); the Supremum Augmented Dickey-Fuller test of Phillips, Wu and Yu (2011) and Phillips, Shi and Yu (2015). All five are discussed in Lopez de Prado, Advances in Financial Machine Learning (2018), chapter 17.
One limitation is worth stating plainly rather than leaving buried. Several of these tests take a supremum over many candidate break points, which raises the effective false-positive rate above the nominal significance level. Read the confluence count as strength of evidence, not as a calibrated probability. Four supporting tests is meaningfully stronger than one. Neither is a promise.
Every statistic was verified against an independent implementation in Python before release, agreeing to within numerical precision on reference series.
Documentation
The full user manual is published here: Structural Break Scanner: setup, parameters, and threshold calibration. It covers every input parameter, the calibration workflow, how to read the confluence count, and what each regime means in practice.
About the author and the research behind this product
I am a quantitative developer publishing on machine learning, feature engineering, and market microstructure for MetaTrader 5. This product did not begin as a product. It began as two published articles in which I derived these five structural break tests, implemented them, and cross-checked one implementation against the other.
- Structural break tests implemented in Python, covering the CUSUM, Chow-Type, Supremum ADF, and martingale tests with the reference implementation.
- The same tests ported to MQL5, verified against the Python reference to numerical agreement.
Both articles include their full source code, free to anyone. That code computes the statistics on a single chart and returns raw numbers. This product is the layer above it: regime classification, half-life estimation, evidence counting, empirical calibration, multi-symbol scanning, and alerting. If you want to understand the mathematics, read the articles first. They cost nothing and they are the honest foundation of everything here.
Support
Questions and problem reports are welcome through the product comments or a private message. Reproducible issues are fixed in an update.