LC Reference Level Structure Visualizer
- Indicators
- Version: 1.0

Reference Level Structure Visualizer is a technical analysis indicator for MetaTrader 5.
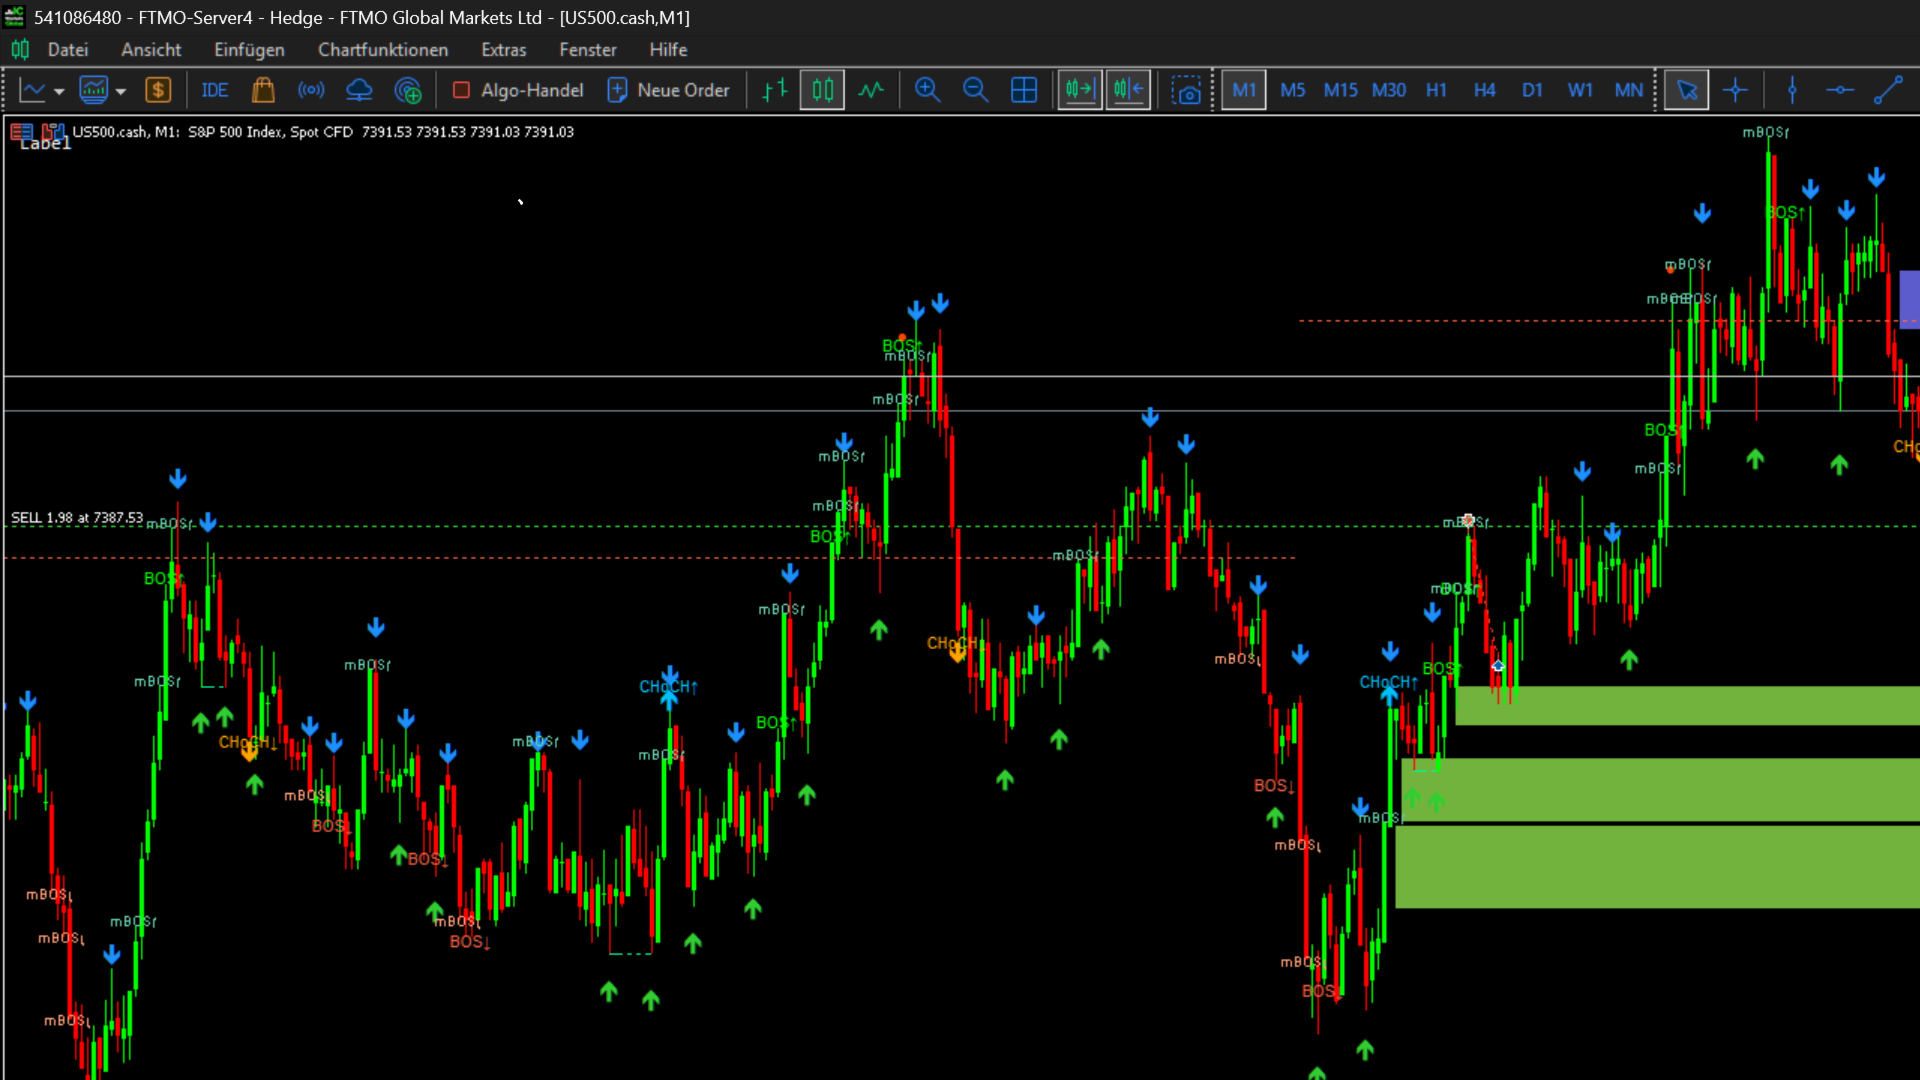
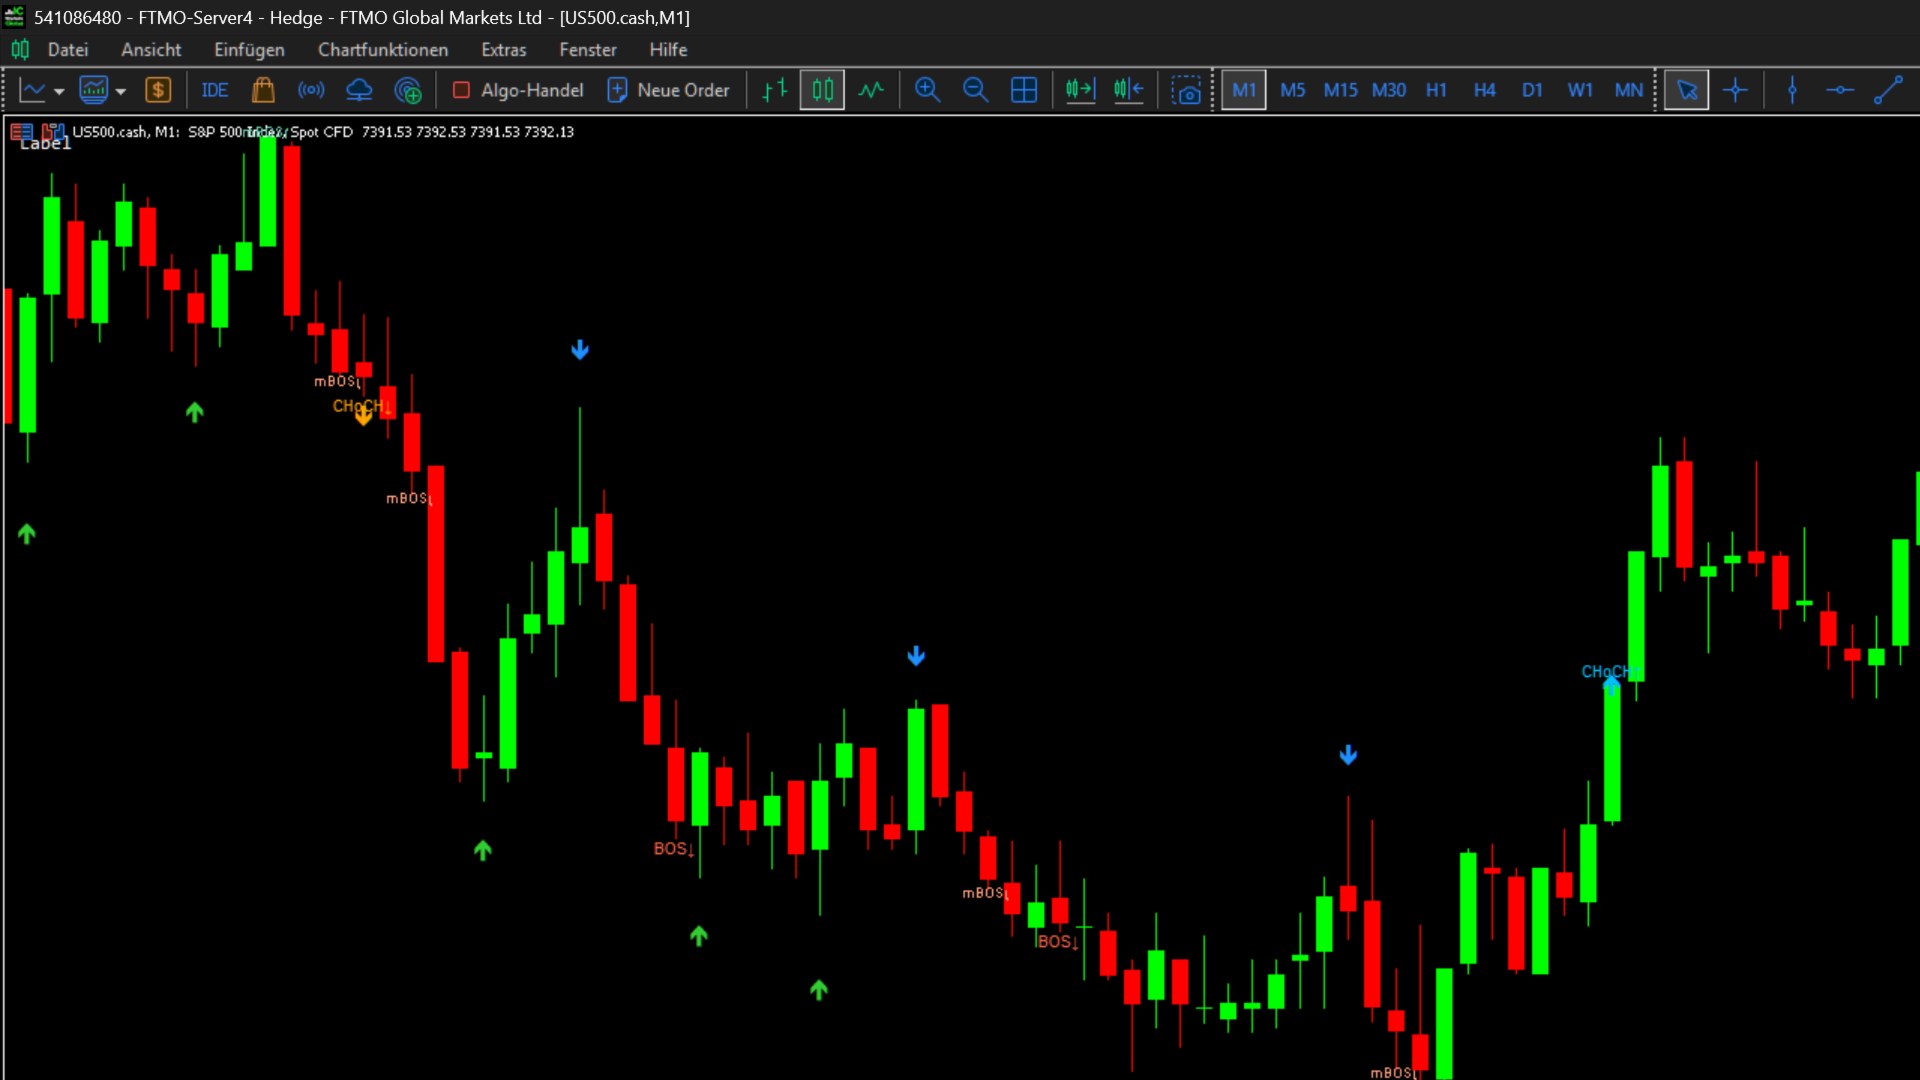
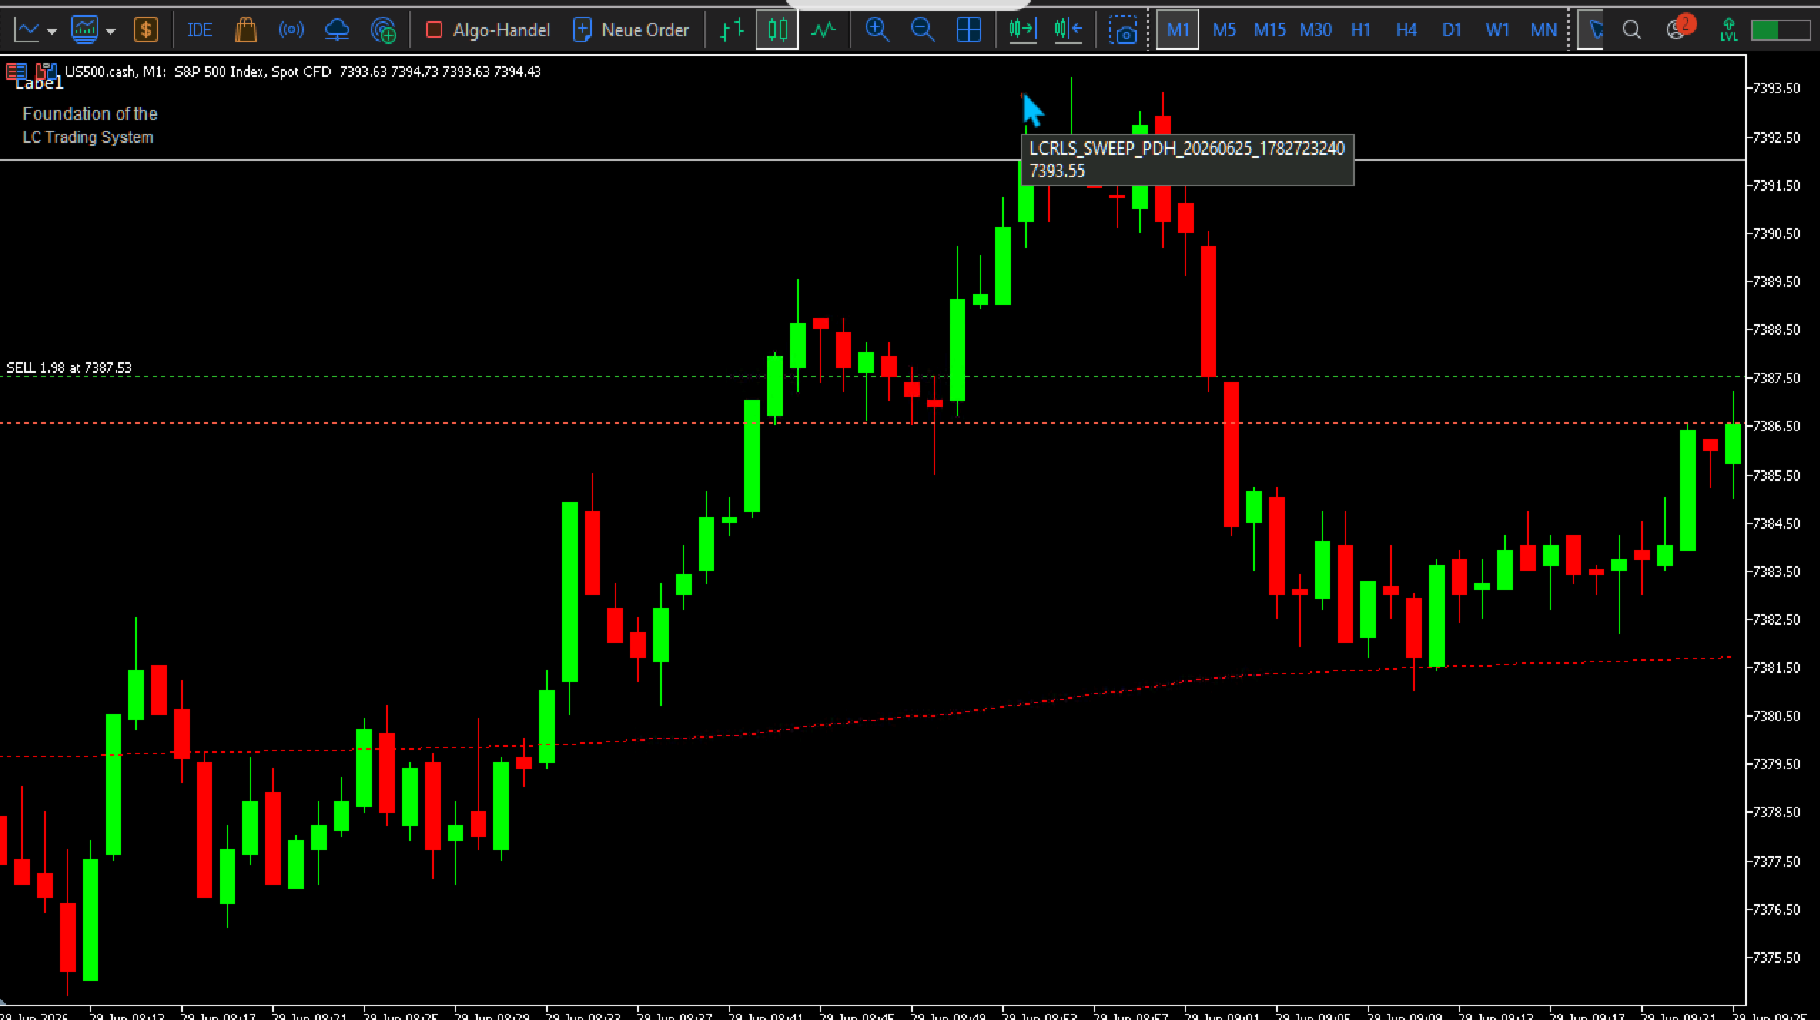
It is designed for intraday chart observation and visualizes previous session levels, daily levels, liquidity sweeps, later reclaims and M1-based market structure directly on the chart.
The indicator does not open trades, place orders or manage positions.
Smart Money Concepts Context
The indicator visualizes several commonly used Smart Money Concepts (SMC) elements, including liquidity sweeps, Break of Structure, Change of Character, Micro Break of Structure, Fair Value Gaps, Equal Highs and Equal Lows, and previous session or daily liquidity levels.
It is designed as a structured chart visualization tool for traders who use price action and Smart Money Concepts in intraday analysis.
Reference Levels
The indicator displays important previous session and daily reference levels:
-
Previous Asia High and Low
-
Previous London High and Low
-
Previous New York High and Low
-
Previous Day High and Low
These levels provide structured reference points for intraday market observation.
Sweep and Reclaim
A sweep is marked when price first moves beyond an active reference level with its wick.
For a high level, the candle high moves above the level.
For a low level, the candle low moves below the level.
A reclaim can be marked only after price first closes outside the level and a later M1 candle closes back to the original side of that level.
Same-bar reclaims are not used.
Market Structure
The indicator visualizes the following M1-based market structure elements:
-
Change of Character
-
Break of Structure
-
Micro Break of Structure
-
Swings
-
Equal Highs and Equal Lows
-
Fair Value Gaps
To improve chart readability, simultaneous standard M1 structure events use the following visual priority:
Change of Character > Break of Structure > Micro Break of Structure
This rule affects chart rendering only. The underlying detected events remain internally available.
Recommended Chart Timeframes
The indicator is currently designed and optimized for the M1 chart.
All market structure and Fair Value Gap calculations are based on M1 price data. The current marker logic is intended for the fine structure of the 1-minute timeframe.
Higher chart timeframes such as M5, M15 and above are currently not recommended. On these timeframes, multiple M1-based markers and objects can appear in the same visible chart area, which may reduce chart clarity and may not accurately match the higher-timeframe context.
For the intended use and best chart readability, please use this indicator on M1.
Fair Value Gaps on Higher Timeframes
Fair Value Gaps are calculated from M1 price data.
On higher chart timeframes, multiple different M1 Fair Value Gaps can visually overlap in the same chart area. This can reduce readability and may not provide the intended visual context.
For this reason, higher timeframe use is currently not recommended. Dedicated higher-timeframe support may be added in a future version after separate testing and adjustment.
Inputs
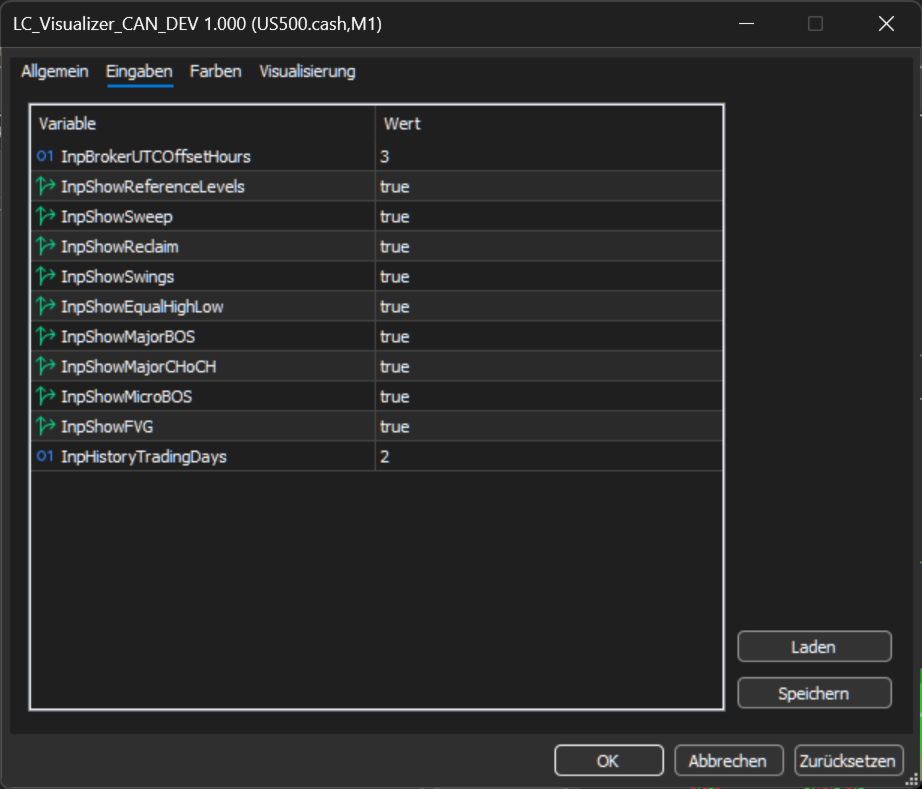
The main display groups can be enabled or disabled directly from the indicator inputs:
-
Reference Levels
-
Sweep
-
Reclaim
-
Swings
-
Equal High / Equal Low
-
Major Break of Structure
-
Major Change of Character
-
Micro Break of Structure
-
Fair Value Gaps
-
History Trading Days
The default History Trading Days value is 2 for faster intraday use. Increase it only when additional historical context is required.
Important Note
This indicator is intended for technical chart analysis and market observation only.
It does not provide financial advice and does not guarantee trading results. Every trading decision remains the responsibility of the user.
Development Note
This indicator is part of an ongoing development series focused on structured intraday market analysis and rule-based trading tools.
Future related tools may be released separately.