
CFTC R Dashboard
- Utilities
-
Cosmin Imbrea
 Algorithmic trading developer and active market participant with a focus on forex, commodities, and futures. Designs and builds Expert Advisors, indicators, and dashboards for MetaTrader 5, Sierra Chart — emphasizing Supply/Demand zone detection, institutional positioning, and Commitments of Traders
 - Version: 16.0
- Updated: 25 September 2026
- Activations: 5
CFTC R Dashboard puts the weekly CFTC Commitments of Traders (COT) report on your MetaTrader 5 chart. Attach it to any chart: it finds the matching markets, downloads the official CFTC data and shows four years of positioning in one panel. No CSV files, no copy-paste, no API key. It is a utility: it never opens, changes or closes trades.
A new report comes out every Friday (positions as of Tuesday). The dashboard picks it up by itself.
WHAT YOU SEE
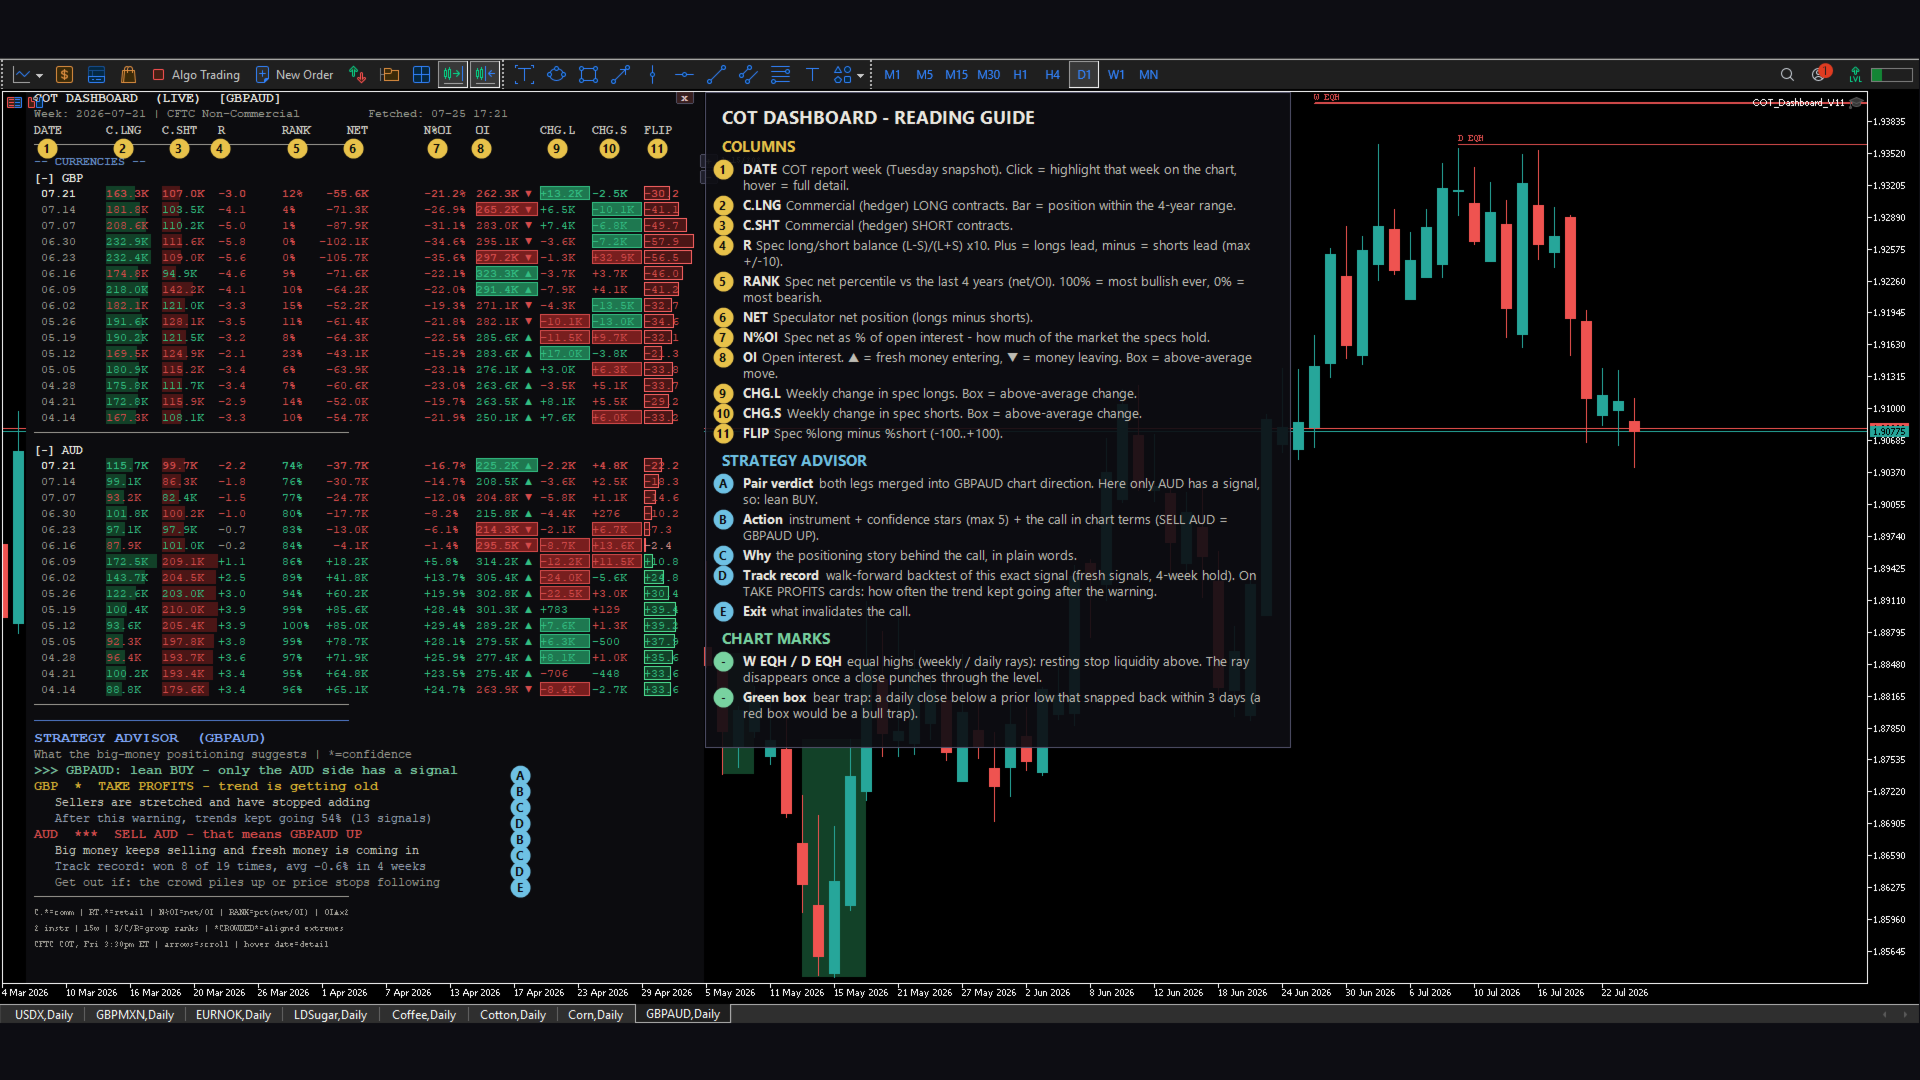
- Large speculators (funds): longs, shorts, net and weekly changes, with bars
- Commercials (hedgers): longs and shorts
- RANK: today's net against the last 4 years (0% = most short, 100% = most long)
- CONV: who is in charge, longs or shorts, from -10 to +10
- N%OI and OI: net as a share of open interest, and whether open interest rose or fell
- Boxes on unusually large weekly changes, and on RANK stuck at an extreme 3 weeks or more
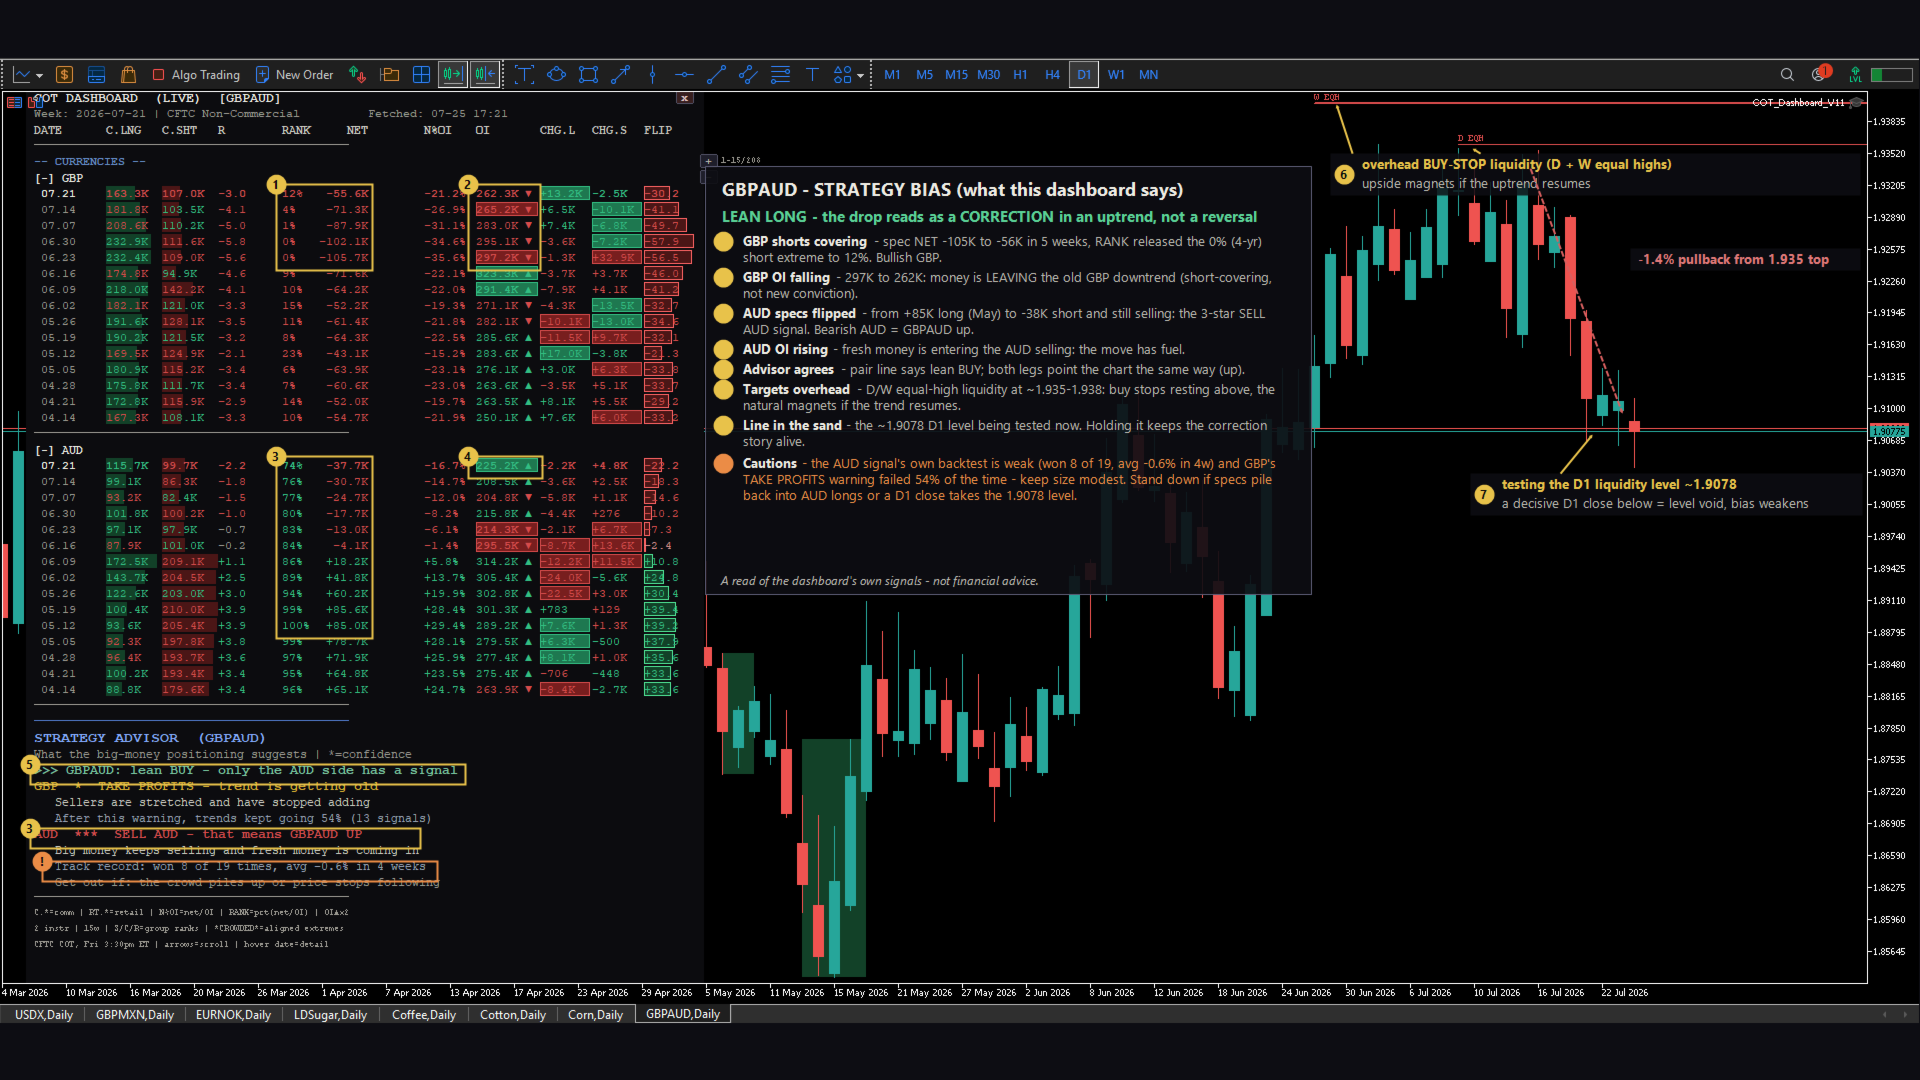
- Both sides of a pair: on EURUSD you see the Euro and the US Dollar Index
THE ADVISOR: ONE RULE, MEASURED
Most COT "reversal signals" failed when tested on CFTC data from 1986 to 2026. One rule passed, so the advisor shows only that rule:
- QUIET: nothing worth saying (about 3 weeks in 4)
- NO FUEL: speculators closed one side and no above-average new money replaced them. The move is traders leaving, not traders committing, so lean against it.
On the FX majors, NO FUEL averaged +0.14% after 2 weeks and +0.18% after 4 weeks, positive in both halves of the history and in all 7 currencies. A small lean, not a trading system. Hover it to see its track record.
THE MAP (press N)
One row per market: total longs and shorts against their 2-year average, the 4-week build in net against its normal size, and the 4-week price move. Currencies also show their measured 26-week result (FX only: the same setup measured negative in metals and crypto).
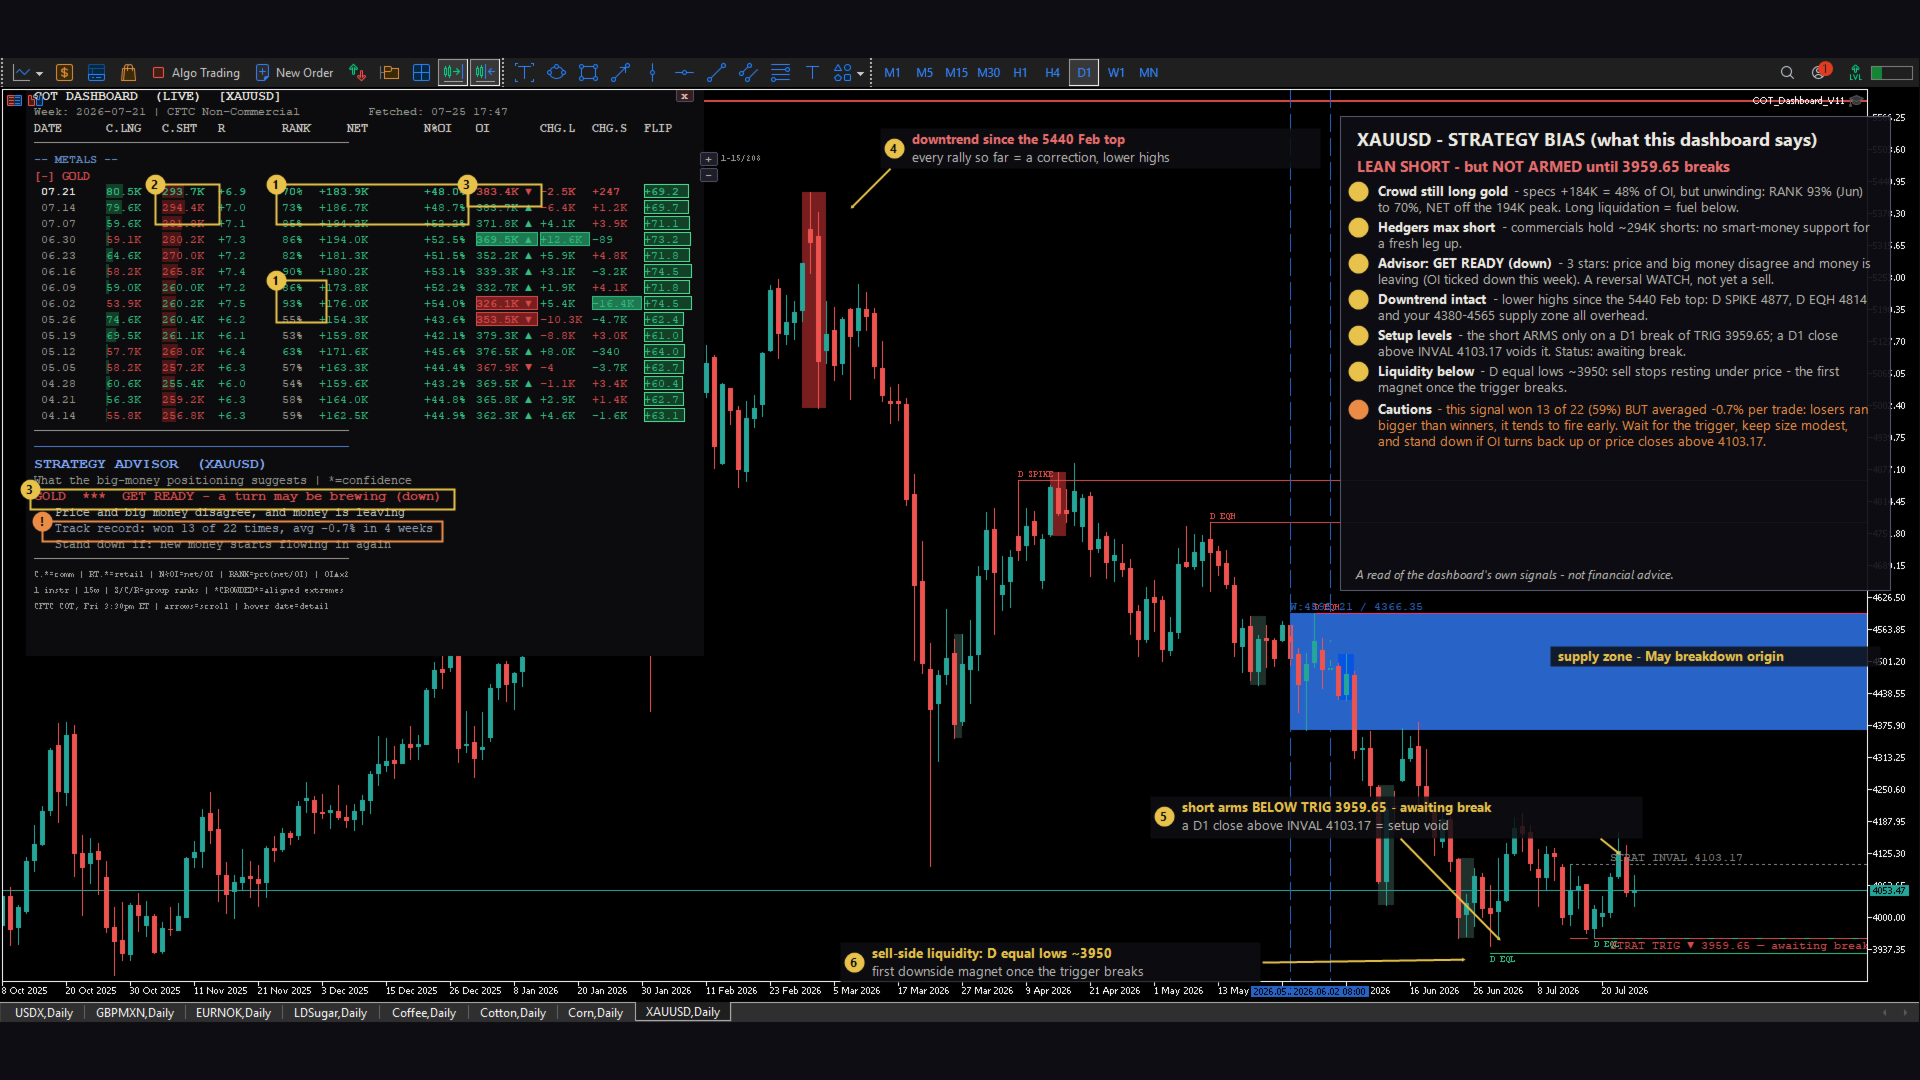
ON THE PRICE CHART
- Fakeout boxes: a daily break of the last high or low that failed within 3 days
- Liquidity rays: equal highs/lows and big spikes, daily and weekly
- Break read: after a level breaks, did longs or shorts give up?
- Roll zone: weeks when open interest drops because futures roll over, not because traders changed their minds
TWO COURSES BUILT IN
Click [?] and every column, line and box explains itself. [COURSE I] and [COURSE II] save two full illustrated courses to your computer: how to read the dashboard, and how to trade with it.
49 MARKETS
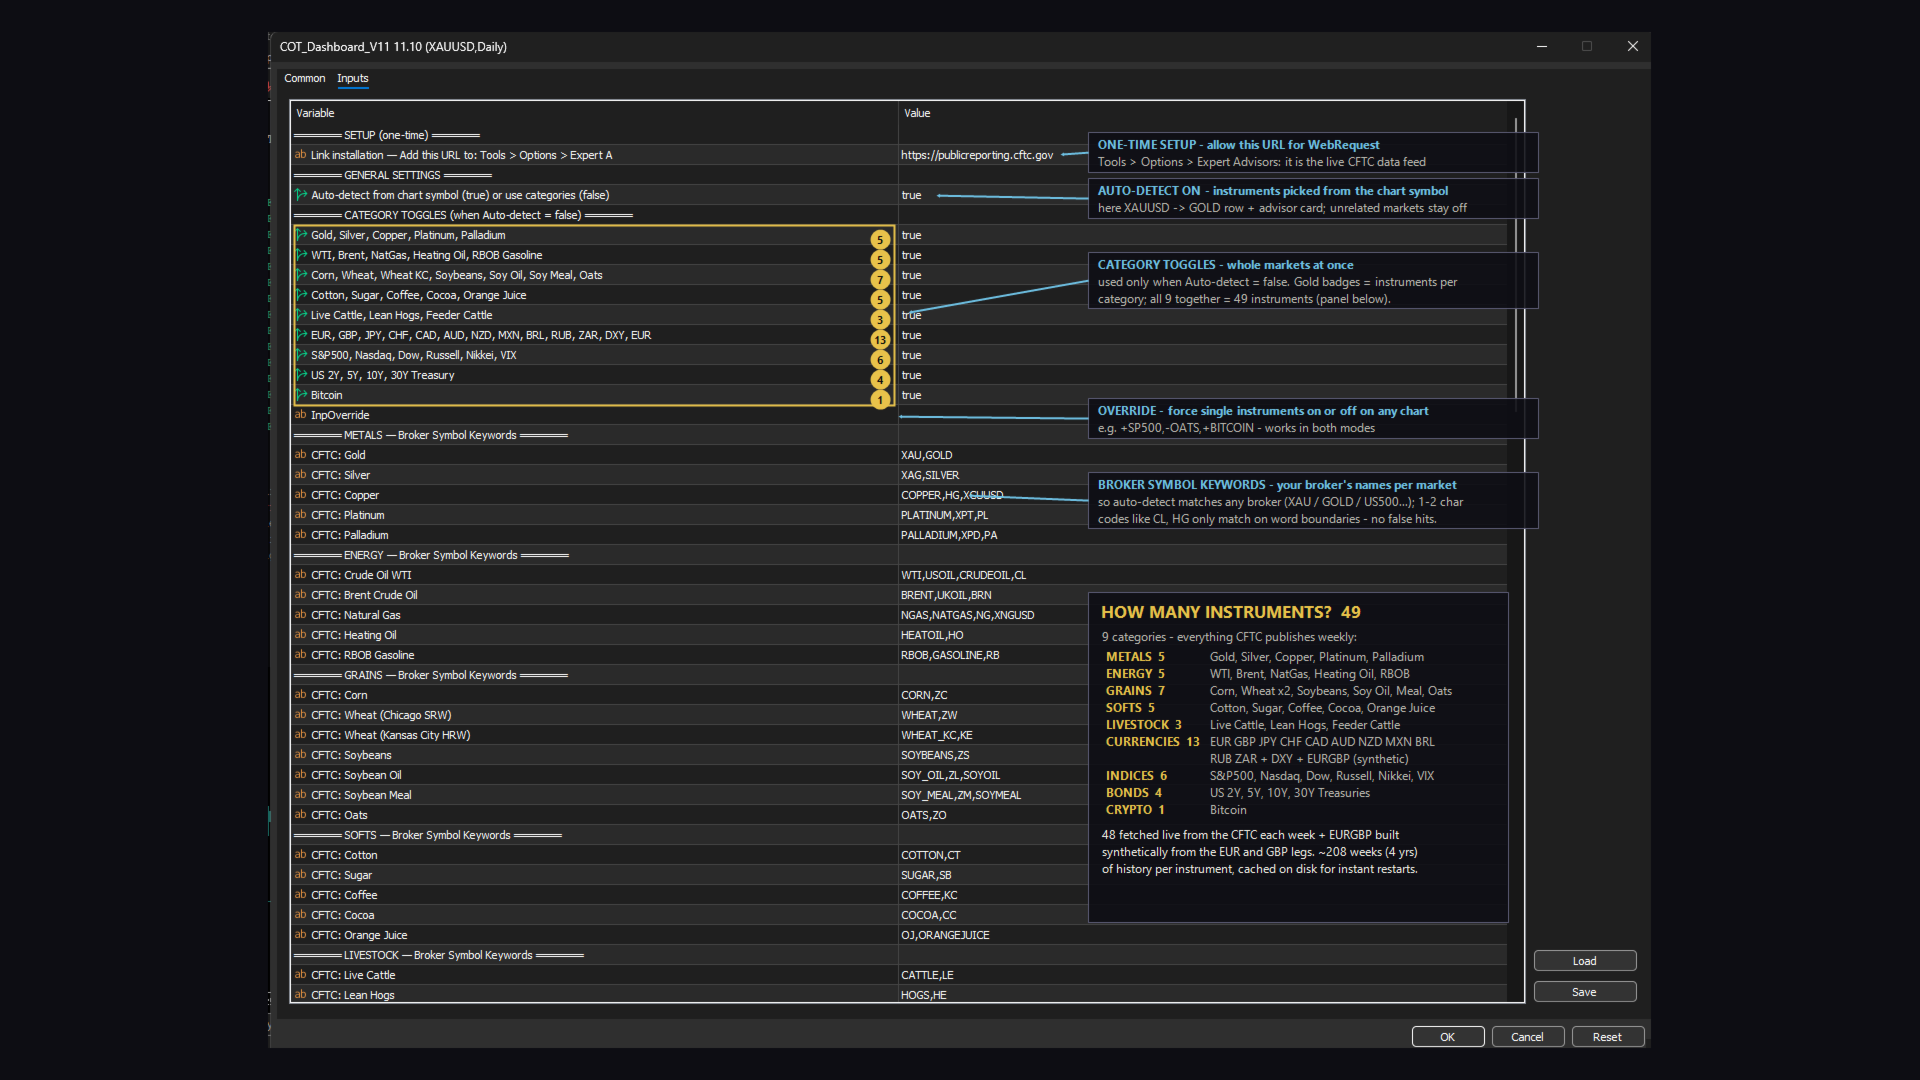
Metals: Gold, Silver, Copper, Platinum, Palladium
Energy: WTI, Brent, Natural Gas, Heating Oil, Gasoline
Grains: Corn, Wheat, KC Wheat, Soybeans, Soy Oil, Soy Meal, Oats
Softs: Cotton, Sugar, Coffee, Cocoa, Orange Juice
Livestock: Live Cattle, Lean Hogs, Feeder Cattle
Currencies: EUR, GBP, JPY, CHF, CAD, AUD, NZD, MXN, BRL, ZAR, US Dollar Index
Indices: S&P 500, Nasdaq 100, Dow, Russell 2000, Nikkei 225, VIX
Bonds: US 2, 5, 10 and 30-year
Crypto: Bitcoin
Each market has a keyword list in the inputs (gold: XAU, GOLD), so it works with any broker.
SETUP (one time)
1. Tools > Options > Expert Advisors: tick "Allow WebRequest for listed URL" and add https://publicreporting.cftc.gov
2. Attach to any chart. The first load can take a few minutes; later starts use the saved copy.
GOOD TO KNOW
- The Strategy Tester has no internet, so the demo cannot load CFTC data. To see real data, use the free COT Dashboard Preview (3 markets) or rent for one month.
- COT data is weekly. It shows who is positioned where; it does not time entries.
- Not trading advice. Not affiliated with the CFTC.








































User didn't leave any comment to the rating