Volume Delta MT4
- Indicators
-
Mariusz Franciszek Szczepanczyk
 I have been trading since 2005. Over the years I have built my own set of tools because I could not find what I actually needed on the market. Not magic entry signals. Not promises. Just clean, reliable trade management that works while I am away from the screen.
 - Version: 1.15
- Updated: 2 May 2026
- Activations: 5
Volume Delta MT4 is a professional order flow indicator for MetaTrader 4 designed to visualize buying and selling pressure through two real-time monitoring panels. The indicator calculates delta as the difference between aggressive buying and selling pressure based on candle structure and tick volume, providing a clear view of market dominance without cluttering the chart.
The indicator works on all symbols and timeframes, including Forex, indices, commodities, crypto and stocks. It is fully compatible with all account types, works on live and demo accounts, and is optimized for stable performance without overloading CPU resources. All calculations are efficient and performed only on necessary bars, ensuring smooth operation even on lower-spec VPS environments.
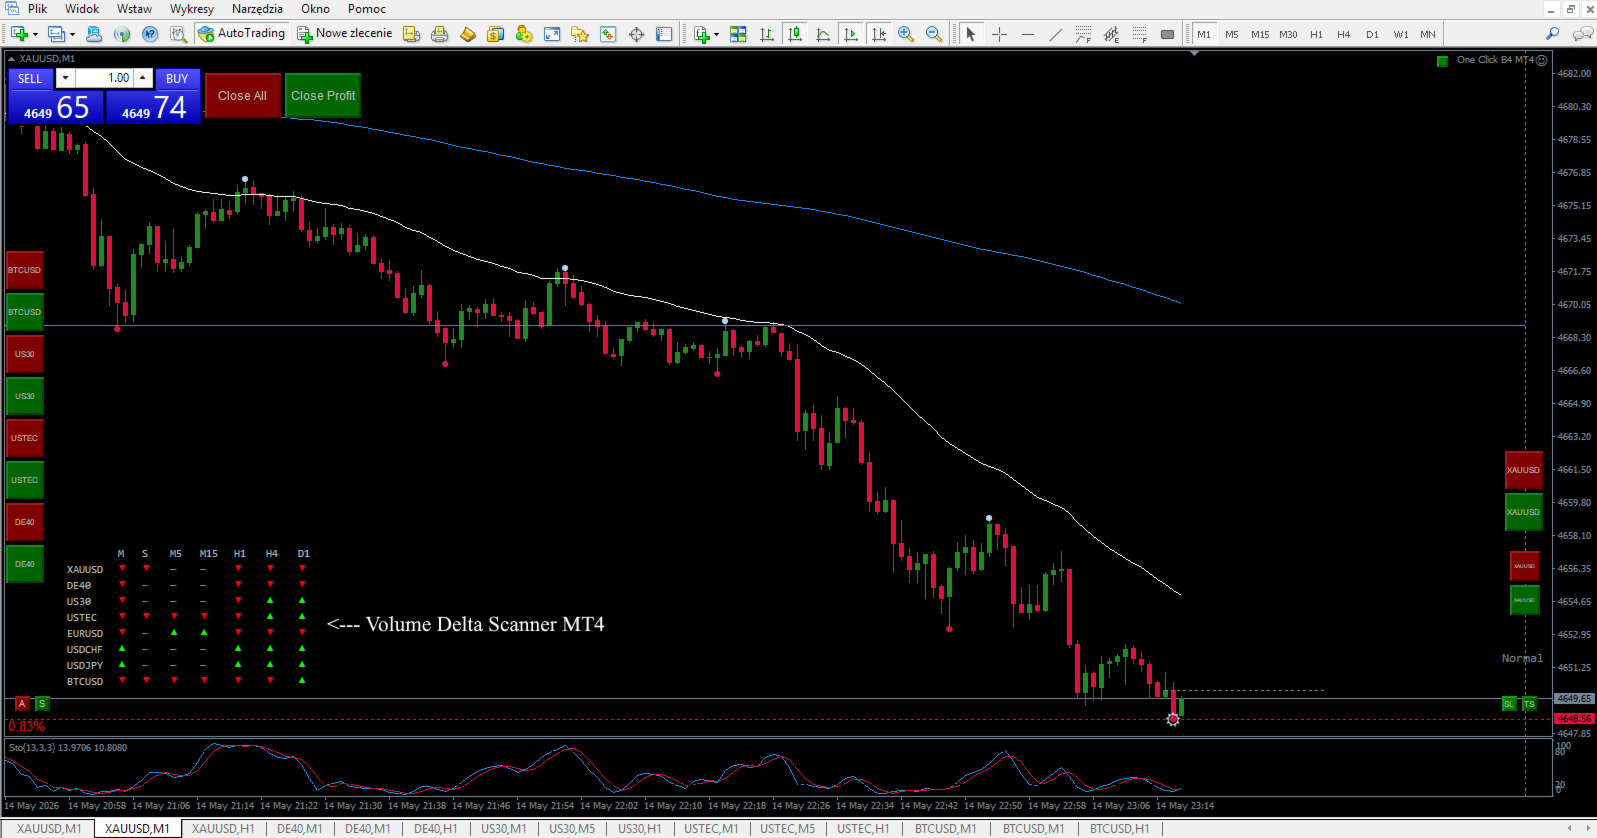
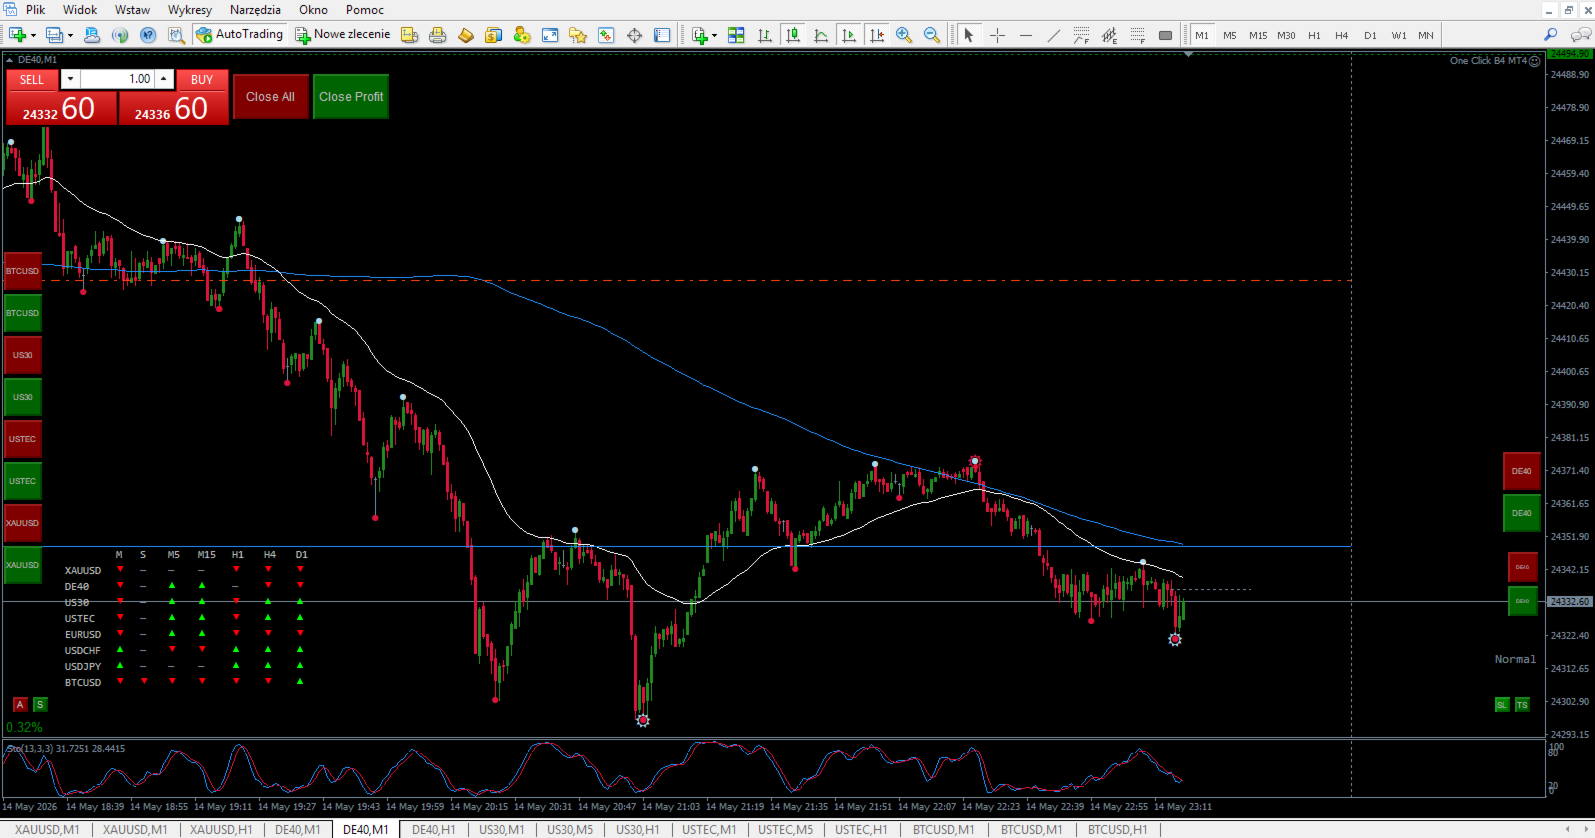
Volume Delta displays market conditions through two independent monitoring panels. The Delta Monitor panel shows current delta value, threshold level, volume and market status in detailed format. The Status Label panel displays simplified market conditions (BUY, SELL, Normal) using large customizable text for quick visual reference at a glance.
The DeltaThreshold parameter allows the user to define the sensitivity of the indicator according to their own strategy. Lower values generate more signals and higher responsiveness. Higher values filter weaker imbalances and reduce signal frequency. This makes the indicator adaptable to scalping, intraday trading and swing trading.
Optional BUY/SELL alerts can be enabled when delta exceeds the defined threshold on the current candle. Alerts are controlled to prevent repetition on the same bar.
Both monitoring panels can be enabled or disabled independently, repositioned to any chart corner and fully customized in terms of font size and text color. Panel 1 uses Consolas font for detailed numerical data. Panel 2 uses Arial Black font for bold status display.
The indicator supports Strategy Tester mode where delta is displayed as a color-coded histogram below the price chart for analytical and backtesting purposes.
Volume Delta MT4 is intended for traders who want to analyze real-time market pressure, confirm breakouts, detect exhaustion and identify volume imbalance trends in a clean and stable chart environment without visual distractions.
MULTI-TIMEFRAME CONFIRMATION STRATEGY
This indicator uses a single threshold across all timeframes, creating a natural strength filter that eliminates the need to adjust settings when changing timeframes.
HOW IT WORKS
The same threshold value produces different signal frequencies on different timeframes:
M1 Timeframe: Shows frequent signals. Short 1-minute candles reach the threshold more easily, making this timeframe ideal for precise entry timing.
M5 Timeframe: Shows moderate signals. 5-minute candles require more sustained volume pressure to trigger status changes. Use for short-term trend confirmation.
M15 Timeframe: Shows fewer signals. Volume imbalance must persist across a full 15-minute candle. Most reliable for intraday trading direction.
H1 Timeframe: Shows the fewest signals. Only strong, sustained buying or selling pressure throughout the full hour triggers status changes. Use for identifying the main trend direction.
The longer a higher timeframe maintains a BUY or SELL status, the stronger the trend. An M15 that displays BUY for 30 minutes indicates very strong buying pressure.
PROFESSIONAL TRADING SETUPS
Strong Setup (High Probability):
-
M15 panel shows BUY
-
M5 panel shows BUY
-
M1 panel shows BUY
-
Entry: Open LONG position
This alignment across all three timeframes indicates strong buying pressure with high probability of continuation.
Weak Setup (Low Probability – Avoid):
-
M1 panel shows BUY
-
M5 panel shows Normal
-
M15 panel shows Normal
-
Entry: Skip this signal
Isolated M1 signals without higher timeframe support are often false breakouts or market noise.
Conflicting Signals (Wait):
-
M15 panel shows BUY
-
M5 panel shows SELL
-
M1 panel shows SELL
-
Entry: Wait for alignment
Conflicting timeframes indicate either a correction within a larger trend or choppy market conditions. Wait for all timeframes to align before entering.
THRESHOLD RECOMMENDATIONS
Start with 100 for most instruments. Adjust based on instrument characteristics:
-
High volume instruments (Bitcoin, Ethereum): 200–300
-
Medium volume instruments (gold, indices, major forex): 100–150
-
Low volume instruments (minor forex pairs): 50–80
The key principle: set the threshold once and it works across all timeframes. No need to change settings when switching from M1 to M15 to H1.
WHY THIS APPROACH IS DIFFERENT
Most volume indicators require different settings for each timeframe. This creates confusion and forces traders to constantly adjust parameters.
This indicator solves that problem. One threshold setting automatically creates appropriate sensitivity for each timeframe. Higher timeframes naturally show fewer signals, representing stronger and more reliable trend confirmation. Lower timeframes naturally show more signals, providing precise entry timing.
Result: Clean multi-timeframe analysis without parameter adjustments.
PRACTICAL EXAMPLE
Set threshold to 100 and monitor XAUUSD on three charts simultaneously:
-
M1 chart: Shows 15–20 colored status changes per hour (responds to short-term volume spikes)
-
M5 chart: Shows 8–12 colored status changes per hour (sustained 5-minute trends)
-
M15 chart: Shows 2–3 colored status changes per hour (only strong, established trends)
When all three timeframes show BUY simultaneously, you have maximum confirmation for a LONG entry.
When only M1 shows BUY while M5 and M15 remain Normal, skip the signal — it lacks higher timeframe support.
TROUBLESHOOTING
Before anything else — after setting up the indicator and saving your final parameters, create a chart template with the instrument name. This way you can restore everything in seconds if needed.
If the indicator behaves unexpectedly or causes platform slowdowns, please note: these issues are not caused by this indicator. They are caused by accumulated data from previous chart configurations stored in your platform.
Follow these steps:
-
Go to Tools → Global Variables → delete all variables.
-
Go to File → Open Data Folder.
-
Close MetaTrader completely.
-
In the data folder open the Logs folder and delete everything inside.
-
In the data folder open the History folder, then open your broker folder and delete everything inside.
-
Close the data folder.
-
Reopen MetaTrader — everything will work correctly.
If problems persist, contact me directly. I respond to every message.
INPUT PARAMETERS SPECIFICATION
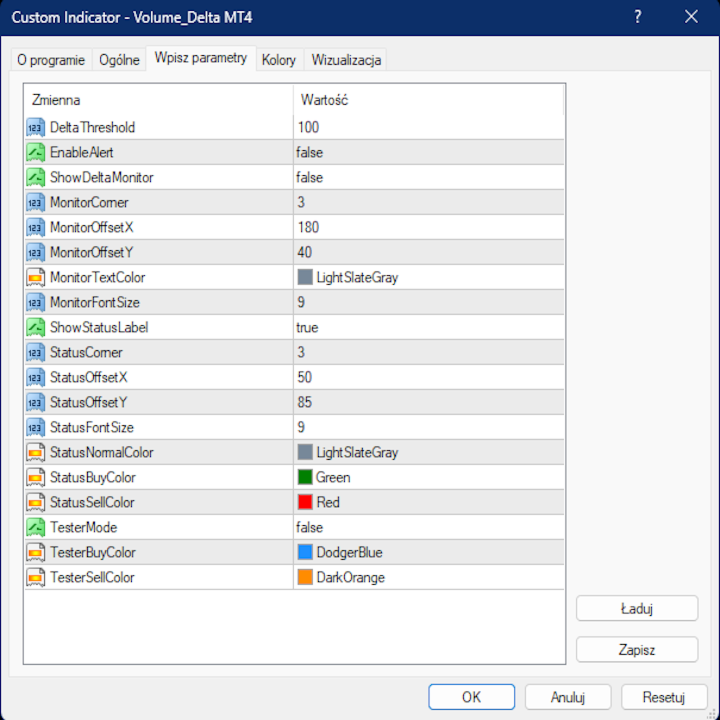
DeltaThreshold – defines the minimum delta value required to generate BUY or SELL pressure signals and directly controls signal frequency according to the user strategy.
EnableAlert – enables popup alert when current candle delta exceeds the defined threshold.
ShowDeltaMonitor – enables or disables the on-chart Delta Monitor information panel.
MonitorCorner – defines which chart corner the Delta Monitor panel is anchored to (0=left upper, 1=right upper, 2=left lower, 3=right lower).
MonitorOffsetX – horizontal distance in pixels of the Delta Monitor from the selected corner.
MonitorOffsetY – vertical distance in pixels of the Delta Monitor from the selected corner.
MonitorTextColor – text color of the Delta Monitor panel.
MonitorFontSize – font size used in the Delta Monitor panel.
ShowStatusLabel – enables or disables the large market status label on the chart.
StatusCorner – defines which chart corner the status label is anchored to (0=left upper, 1=right upper, 2=left lower, 3=right lower).
StatusOffsetX – horizontal distance in pixels of the status label from the selected corner.
StatusOffsetY – vertical distance in pixels of the status label from the selected corner.
StatusFontSize – font size of the status label text.
StatusNormalColor – text color when market condition is neutral.
StatusBuyColor – text color when delta indicates strong buying pressure.
StatusSellColor – text color when delta indicates strong selling pressure.
TesterMode – enables histogram-based delta visualization for Strategy Tester environment.
TesterBuyColor – color of histogram bars when delta indicates buying pressure in Strategy
TesterSellColor – color of histogram bars when delta indicates selling pressure in Strategy
Bots will only bring success when you have access to unlimited capital. Only "eyes and mind" will turn your account green, and simple, clean, fast, and efficient tools will help you achieve that.
Real success requires YOUR brain making decisions. My tools are not bots - they are instruments for traders who think.
Previous day's closing price acts like a magnet → High Low Close MT4
Asian Session sets the direction for London and New York sessions → Asia Session Levels MT4
If you scalp multiple instruments:
One Click B3 MT4, Symbol Positions Panel MT4 , SL TP Toggle Button MT4, Volume Delta MT4 , Volume Delta Scanner MT4
If you scalp one instrument:
One Click B3 MT4, Symbol Positions Panel MT4 ,SL TP Toggle Button MT4 ,Pips Label Last Trade MT4 , Volume Delta MT4, Volume Delta Scanner MT4
If you invest long-term across multiple instruments:
One Click B3 MT4, Symbol Positions Panel MT4,Volume Delta MT4 , Volume Delta Scanner MT4
If you've read the descriptions and need clarification - contact me. I'll explain every function, setting, and use case to assure you that these tools fit your trading strategy.