Volume Delta MT4

Volume Delta MT4 Cet indicateur de flux d'ordres professionnel pour MetaTrader 4 permet de visualiser la pression à l'achat et à la vente grâce à deux panneaux de suivi en temps réel. Il calcule le delta, différence entre la pression acheteuse et la pression vendeuse, en se basant sur la structure des chandeliers et le volume des ticks, offrant ainsi une vision claire de la domination du marché sans surcharger le graphique.

Cet indicateur fonctionne sur tous les symboles et toutes les unités de temps, y compris le Forex, les indices, les matières premières, les cryptomonnaies et les actions. Entièrement compatible avec tous les types de comptes, il fonctionne aussi bien sur les comptes réels que sur les comptes de démonstration et est optimisé pour une performance stable sans surcharger le processeur. Tous les calculs sont efficaces et effectués uniquement sur les barres nécessaires, garantissant un fonctionnement fluide même sur des environnements VPS aux performances modestes.

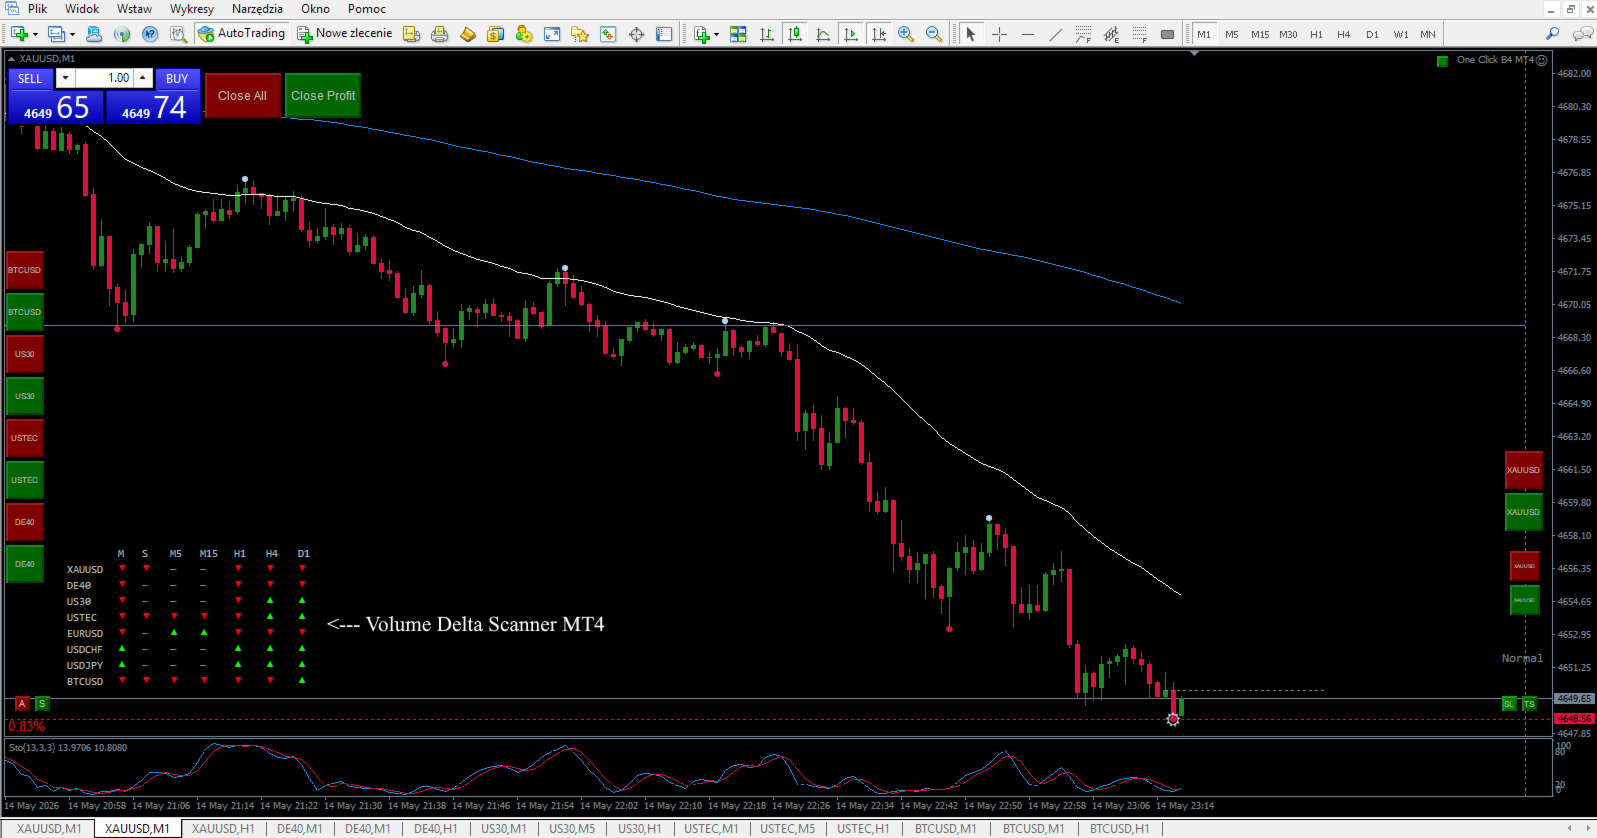
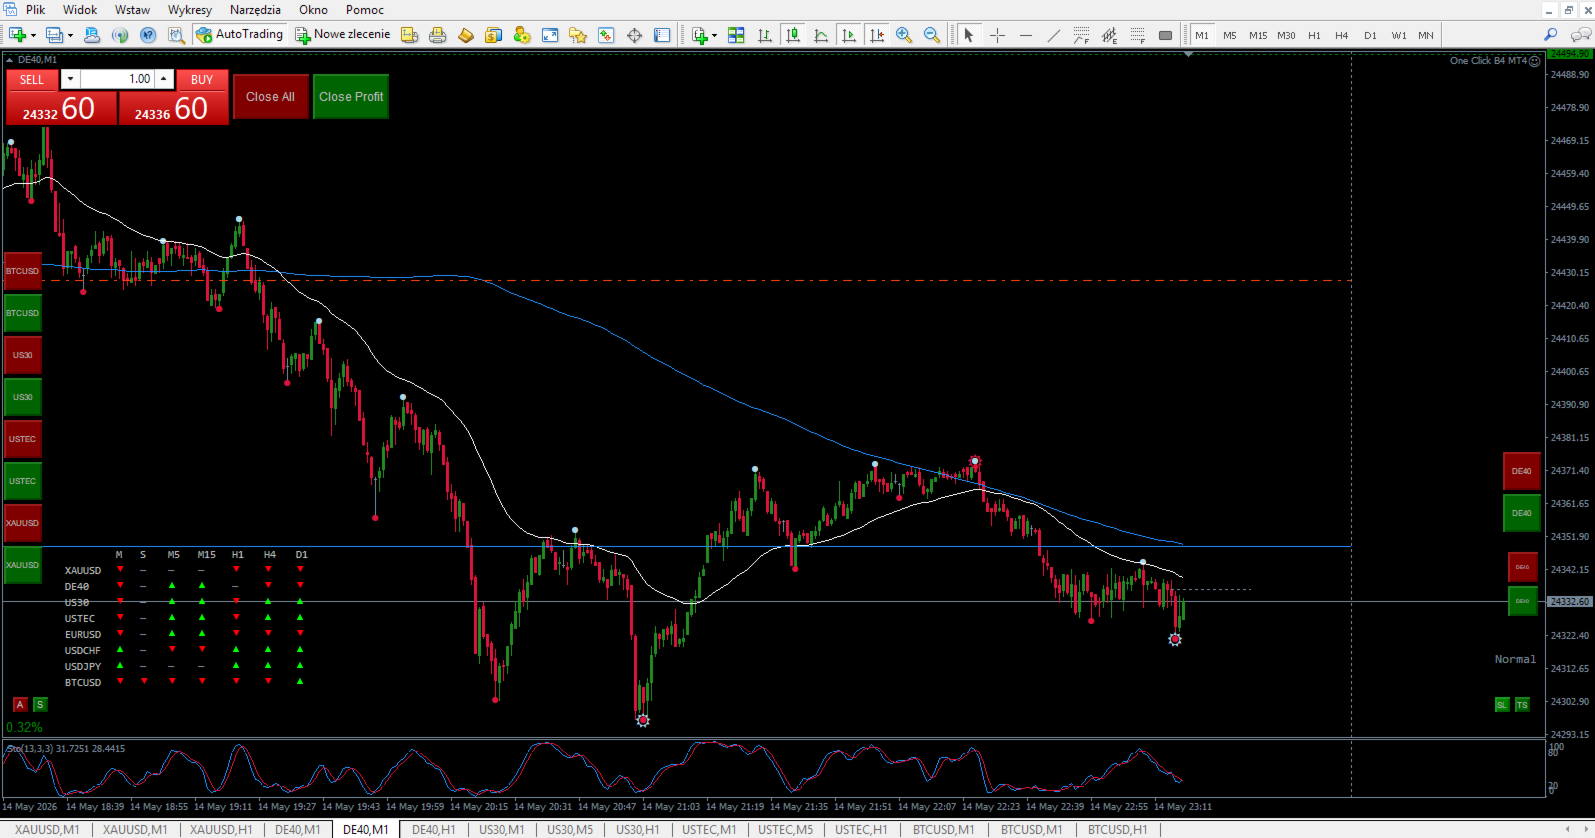
L'indicateur de volume Delta affiche les conditions du marché via deux panneaux de surveillance indépendants. Le panneau Delta Monitor présente la valeur delta actuelle, le niveau de seuil, le volume et l'état du marché de manière détaillée. Le panneau Status Label affiche des conditions de marché simplifiées (ACHAT, VENTE, Normal) à l'aide d'un texte personnalisable de grande taille pour une consultation rapide.

Le paramètre DeltaThreshold permet à l'utilisateur de définir la sensibilité de l'indicateur en fonction de sa stratégie. Des valeurs faibles génèrent davantage de signaux et une meilleure réactivité. Des valeurs élevées filtrent les déséquilibres plus faibles et réduisent la fréquence des signaux. L'indicateur s'adapte ainsi au scalping, au trading intraday et au swing trading.

Des alertes d'achat/vente optionnelles peuvent être activées lorsque le delta dépasse le seuil défini sur la bougie actuelle. Ces alertes sont contrôlées afin d'éviter leur répétition sur la même barre.

Les deux panneaux de contrôle peuvent être activés ou désactivés indépendamment, repositionnés dans n'importe quel coin du graphique et entièrement personnalisés (taille et couleur de la police). Le panneau 1 utilise la police Consolas pour les données numériques détaillées. Le panneau 2 utilise la police Arial Black pour l'affichage des informations d'état en gras.

L'indicateur prend en charge le mode testeur de stratégie où le delta est affiché sous forme d'histogramme à code couleur sous le graphique des prix à des fins d'analyse et de backtesting.

Volume Delta MT4 est destiné aux traders qui souhaitent analyser la pression du marché en temps réel, confirmer les cassures, détecter l'épuisement et identifier les tendances de déséquilibre des volumes dans un environnement graphique clair et stable, sans distractions visuelles.


STRATÉGIE DE CONFIRMATION MULTI-TEMPOREL

Cet indicateur utilise un seuil unique sur toutes les périodes, créant ainsi un filtre de force naturel qui élimine la nécessité d'ajuster les paramètres lors du changement de période.

COMMENT ÇA FONCTIONNE

Une même valeur de seuil produit des fréquences de signal différentes sur des périodes différentes :

Unité de temps M1 : Présente des signaux fréquents. Les bougies courtes d’une minute atteignent plus facilement le seuil, ce qui rend cette unité de temps idéale pour un timing d’entrée précis.

Unité de temps M5 : Affiche des signaux modérés. Les chandeliers de 5 minutes nécessitent une pression de volume plus soutenue pour déclencher des changements de tendance. À utiliser pour la confirmation de la tendance à court terme.

Unité de temps M15 : Affiche moins de signaux. Le déséquilibre de volume doit persister pendant toute la durée d’une bougie de 15 minutes. Plus fiable pour déterminer la direction du trading intraday.

Unité de temps H1 : Affiche le moins de signaux. Seule une forte pression acheteuse ou vendeuse soutenue pendant toute l’heure déclenche un changement de statut. À utiliser pour identifier la direction de la tendance principale.

Plus une unité de temps supérieure maintient longtemps un signal d'achat ou de vente, plus la tendance est forte. Un signal d'achat sur une unité de temps M15 pendant 30 minutes indique une très forte pression acheteuse.


CONFIGURATION DE TRADING PROFESSIONNELLES

Configuration solide (forte probabilité) :

  • Panneau M15 affiche ACHETER

  • Le panneau M5 affiche ACHETER

  • Le panneau M1 affiche ACHETER

  • Entrée : Position LONG ouverte

Cet alignement sur les trois périodes indique une forte pression à l'achat avec une forte probabilité de poursuite.

Configuration faible (faible probabilité – à éviter) :

  • Le panneau M1 affiche ACHETER

  • Le panneau M5 affiche Normal

  • Le panneau M15 affiche Normal

  • Entrée : Ignorer ce signal

Les signaux M1 isolés sans support sur une unité de temps supérieure sont souvent de fausses cassures ou du bruit de marché.

Signaux contradictoires (Attendre) :

  • Panneau M15 affiche ACHETER

  • Le panneau M5 affiche VENDRE

  • Le panneau M1 affiche VENTE

  • Entrée : Attendez l'alignement

Des échéanciers contradictoires indiquent soit une correction au sein d'une tendance plus large, soit une forte volatilité des marchés. Attendez que tous les échéanciers convergent avant d'intervenir.


RECOMMANDATIONS DE SEUIL

Commencez par 100 pour la plupart des instruments. Ajustez en fonction des caractéristiques de l'instrument :

  • Instruments à volume élevé (Bitcoin, Ethereum) : 200–300

  • Instruments à volume moyen (or, indices, principales devises) : 100–150

  • Instruments à faible volume (paires de devises mineures) : 50–80

Le principe fondamental : définissez le seuil une seule fois et il s’applique à toutes les unités de temps. Inutile de modifier les paramètres lorsque vous passez de M1 à M15 puis à H1.


POURQUOI CETTE APPROCHE EST DIFFÉRENTE

La plupart des indicateurs de volume nécessitent des paramètres différents pour chaque unité de temps. Cela crée de la confusion et oblige les traders à ajuster constamment les paramètres.

Cet indicateur résout ce problème. Un seul seuil de déclenchement ajuste automatiquement la sensibilité à chaque unité de temps. Les unités de temps supérieures affichent naturellement moins de signaux, confirmant ainsi la tendance de manière plus forte et plus fiable. À l'inverse, les unités de temps inférieures affichent naturellement plus de signaux, permettant un timing d'entrée précis.

Résultat : Analyse multi-temporelle propre sans ajustement de paramètres.


EXEMPLE PRATIQUE

Définissez le seuil à 100 et surveillez simultanément le XAUUSD sur trois graphiques :

  • Graphique M1 : Affiche 15 à 20 changements de statut colorés par heure (réagit aux pics de volume à court terme)

  • Graphique M5 : Affiche 8 à 12 changements de statut colorés par heure (tendances soutenues sur 5 minutes)

  • Graphique M15 : Affiche 2 à 3 changements de statut colorés par heure (uniquement les tendances fortes et établies).

Lorsque les trois horizons temporels affichent simultanément un signal d'achat, vous avez une confirmation maximale pour une position longue.

Lorsque seul M1 affiche ACHAT tandis que M5 et M15 restent normaux, ignorez le signal — il manque de support sur les unités de temps supérieures.

DÉPANNAGE

Avant toute chose, après avoir configuré l'indicateur et enregistré vos paramètres finaux, créez un modèle de graphique portant le nom de l'instrument. Vous pourrez ainsi tout restaurer en quelques secondes si nécessaire.

Si l'indicateur présente un comportement inattendu ou provoque des ralentissements de la plateforme, veuillez noter que ces problèmes ne sont pas dus à l'indicateur lui-même, mais aux données accumulées provenant des configurations graphiques précédentes stockées sur votre plateforme.

Suivez ces étapes :

  1. Allez dans Outils → Variables globales → supprimez toutes les variables.

  2. Allez dans Fichier → Ouvrir le dossier de données.

  3. Fermez complètement MetaTrader.

  4. Dans le dossier de données, ouvrez le dossier Logs et supprimez tout son contenu.

  5. Dans le dossier de données, ouvrez le dossier History, puis ouvrez votre dossier broker et supprimez tout son contenu.

  6. Fermez le dossier de données.

  7. Rouvrez MetaTrader — tout fonctionnera correctement.

Si les problèmes persistent, contactez-moi directement. Je réponds à tous les messages.


SPÉCIFICATIONS DES PARAMÈTRES D'ENTRÉE

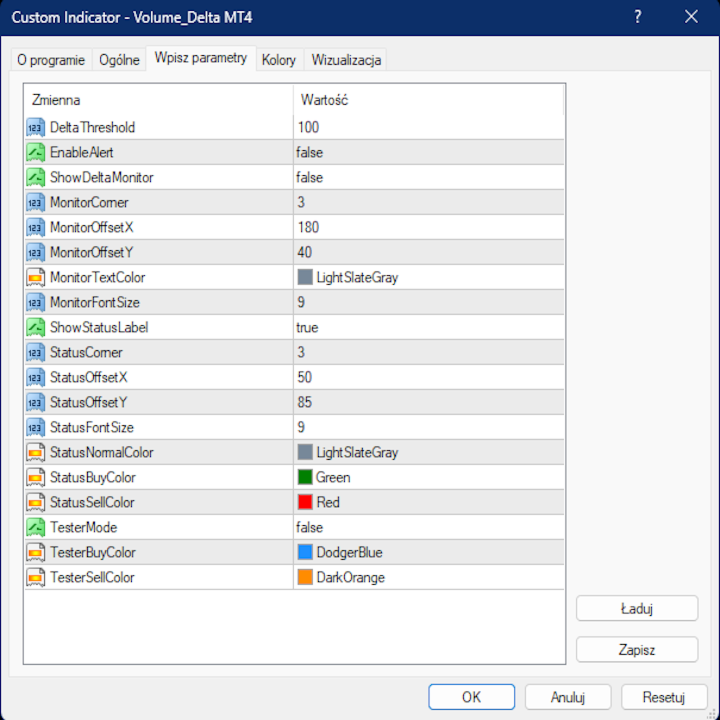
DeltaThreshold – définit la valeur delta minimale requise pour générer des signaux de pression ACHAT ou VENTE et contrôle directement la fréquence du signal en fonction de la stratégie de l'utilisateur.

EnableAlert – active une alerte contextuelle lorsque le delta de la bougie actuelle dépasse le seuil défini.

ShowDeltaMonitor – active ou désactive le panneau d'informations Delta Monitor sur le graphique.

MonitorCorner – définit le coin du graphique auquel le panneau Delta Monitor est ancré (0=coin supérieur gauche, 1=coin supérieur droit, 2=coin inférieur gauche, 3=coin inférieur droit).

MonitorOffsetX – distance horizontale en pixels du moniteur Delta par rapport au coin sélectionné.

MonitorOffsetY – distance verticale en pixels du moniteur Delta par rapport au coin sélectionné.

MonitorTextColor – couleur du texte du panneau Delta Monitor.

MonitorFontSize – taille de police utilisée dans le panneau Delta Monitor.

ShowStatusLabel – active ou désactive l'affichage de la grande étiquette d'état du marché sur le graphique.

StatusCorner – définit le coin du graphique auquel l'étiquette d'état est ancrée (0=en haut à gauche, 1=en haut à droite, 2=en bas à gauche, 3=en bas à droite).

StatusOffsetX – distance horizontale en pixels de l'étiquette d'état par rapport au coin sélectionné.

StatusOffsetY – distance verticale en pixels de l'étiquette d'état par rapport au coin sélectionné.

StatusFontSize – taille de la police du texte de l'étiquette d'état.

StatusNormalColor – couleur du texte lorsque la situation du marché est neutre.

StatusBuyColor – couleur du texte lorsque le delta indique une forte pression à l'achat.

StatusSellColor – couleur du texte lorsque le delta indique une forte pression à la vente.

TesterMode – permet la visualisation des différences sous forme d'histogramme pour l'environnement de test de stratégie.

TesterBuyColor – couleur des barres de l'histogramme lorsque le delta indique une pression à l'achat dans la stratégie

TesterSellColor – couleur des barres de l'histogramme lorsque le delta indique une pression à la vente dans la stratégie


Prodotti consigliati
Trade with Gann on your side!! MASTER CIRCLE 360 CIRCLE CHART, originally created by Gann admitted that this is “The Mother of all charts”. It is one of the last studies that this great trader left for us. The numeric tab le is apparently quite simple like all the tables and is based on square numbers, the SQUARE OF 12 and is by evolution, one of the most important square numbers. Here we can find CYCLE, PRICE AND TIME thanks to angles and grades, to show past and future support and resistance.
Infinity Trend Pro
Yaroslav Varankin
1 (1)
This is a trend indicator without redrawing Developed instead of the binary options strategy (by the color of the Martingale candlestick) Also works well in forex trading When to open trades (binary options) A signal will appear in the place with a candle signaling the current candle It is recommended to open a deal for one candle of the current timeframe M1 and M5 When a blue dot appears, open a deal up When a red dot appears, open a trade down. How to open trades on Forex. When a signal is rec
Heiken Ashi Smoothed Strategy is a very simple but powerful system to get forex market trend direction. This indicator is actually 2 indicators in 1 pack, Heiken Ashi and Heiken Ashi Smoothed Moving Average both included. Because HA (Heiken Ashi) and HAS (Heiken Ashi Smoothed) are calculated in the same one system event with necessary buffers and loop only, so it is the FAST, OPTIMIZED and EFFICIENT HA having the combined indicator of MetaTrader 4. You can choose to display HA and HAS in the sam
Indicatore Crypto_Forex "DeMarker FLAT Detector" - è un efficace strumento ausiliario per il trading! Nessuna rielaborazione. Ti offro di aggiornare i tuoi metodi di trading con questo fantastico indicatore per MT4. - L'indicatore mostra le aree di prezzo piatte sul grafico. Dispone del parametro "Sensibilità piatta", responsabile del rilevamento di zone piatte. - "DeMarker FLAT Detector" può essere utilizzato per confermare le entrate di Price Action o in combinazione con altri indicatori. -
Trend Oscillator - è un indicatore Crypto_Forex personalizzato avanzato, uno strumento di trading efficiente! - Viene utilizzato un nuovo metodo di calcolo avanzato - 20 opzioni per il parametro "Prezzo per calcolo". - L'oscillatore più fluido mai sviluppato. - Colore verde per i trend al rialzo, colore rosso per i trend al ribasso. - Valori di ipervenduto: inferiori a 5, valori di ipercomprato: superiori a 95. - Ci sono molte opportunità per aggiornare anche le strategie standard con questo in

Indicatore Crypto_Forex "CCI FLAT Detector" - è un efficace strumento ausiliario per il trading! Nessuna rielaborazione. Ti offro di aggiornare i tuoi metodi di trading con questo fantastico indicatore per MT4. - L'indicatore mostra le aree di prezzo piatte sul grafico. Dispone del parametro "Sensibilità piatta", responsabile del rilevamento delle zone piatte. - "CCI FLAT Detector" può essere utilizzato per confermare le entrate di Price Action o in combinazione con altri indicatori. - Puoi uti
Are you tired of the uncertainty that arises when your orders fail to stop at a specific line due to the spread? Look no further! Introducing our  indicator that plots candlesticks based on the Ask price instead of the traditional bid-based chart commonly used in MQL4. With this indicator, you can say goodbye to the frustrations caused by the bid-based chart, as it provides you with a more accurate representation of market movements. By utilizing the Ask price, which represents the price at whic
Insider Scalper Binary This tool is designed to trade binary options. for short temporary spends. to make a deal is worth the moment of receiving the signal and only 1 candle if it is m1 then only for a minute and so in accordance with the timeframe. for better results, you need to select well-volatile charts.... recommended currency pairs eur | usd, usd | jpy .... the indicator is already configured, you just have to add it to the chart and trade .... The indicator signals the next candle.
Signal trend indicator. Detects the direction of the trend and is coloured accordingly.  Has built in audible and visual alerts when trends change. Can send notifications to your phone or email. Allows Trend and Counter-Trend trading. Works on all timeframes, all currency pairs, metals, indices and cryptocurrencies. Can be used with binary options. Distinctive features No re-drawing; Simple and clear settings; Four types of alerts; Works on all timeframes and all trading tools; Suitable
Trend Deviation
VLADISLAV AKINDINOV
Trend indicator with calculation of dynamic levels and signaling their intersection. Description of input parameters: StepTF = true; - Calculation of the indicator by closing the bar (true) or by each tick (false) BarsCount = 300; - Number of settlement bars Price = PRICE_CLOSE; - Type of price used TimeFrame = PERIOD_CURRENT; - Estimated timeframe TrendPeriod = 9; - Trend calculation period TrendDeviations = 4.9; - coefficient of deviation PeriodTrendSmooth = 1; - Trend smoothing perio
An indicator of pattern #31 ("Long Island") from Encyclopedia of Chart Patterns by Thomas N. Bulkowski. The second gap is in the opposite direction. Parameters: Alerts - show alert when an arrow appears   Push - send a push notification when an arrow appears (requires configuration in the terminal) GapSize - minimum gap size in points ArrowType - a symbol from 1 to 17 ArrowVShift - vertical shift of arrows in points   ShowLevels - show levels ColUp - color of an upward line ColDn - color of a
Color Stochastic Enhanced Stochastic Oscillator with Cross Detection and Visual Signal Support Overview Color Stochastic is a customized version of the classic Stochastic Oscillator designed for momentum analysis and crossover visualization. The indicator provides color-based signal marking and configurable crossover detection at user-defined overbought and oversold levels. It can be used as part of: Momentum analysis Mean reversion workflows DCA-based strategies Multi-indicator confirmation sys
Skalpex
Andrey Kozak
Skalpex is a system indicator for wave diagnostic analysis of the early phases of a market condition. The indicator lags exactly 1 bar. It shows the exact price reversals, does not redraw its values, but is 1 bar late. This is due to the fact that the last (zero bar) has not yet been formed before closing, which means that no one ever knows where it will go exactly and where it will close. We can assume. In order not to try to play fortune-telling, the Skalpex indicator is late by one candle an
VR Cub
Vladimir Pastushak
VR Cub è un indicatore per ottenere punti di ingresso di alta qualità. L'indicatore è stato sviluppato per facilitare i calcoli matematici e semplificare la ricerca dei punti di ingresso in una posizione. La strategia di trading per la quale è stato scritto l'indicatore ha dimostrato la sua efficacia per molti anni. La semplicità della strategia di trading è il suo grande vantaggio, che consente anche ai trader alle prime armi di commerciare con successo con essa. VR Cub calcola i punti di apert
PABT Pattern Indicator - it's classical system one of the signal patterns. Indicator logic - the Hi & Lo of the bar is fully within the range of the preceding bar, look to trade them as pullback in trend. In the way if indicator found PABT pattern it's drawing two lines and arrow what showing trend way.  - First line - it's entry point and drawing at: 1. On the high of signal bar or on middle of the signal bar (depending from indicator mode) for buy; 2. On the low of signal bar or on middle of t
Wave Wolf MT4
Andrei Salanevich
L'indicatore Forex Wave wold MT4 è progettato per cercare le onde di Woolf e visualizzarle nella finestra corrente del terminale di trading. Un ottimo indicatore per i trader che utilizzano le onde di Wolfe nel trading. La sua applicazione nelle strategie di trading aumenterà notevolmente la loro efficienza e redditività. INFORMAZIONI SULL'INDICATORE A differenza di altri indicatori onda Wold, indicatore Forex onda wold MT4 ha una serie di caratteristiche che aumentano notevolmente la sua effi
M5 Scalperin – Professional Intraday Scalping System for MetaTrader 4 M5 Scalperin is a professional scalping indicator designed for intraday trading on the Forex market . The system automatically identifies optimal entry points and displays clear buy and sell arrows directly on the chart , allowing traders to quickly react to short-term market movements. The indicator is optimized for high-probability pullback entries within a strong trend , helping traders capture fast profits in active market
L'indicatore "Two Moving Average Crossover" per MetaTrader 4 (MT4) è uno strumento di analisi tecnica che visualizza due medie mobili e notifica quando le medie mobili si incrociano. L'indicatore calcola e traccia due medie mobili, una più veloce e l'altra più lenta. Quando la media mobile più veloce incrocia quella più lenta, viene considerato un segnale rialzista, che indica una potenziale inversione di tendenza o l'inizio di un nuovo trend rialzista. Al contrario, quando la media mobile più
Overview Harmonic Patterns MT4 is a technical analysis indicator designed for the MetaTrader 5 platform. It identifies and displays harmonic price patterns, such as Butterfly, Cypher, Crab, Bat, Shark, and Gartley, in both bullish and bearish directions. The indicator calculates key price levels, including entry, stop loss, and three take-profit levels, to assist traders in analyzing market movements. Visual elements and customizable alerts enhance usability on the chart. Features Detects six ha
Alpha Trend
Evgeny Belyaev
3 (4)
Alpha Trend is a trend indicator for the MetaTrader 4 platform; it has been developed by a group of professional traders. The Alpha Trend indicator finds the most probable tendency reversal points, which allows making trades at the very beginning of a trend. This indicator features notifications, which are generated whenever a new signal appears (alert, email, push-notification). This allows you to open a position in a timely manner. Alpha Trend does not redraw, which makes it possible to evalua
Pullback Scanner Line
Rami Fatmi Fernandez
Pullback Scanner Line – Pullback Signal Indicator by Mr. Rami Pullback Scanner Line is an advanced indicator that helps accurately identify trading opportunities based on reversals within the trend. It combines the strength of an exponential moving average (EMA) and Bollinger Bands to calculate a "pullback score," which reflects the probability of a favorable price reversal or continuation. Key Features: Uses a configurable EMA to detect trend direction. Uses Bollinger Bands to measure vola
Kangaroo Tailz
Brenden Caleb Luebeck
Looking for an indicator that identifies high-probability price action patterns? Love counter-trend trading? The Kangaroo Tailz indicator might be just for you. This indicator is meant to be used as a reversal detector. I personally would rather enter a position at the beginning of a trend rather than catch the last couple of moves. This indicator does a good job of alerting when price may reverse by identifying price action patterns that occur frequently in markets. Even though this indicator i
The Stochastic Oscillator is a momentum indicator that uses support and resistance levels. The term "stochastic" refers to the point of a current price in relation to its price range over a period of time. You can use a New Stochastic in the same way as classical one: Overbought and Oversold areas to make a Buy or Sell orders. This new indicator shows all variety of Fibonacci Levels (from 23.6 to 76.4) which can be used as Overbought and Oversold levels as well as points to close an open positio
Daily Candle Predictor è un indicatore che prevede il prezzo di chiusura di una candela. L'indicatore è destinato principalmente all'uso sui grafici D1. Questo indicatore è adatto sia per il trading forex tradizionale che per il trading di opzioni binarie. L'indicatore può essere utilizzato come sistema di trading autonomo o può fungere da aggiunta al sistema di trading esistente. Questo indicatore analizza la candela corrente, calcolando alcuni fattori di forza all'interno del corpo della cande
Buy vs Sell Flow Intensity
Hericlezia Andrade Assuncao
The Buy vs Sell Flow Indicator is a powerful MT4 trading tool designed to help traders visualize estimated buying and selling pressure directly on the chart. The indicator displays the Buying Force and Selling Force for each candle, allowing you to quickly analyse market activity and understand which side is showing greater strength. Key Features Real-time Buying Force and Selling Force Bar-by-bar market flow analysis Tick Volume analysis Clear and easy-to-read values Automatic display above and
Trendiness Index
Libertas LLC
5 (3)
"The trend is your friend" is one of the best known sayings in investing, because capturing large trendy price movements can be extremely profitable. However, trading with the trend is often easier said than done, because many indicators are based on price reversals not trends. These aren't very effective at identifying trendy periods, or predicting whether trends will continue. We developed the Trendiness Index to help address this problem by indicating the strength and direction of price trend
Noize Absorption Index MT4
Ekaterina Saltykova
5 (1)
Noize Absorption Index - is the manual trading system that measures the difference of pressure between bears forces and bulls forces. Green line - is a noize free index that showing curent situation. Zero value of index shows totally choppy/flat market.Values above zero level shows how powerfull bullish wave is and values below zero measures bearish forces.Up arrow appears on bearish market when it's ready to reverse, dn arrow appears on weak bullish market, as a result of reverse expectation. S
EZZ Zig Zag MT4
Paulo Rocha
5 (1)
EZZ Elite Zig Zag is an indicator for the MetaTrader 4 terminal. This indicator traces the peak of the trend based on the market reversal, thus showing various opportunities in the financial market. EZZ Elite Zig Zag is a visual tool, intuitive, and easy to understand and use.  Test it Yourself by Downloading it for Free. Author Paulo Rocha all rights reserved
The indicator displays the data of the Stochastic oscillator from a higher timeframe on the chart. The main and signal lines are displayed in a separate window. The stepped response is not smoothed. The indicator is useful for practicing "manual" forex trading strategies, which use the data from several screens with different timeframes of a single symbol. The indicator uses the settings that are identical to the standard ones, and a drop-down list for selecting the timeframe. Indicator Paramet
Alpha Trend sign has been a very popular trading tool in our company for a long time. It can verify our trading system and clearly indicate trading signals, and the signals will not drift. Main functions: Based on the market display of active areas, indicators can be used to intuitively determine whether the current market trend belongs to a trend market or a volatile market. And enter the market according to the indicator arrows, with green arrows indicating buy and red arrows indicating se
Gli utenti di questo prodotto hanno anche acquistato
Trend SniperX MT4
Sarvarbek Abduvoxobov
5 (3)
Trend Sniper X è un indicatore di trend-following multi-timeframe per MetaTrader 5 che aiuta i trader a identificare la direzione del trend e i potenziali punti di inversione con chiarezza e precisione. Per MT5: https://www.mql5.com/en/market/product/181101 Informazioni sul prezzo: Il prezzo attuale è promozionale ed è soggetto a modifiche con il rilascio dei prossimi aggiornamenti e nuove funzionalità. Canale Code2Profit Domina il mercato con l'analisi multi-timeframe! Come massimizzare il tuo
SR Liquidity
Oleg Rodin
5 (2)
SR Liquidity è un indicatore di trading progettato per individuare le zone nascoste in cui si concentra la liquidità di mercato e dove il prezzo reagisce con maggiore intensità. Queste aree di liquidità agiscono come potenti livelli di supporto e resistenza, offrendo una mappa chiara dei punti in cui è più probabile che il mercato inverta la propria direzione. Invece di tracciare le classiche linee di supporto e resistenza, SR Liquidity analizza l'effettivo comportamento dei prezzi per individua
M1 Sniper
Oleg Rodin
4.97 (30)
M1 SNIPER è un sistema di indicatori di trading facile da usare. Si tratta di un indicatore a freccia progettato per l'intervallo temporale M1. L'indicatore può essere utilizzato come sistema autonomo per lo scalping sull'intervallo temporale M1 e come parte del tuo sistema di trading esistente. Sebbene questo sistema di trading sia stato progettato specificamente per il trading sull'intervallo temporale M1, può comunque essere utilizzato anche con altri intervalli temporali. Inizialmente ho pro
Miraculous Indicator Binary & Forex v3 StrategySafe Miraculous Indicator Binary & Forex v3 StrategySafe è un indicatore professionale progettato per trader che cercano segnali chiari, strumenti di conferma avanzati e un metodo strutturato per operare sui mercati Binary e Forex. La versione v3 include MIR Dashboard, Miraculous Confirmation Dashboard, GANN Law, livelli Square of 9, angoli GANN e una modalità Forex più completa per un’analisi di mercato più precisa. Caratteristiche principali Modal
Gann Made Easy
Oleg Rodin
4.84 (172)
Gann Made Easy è un sistema di trading Forex professionale e facile da usare che si basa sui migliori principi del trading utilizzando la teoria di mr. WD Gann. L'indicatore fornisce segnali ACQUISTA e VENDI accurati, inclusi i livelli di Stop Loss e Take Profit. Puoi fare trading anche in movimento utilizzando le notifiche PUSH. CONTATTAMI DOPO L'ACQUISTO PER RICEVERE GRATUITAMENTE LE ISTRUZIONI DI TRADING E OTTIMI INDICATORI EXTRA! Probabilmente hai già sentito parlare molte volte dei metodi d
Scalper Inside PRO
Alexey Minkov
4.74 (69)
Scalper Inside PRO helps you read the intraday trend and plan a trade before you enter the market. It is built around three exclusive strategies for a sharper read of the market. The moment a signal appears, the indicator evaluates market direction and calculates the key levels, so you see the potential entry, the expected stop-loss and several profit-taking levels in advance. Detailed performance statistics show how different instruments and strategies performed in history and help you pick ass
Il Tokyo Indicator offre una chiara panoramica visiva della direzione del trend, dei potenziali segnali di trading e delle condizioni di mercato. La sua linea di trend a gradini, codificata a colori, distingue le fasi rialziste (in blu) da quelle ribassiste (in magenta). Frecce direzionali dedicate evidenziano potenziali opportunità di acquisto e vendita al variare del trend visualizzato. Una dashboard integrata riunisce in un'unica visualizzazione pratica il segnale corrente, il bias di mercato
DayTrader PRO MT4
Davit Beridze
4.6 (10)
DayTrader PRO MT5:  https://www.mql5.com/en/market/product/186222 DayTrader PRO è un indicatore di trading avanzato che combina il filtro Laguerre di John Ehlers con un potente motore di auto-ottimizzazione. Invece di utilizzare parametri fissi, l'indicatore ricerca automaticamente le migliori impostazioni in base alle condizioni recenti del mercato, aiutandoti ad adattarti alla volatilità variabile senza costanti aggiustamenti manuali. L'indicatore genera segnali chiari di ACQUISTO (BUY) e VEND
Zoryk Gold mt4
Reda El Koutbane
5 (2)
ZORYK — Sistema avanzato di segnali e pianificazione per XAUUSD su MetaTrader 4 Conosci sicuramente questa situazione. Analizzi l’oro, aspetti l’ingresso e finalmente apri la posizione. Il prezzo si muove immediatamente contro di te. Chiudi troppo presto, sposti lo Stop Loss oppure esiti per alcuni secondi. Poco dopo, il mercato raggiunge esattamente la direzione e l’obiettivo che avevi previsto, ma senza di te. Il problema non era sempre la direzione. Il vero problema era l’incertezza. No
Questo prodotto è stato aggiornato per il mercato 2026 e ottimizzato per le ultime build di MT5. AVVISO DI AGGIORNAMENTO PREZZO: Smart Trend Trading System è attualmente disponibile a $99 . Il prezzo aumenterà a $199 dopo i prossimi 30 acquisti . OFFERTA SPECIALE: Dopo aver acquistato Smart Trend Trading System, inviami un messaggio privato per ricevere Smart Universal EA GRATIS e trasformare i tuoi segnali Smart Trend in operazioni automatiche. Smart Trend Trading System è un sistema di tradin
Volume Break Oscillator è un indicatore che abbina il movimento dei prezzi con le tendenze del volume sotto forma di oscillatore. Volevo integrare l'analisi del volume nelle mie strategie, ma sono sempre stato deluso dalla maggior parte degli indicatori di volume, come OBV, Money Flow Index, A/D ma anche come Volume Weighted Macd e molti altri. Ho quindi scritto questo indicatore per me stesso, sono soddisfatto di quanto sia utile e quindi ho deciso di pubblicarlo sul mercato. Caratteristiche
Trend Catcher ind
Ramil Minniakhmetov
5 (11)
INDICATORE TREND CATCHER L'indicatore Trend Catcher analizza i movimenti dei prezzi di mercato, utilizzando una combinazione di indicatori di analisi del trend proprietari dell'autore e personalizzati. Identifica la vera direzione del mercato filtrando il rumore a breve termine e concentrandosi sulla forza del momentum sottostante, sull'espansione della volatilità e sul comportamento della struttura dei prezzi. Utilizza inoltre una combinazione di indicatori personalizzati di smoothing e filtr
For MetaTrader5 you can download it from the link https://www.mql5.com/en/market/product/187668 True Signal FX is a multi-timeframe trading indicator for MetaTrader 4 designed to provide a complete trading setup directly on the chart. Instead of displaying a single directional signal, the indicator combines market analysis, signal confirmation and trade level calculation in one workspace. When a setup is detected, the trader can see the direction, Entry, Stop Loss and Take Profit levels toget
PZ Support Resistance
PZ TRADING SLU
3.33 (3)
Unlock key market insights with automated support and resistance lines Tired of plotting support and resistance lines? This is a multi-timeframe indicator that detects and plots supports and resistance lines in the chart with the same precision as a human eye would. As price levels are tested over time and its importance increases, the lines become thicker and darker, making price leves easy to glance and evaluate. [ Installation Guide | Update Guide | Troubleshooting | FAQ | All Products ] Boos
Dynamic Forex28 Navigator
Bernhard Schweigert
4.43 (7)
Dynamic Forex28 Navigator - Lo strumento di trading Forex di nuova generazione. ATTUALMENTE SCONTATO DEL 49%. Dynamic Forex28 Navigator è l'evoluzione dei nostri indicatori popolari di lunga data, che combinano la potenza di tre in uno: Advanced Currency Strength28 Indicator (695 recensioni) + Advanced Currency IMPULSE con ALERT (520 recensioni) + CS28 Combo Signals (Bonus). Dettagli sull'indicatore https://www.mql5.com/en/blogs/post/758844 Cosa offre l'indicatore di forza di nuova generazione?
Neuro Poseidon MT4
Daria Rezueva
4.74 (46)
Neuro Poseidon is a new indicator by Daria Rezueva. It combines precise trading signals with adaptive TP/SL levels - creating best possible trades as a result! Message me and get  Neuro Poseidon Assistant  as a gift to automize your trading process! What makes it stand out? 1. Proven profitability on all assets and timeframes 2. Only confirmed BUY and SELL signals present on the chart 3. Adaptive TP & SL levels generated by the software for each trade 4. Easy to understand - suitable for all
Quantum Breakout Indicator PRO
Bogdan Ion Puscasu
4.96 (26)
Presentazione       Quantum Breakout PRO   , l'innovativo indicatore MQL5 che sta trasformando il modo in cui scambi le zone di breakout! Sviluppato da un team di trader esperti con un'esperienza di trading di oltre 13 anni,   Quantum Breakout PRO   è progettato per spingere il tuo viaggio di trading a nuovi livelli con la sua strategia innovativa e dinamica della zona di breakout. Quantum Breakout Indicator ti fornirà frecce di segnalazione sulle zone di breakout con 5 zone target di profitt
Attualmente 30% di sconto! La soluzione migliore per ogni principiante o trader esperto! Questo software per cruscotti funziona su 28 coppie di valute. Si basa su 2 dei nostri indicatori principali (Advanced Currency Strength 28 e Advanced Currency Impulse). Offre un'ottima panoramica dell'intero mercato Forex. Mostra i valori di forza delle valute avanzate, la velocità di movimento delle valute e i segnali per 28 coppie Forex in tutti i (9) timeframe. Immaginate come migliorerà il vostro tra
System Trend Pro
Aleksandr Makarov
5 (3)
The indicator no repaint!!!  The indicator has   MTF   mode, which adds confidence to trading on the trend (   no repaint   ). How to trade? Everything is very simple, we wait for the first signal (big arrow), then wait for the second signal (small arrow) and enter the market in the direction of the arrow. (See screens 1 and 2.) Exit on the opposite signal or take 20-30 pips, close half of it, and keep the rest until the opposite signal. By the way, it is on Scalping that most traders make m
CRT Candle Range Theory HTF MT4 - Ultimate CRT Indicator: Concetti ICT avanzati e sistema di trading Malaysian SnR Padroneggia le orme dei Market Maker con l'indicatore Candle Range Theory più avanzato. Sblocca il vero potere degli Smart Money Concepts (SMC) e fai trading con la stessa precisione delle istituzioni grazie all'Ultimate CRT Indicator. Costruito esclusivamente per i trader seri, questo indicatore automatizza la teoria CRT, un pilastro centrale dei Concetti ICT (Inner Circle Trader),
Pro Trend Scanner
Nikolay Georgiev
5 (1)
Update: Push to mobile notification is now added as optinal in the settings. Most traders fail to generate profit because of the lack of so-called filters and scanners. If you want to win at trading you need a solid system and also a filtering tool for some or all of your entry criteria. It is impossible to follow 24 currency pairs, all the indices, stocks and commodities without a filtering tool. Imagine you can get an email any time CCI crosses bellow 100 and 0 when the price is bellow MA5 an
Top Bottom Tracker è un indicatore basato su sofisticati algoritmi che analizza l'andamento del mercato ed è in grado di rilevare i massimi e i minimi del trend / Versione MT5 . Il prezzo aumenterà progressivamente fino a raggiungere i 500$. Prossimo prezzo --> 99$ Caratteristiche Nessuna riverniciatura Questo indicatore non cambia i suoi valori all'arrivo di nuovi dati Coppie di trading Tutte le coppie forex Timeframe Tutti i timeframe Parametri ==== Configurazione dell'indicatore ====
TrendLine PRO MT4
Evgenii Aksenov
4.83 (168)
The Trend Line PRO indicator is an independent trading strategy. It shows the trend change, the entry point to the transaction, as well as automatically calculates three levels of Take Profit and Stop Loss protection. Trend Line PRO is perfect for all Meta Trader symbols: currencies, metals, cryptocurrencies, stocks and indices. The indicator is used in trading on real accounts, which confirms the reliability of the strategy. Robots using   Trend Line PRO   and real Signals can be found here:   
PZ Trend Trading
PZ TRADING SLU
4.8 (5)
Capture every opportunity: your go-to indicator for profitable trend trading Trend Trading is an indicator designed to profit as much as possible from trends taking place in the market, by timing pullbacks and breakouts. It finds trading opportunities by analyzing what the price is doing during established trends. [ Installation Guide | Update Guide | Troubleshooting | FAQ | All Products ] Trade financial markets with confidence and efficiency Profit from established trends without getting whips
Price Breakout pattern Scanner is the automatic scanner for traders and investors. It can detect following patterns automatically from your chart. Head and Shoulder - Common tradable pattern. Reverse Head and Shoulder - This pattern is the reverse formation of the Head and Shoulder. Double Top - When the price hits resistance level twice and decline toward the support level, the trader can anticipate sudden bearish breakout through the support level. Double Bottom - The double bottom pattern is
Indicatore Crypto_Forex "Hanging Man and Inverted Hammer Pro" per MT4, senza ridisegnare, senza ritardi. - L'indicatore "Hanging Man and Inverted Hammer Pro" è un indicatore molto potente per il trading basato sulla Price Action. - L'indicatore rileva pattern Inverted_Hammer rialzisti e Hanging_Man ribassisti sul grafico: - Inverted_Hammer rialzista - segnale freccia blu sul grafico (vedi immagini). - Hanging_Man ribassista - segnale freccia rossa sul grafico (vedi immagini). - Con avvisi su PC
Prop Firm Sniper
Mohamed Hassan
4.33 (6)
Prop Firm Sniper MT4  is a professional market structure indicator that automatically identifies high-probability BUY and SELL opportunities using BOS and CHoCH analysis. Recommended Timeframes: For backtesting, use the indicator on   M5 or M15   for Gold (XAUUSD), and   M15 or H1   for more volatile Forex pairs such as   GBPUSD, USDJPY, EURGBP , and similar markets. CONTACT ME AFTER PURCHASE TO CLAIM YOUR FREE BONUSES! Prop Firm Sniper  is a professional market structure indicator designed t
Currency Strength Exotics
Bernhard Schweigert
4.88 (33)
ATTUALMENTE SCONTATO DEL 20%! La soluzione migliore per qualsiasi principiante o trader esperto! Questo indicatore è specializzato nel mostrare la forza della valuta per qualsiasi simbolo come coppie esotiche, materie prime, indici o futures. È il primo nel suo genere, qualsiasi simbolo può essere aggiunto alla nona riga per mostrare la vera forza della valuta di Oro, Argento, Petrolio, DAX, US30, MXN, TRY, CNH ecc. Si tratta di uno strumento di trading unico, di alta qualità e conveniente pe
Mean Reversion Supply Demand Indicator Mean Reversion Supply Demand is the indicator to detect the important supply demand zone in your chart. The concept of supply demand trading relies on the quantity mismatching between buying and selling volumes in the financial market. Typically, supply demand zone serves to predict the turning point. The wave pattern, for any supply demand zone to work as an successful trade, looks like the price must touch the base zone, move away and then return to zone
Smetti di indovinare. Inizia a fare trading con un vantaggio statistico. Gli indici azionari non si negoziano come il forex. Hanno sessioni definite, gap notturni e seguono pattern statistici prevedibili. Questo indicatore ti fornisce i dati di probabilità di cui hai bisogno per fare trading su indici come DAX, S&P 500 e Dow Jones con fiducia. Cosa lo rende diverso La maggior parte degli indicatori ti mostra cosa è successo. Questo ti mostra cosa probabilmente succederà dopo. Ogni giorno di trad
Altri dall’autore
Volume Delta MT5
Mariusz Franciszek Szczepanczyk
Volume Delta MT5 È un indicatore professionale di flusso degli ordini per MetaTrader 5, progettato per visualizzare la pressione di acquisto e di vendita direttamente nella finestra principale del grafico, utilizzando la logica dello squilibrio di volume. L'indicatore calcola il delta come la differenza tra la pressione di acquisto e di vendita aggressiva, basandosi sulla struttura delle candele e sul volume disponibile (in tick o reale), fornendo una visione chiara del dominio del mercato. L'i
One Click B3 MT4
Mariusz Franciszek Szczepanczyk
Questo non è solo un Expert Advisor per chiudere rapidamente le posizioni, indipendentemente dal numero di operazioni o strumenti aperti. È anche un Expert Advisor per controllare, proteggere e massimizzare il profitto percentuale da tutte le posizioni aperte a piattaforma chiusa. È un Expert Advisor che ti permette di dormire sonni tranquilli e riposare. È un Expert Advisor che continua a lavorare anche quando ti godi il tuo breve momento di libertà, utilizzando i guadagni del tuo lavoro. Esam
Asia Session Levels MT4
Mariusz Franciszek Szczepanczyk
B_Asr MT4— Intervallo di sessioni asiatiche Asian Session Range è un indicatore semplice e intuitivo che disegna automaticamente i livelli di prezzo chiave in base alla sessione di trading asiatica, direttamente sul grafico. Nessun disegno manuale, nessuna configurazione complicata: basta caricarlo e iniziare a fare trading. COSA DISEGNA Una volta conclusa la sessione asiatica, l'indicatore traccia 7 livelli orizzontali per il resto della giornata di negoziazione: Massimo — massimo della sessi
Pips Label Last Trade MT4
Mariusz Franciszek Szczepanczyk
B_Pipsy MT4 — Etichetta pip ultima posizione Indicatore compatto sul grafico per MT4 che mostra il risultato fluttuante corrente dell'ultima posizione aperta sul simbolo, in pip interi, con colorazione automatica verde/rossa per profitto o perdita. Funziona su qualsiasi simbolo e timeframe ed è completamente configurabile in termini di carattere, colore e posizione sullo schermo.[1][2] Caratteristiche principali: Rileva la posizione di mercato aperta più di recente (ACQUISTA o VENDI) sul simb
SL TP Toggle Button MT4
Mariusz Franciszek Szczepanczyk
IMPORTANTE: QUESTO NON È UN INDICATORE AUTONOMO Questo strumento NON gestisce autonomamente Stop Loss o Take Profit e NON esegue alcuna logica di trading in modo indipendente. È progettato esclusivamente per funzionare in combinazione con One Click B3 MT4 Expert Advisor. Senza One Click B3 MT4 in esecuzione sullo stesso simbolo, questo indicatore visualizzerà solo il pulsante e NON controllerà la funzionalità SL/TP. Se non possiedi o non utilizzi One Click B3 MT4, questo prodotto non fornirà al
Symbol Positions Panel MT4
Mariusz Franciszek Szczepanczyk
Indicatore di monitoraggio del profitto delle posizioni MT4 Positions Profit Monitor è uno strumento avanzato e leggero (non utilizza buffer pesanti, ma solo timer ed etichette di testo) che visualizza profitti/perdite in tempo reale, il numero di posizioni di acquisto/vendita separatamente, i contatori di stop loss di acquisto/vendita separatamente, il totale del portafoglio e la somma completa di tutte le posizioni aperte sugli strumenti selezionati. Funziona su tutti i grafici dopo l'install
High Low Close MT4
Mariusz Franciszek Szczepanczyk
Alto Basso Chiusura Apertura MT4L'indicatore mostra i livelli Massimo, Minimo e Chiusura Precedente o Apertura Corrente per un intervallo di tempo selezionato come linee orizzontali e segmenti storici sul grafico. Funziona perfettamente sia sui conti di compensazione che di copertura sulle piattaforme MetaTrader 4. Tutti i livelli si aggiornano dinamicamente tramite timer ed eventi del grafico per una precisione in tempo reale. Caratteristiche principali - Linee del periodo corrente: disegna i
Volume Delta Scanner MT4
Mariusz Franciszek Szczepanczyk
Scanner delta di volume MT4 Volume Delta Scanner è un indicatore di mercato in tempo reale per MetaTrader 4 che monitora simultaneamente più simboli e intervalli temporali da un unico pannello. Invece di passare manualmente da un grafico all'altro, si ottiene una panoramica immediata della pressione di acquisto e vendita sull'intera watchlist in un colpo d'occhio. L'indicatore si basa sulla logica del Volume Delta: calcola la differenza tra pressione di acquisto e di vendita in base alla stru
TS Parameter Advisor MT4
Mariusz Franciszek Szczepanczyk
TS Parameter Advisor MT4 – Calcolatore automatico dei parametri di trailing stop per un clic B3 MT4 TS Parameter Advisor MT4 È un indicatore di supporto leggero che analizza l'andamento recente dei prezzi su qualsiasi strumento e calcola automaticamente i parametri del Trailing Stop pronti all'uso. Non apre, chiude o gestisce alcuna operazione. Il suo unico scopo è misurare quanto "nervoso" o "calmo" sia il mercato in un dato momento e trasformare tale misurazione in valori in pip concreti che
Symbol Positions Panel
Mariusz Franciszek Szczepanczyk
Indicatore di monitoraggio del profitto delle posizioni (MT5) Positions Profit Monitor è uno strumento avanzato e leggero (non utilizza buffer pesanti, solo timer ed etichette di testo) che visualizza profitti/perdite in tempo reale, il numero di posizioni di acquisto/vendita separatamente, i contatori di stop loss di acquisto/vendita separatamente, il totale del portafoglio e la somma completa di tutte le posizioni aperte sugli strumenti selezionati. Funziona su tutti i grafici dopo l'install
Asia Session Levels
Mariusz Franciszek Szczepanczyk
B_Asr MT5— Intervallo di sessioni asiatiche Asian Session Range è un indicatore semplice e intuitivo che disegna automaticamente i livelli di prezzo chiave in base alla sessione di trading asiatica, direttamente sul grafico. Nessun disegno manuale, nessuna configurazione complicata: basta caricarlo e iniziare a fare trading. COSA DISEGNA Una volta conclusa la sessione asiatica, l'indicatore traccia 7 livelli orizzontali per il resto della giornata di negoziazione: Massimo — massimo della sessi
Pips Label Last Trade
Mariusz Franciszek Szczepanczyk
B_Pipsy MT5 — Visualizzazione in tempo reale dei pip dell'ultima posizione Indicatore ultraleggero che mostra il profitto/perdita attuale in pip per la tua posizione aperta più recente sul simbolo corrente. Si aggiorna a ogni tick e fornisce una visualizzazione immediata di quanti pip sta guadagnando o perdendo la tua ultima operazione. ​ Caratteristiche principali Visualizzazione dei pip in tempo reale per l'ultima posizione aperta sul simbolo del grafico (ACQUISTA o VENDI rilevato automatic
SL TP Toggle Button
Mariusz Franciszek Szczepanczyk
IMPORTANTE: QUESTO NON È UN INDICATORE AUTONOMO Questo strumento NON gestisce autonomamente Stop Loss o Take Profit e NON esegue alcuna logica di trading in modo indipendente. È progettato esclusivamente per funzionare in combinazione con One Click B3 MT5 Expert Advisor. Senza One Click B3 MT5 in esecuzione sullo stesso simbolo, questo indicatore visualizzerà solo il pulsante e NON controllerà la funzionalità SL/TP. Se non possiedi o non utilizzi One Click B3 MT5, questo prodotto non fornirà al
One Click B3 MT5
Mariusz Franciszek Szczepanczyk
Questo non è solo un Expert Advisor per chiudere rapidamente le posizioni, indipendentemente dal numero di operazioni o strumenti aperti. È anche un Expert Advisor per controllare, proteggere e massimizzare il profitto percentuale da tutte le posizioni aperte a piattaforma chiusa. È un Expert Advisor che ti permette di dormire sonni tranquilli e riposare. È un Expert Advisor che continua a Lavorare anche quando ti godi il tuo breve momento di libertà, utilizzando i guadagni del tuo lavoro. Esam
Zoom MT5 B
Mariusz Franciszek Szczepanczyk
Zoom MT5 — Zoom fluido in stile TradingView + panoramica opzionale Trasforma la navigazione del grafico MT5 in un'esperienza TradingView: animazione zoom fluida con panoramica orizzontale opzionale a ogni clic della rotellina del mouse. 1 tick della rotellina = 1 zoom della barra degli strumenti + movimento fluido. Caratteristiche principali: Zoom fluido: cambio di scala graduale su SmoothSteps=8 fotogrammi con facilitazione di uscita Panoramica automatica opzionale con zoom: lo spostamento
High Low Close MT5
Mariusz Franciszek Szczepanczyk
Alto Basso Chiusura Apertura MT5L'indicatore mostra i livelli Massimo, Minimo e Chiusura Precedente o Apertura Corrente per un intervallo di tempo selezionato come linee orizzontali e segmenti storici sul grafico. Funziona perfettamente sia sui conti di compensazione che di copertura sulle piattaforme MetaTrader 5. Tutti i livelli si aggiornano dinamicamente tramite timer ed eventi del grafico per una precisione in tempo reale. Caratteristiche principali - Linee del periodo corrente: disegna i
Volume Delta Scanner MT5
Mariusz Franciszek Szczepanczyk
Scanner delta di volume MT5 Volume Delta Scanner è un indicatore di mercato in tempo reale per MetaTrader 5 che monitora simultaneamente più simboli e intervalli temporali da un unico pannello. Invece di passare manualmente da un grafico all'altro, si ottiene una panoramica immediata della pressione di acquisto e di vendita sull'intera watchlist in un colpo d'occhio. L'indicatore si basa sulla logica del Volume Delta: calcola la differenza tra pressione di acquisto e di vendita in base alla s
TS Parameter Advisor MT5
Mariusz Franciszek Szczepanczyk
TS Parameter Advisor MT5 – Calcolatore automatico dei parametri di trailing stop per B3 MT5 con un clic TS Parameter Advisor MT5 È un indicatore di supporto leggero che analizza l'andamento recente dei prezzi su qualsiasi strumento e calcola automaticamente i parametri del Trailing Stop pronti all'uso. Nie przyjmij tego, co może się nie zdarzyć. Il suo unico scopo è misurare quanto "nervoso" o "calmo" sia il mercato in un dato momento e trasformare tale misurazione in valori in pip concreti ch
Filtro:
Nessuna recensione
Rispondi alla recensione