Schaff trend cycle mt5 hp vision

STC Pro-Volume Dynamics: Advanced Momentum & Market Pressure Indicator

STC Pro-Volume Dynamics is a high-performance trend cycle indicator developed for MetaTrader 5. Engineered for systematic and discretionary traders who demand precision, it merges the proven Schaff Trend Cycle (STC) algorithm with an integrated visual analysis of execution volumes.

The objective of this tool is not to provide "magic" predictions, but to deliver a clear, stable, and statistically actionable reading of price dynamics, enabling traders to build high-reliability strategies.

⚙️ Core Technical Features

  • Secure Bicolor STC Oscillator: The indicator calculates momentum via a double-smoothed stochastic of the MACD. For instant visual feedback, the curve switches color (Green = Bullish / Pink = Bearish) only when it decisively crosses its signal line.

  • "Tick-Safe" Architecture (Anti-Jitter): Unlike standard STC indicators that "jitter" or "zigzag" with every price tick in real-time, this version utilizes isolated calculation buffers. The result is a smooth, stable, and no-repaint curve on the current bar. What you see on your screen is a fixed reflection of processed market data.

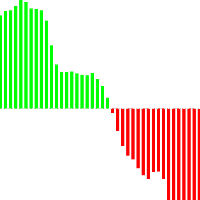
  • Symmetrical Volume Histograms (Level 50 Anchor): Price momentum is systematically cross-referenced with market activity. Volume histograms (Green for buyers, Red for sellers) are generated from the median equilibrium level (50).

    • Utility: Instantly identify if a STC cycle shift is backed by institutional liquidity or if it is a mere "dead cat bounce" lacking conviction (volume divergence).

📊 Trading Philosophy & Use Cases

This indicator is designed to eliminate market noise and "decision fatigue." It operates on a foundational principle: a cycle shift is only valid if it is technically stable and confirmed by volume.

It excels in:

  1. Trend Following: Entering on pullbacks when the overall price is above a long-term Moving Average, and the STC turns green alongside rising buyer volume.

  2. Strict Filtering: Ignoring "weak" STC signals where volume bars remain flat against the 50-level midline.

  3. Rigorous Backtesting: Thanks to its stabilized code, it allows for reliable statistical testing to approach and validate high win-rate targets over the long term.

Design Note: This tool is a powerful technical decision assistant. It must be integrated into a comprehensive strategy that includes strict Risk Management and Price Action context analysis.

Recommended products
The indicator builds current quotes, which can be compared with historical ones and on this basis make a price movement forecast. The indicator has a text field for quick navigation to the desired date. Options: Symbol - selection of the symbol that the indicator will display; SymbolPeriod - selection of the period from which the indicator will take data; IndicatorColor - indicator color; Inverse - true reverses quotes, false - original view; Next are the settings of the text field, in w
This indicator allows you to enjoy the two most popular products for analyzing request volumes and market deals at a favorable price: Actual Depth of Market Chart Actual Tick Footprint Volume Chart This product combines the power of both indicators and is provided as a single file. The functionality of Actual COMBO Depth of Market AND Tick Volume Chart is fully identical to the original indicators. You will enjoy the power of these two products combined into the single super-indicator! Below is
Supply Demand areas
Makarii Gubaydullin
Supply / demand zones: observable areas where price has approached many times in the past. Multifunctional trade manager:  66+ features , including this indicator  |   Contact me  for any questions  |  MT4 version The indicator shows where the price could potentially be reversed again. Usually, the more times the price has been rejected from the level, the more significant it is. In the input settings   you can adjust: Enable or disbale   Weak zones; Show or hide   zone description; Font size;
This is an open interest indicator for the Russian FORTS futures market. Now, you can receive data on the open interest in real time in МТ5 terminal. This allows you to develop brand new trading strategies or considerably improve the existing ones. The data on the open interest is received from the database (text CSV or binary one at user's discretion). Thus, upon completion of a trading session and disabling the terminal (or PC), the data is saved and uploaded to the chart when the terminal is
PipFinite Binary Options PRO MT5
Karlo Wilson Vendiola
4.29 (14)
This LEGIT Indicator Can Accurately Predict the Outcome of One Bar. Imagine adding more filters to further increase your probability! Unlike other products, Binary Options PRO can analyze past signals giving you the statistical edge. How Increase Your Probability Information revealed here www.mql5.com/en/blogs/post/727038 NOTE: The selection of a Good Broker is important for the overall success in trading Binary Options. Benefits You Get Unique algorithm that anticipates price weakness. Gene
Was: $249  Now: $99   Market Profile defines a number of day types that can help the trader to determine market behaviour. A key feature is the Value Area, representing the range of price action where 70% of trading took place. Understanding the Value Area can give traders valuable insight into market direction and establish the higher odds trade. It is an excellent addition to any system you may be using. Inspired by Jim Dalton’s book “Mind Over Markets”, this indicator is designed to suit the
TRI Visualizer
Yoshimi Mon 三 Ura
TRI Visualizer MT5 – Thermodynamic Market Analysis Overview The TRI (Thermal Range Indicator) Visualizer Enhanced is a rare market analysis indicator that goes beyond conventional technical analysis, applying principles of thermodynamics from physics. It interprets market price fluctuations as “thermodynamic energy,” enabling the highly accurate detection of subtle market changes that are often overlooked. Innovative Mechanisms 1. Dual Calculation Engines Classic TRI Mode Formula: |Close
This indicator acts as an advanced chart analysis assistant for traders who love trading Chart Patterns. It is designed to reduce the burden of visual analysis and increase accuracy in making a profit. Main features of this indicator from a practical usage perspective: 1. Automated Pattern Detection Saves time and reduces bias: You don't need to manually draw trendlines. The indicator will search for price swings (Pivot High/Low) and automatically draw Rising Wedge and Falling Wedge structures w
Volume Force MT5
Thiago Pereira Pinho
Volume FORCE PRO - THE ADVANCED VOLUME INDICATOR FOR METATRADER 5 Discover the Power of Real Volume with Volume Force Pro – The Revolution in Market Analysis! Stop Trading in the Dark! Visualize the strength of Big Players in real-time. The Problem Every Trader Faces: Have you ever wondered why some market moves fail even when every technical indicator points in the same direction? The answer lies in REAL VOLUME —the most critical piece of the puzzle that most traders ignore! The only volume ind
This indicator shows a candle combination based on dodge, dodge and pin bar. The logic of the pattern is to stand on the side of strength, after uncertainty. The indicator is universal and is useful for trading binary options, forex, ETFs, cryptocurrency, stocks. The indicator supports timeframes from M5 to MN, including non-standard TF presented in MT5. (М5,М6,М10,M12, M15, M20, M30, H1, H2, H3, H4, H6, H8, H12, D1, W1, MN). The ability to enable and disable TF is implemented. Sound alerts and
FourAverageMT5
Mikhail Sergeev
5 (2)
FourAverage is a new word in trend detection. With the development of information technology and a large number of participants, financial markets are becoming less amenable to analysis by outdated indicators. Conventional technical analysis tools, such as a Moving Average or Stochastic, in their pure form are not able to determine the direction of a trend or its reversal. Can one indicator indicate the correct direction of the future price, without changing its parameters, based on the history
BoxChart MT5
Evgeny Shevtsov
5 (7)
The market is unfair if only because 10% of participants manage 90% of funds. An ordinary trader has slim changes to stand against these "vultures". This problem can be solved. You just need to be among these 10%, learn to predict their intentions and move with them. Volume is the only preemptive factor that faultlessly works on any timeframe and symbol. First, the volume appears and is accumulated, and only then the price moves. The price moves from one volume to another. Areas of volume accumu
Here   our more valuable tools SMC Trend Trading   ,  Easy SMC Trading  ,  Institutional SMC Architect Volume Analysis Tools  ,  Volume flow Profile  ,  Market volume profile  , FVG with Volume  , Liquidity Heatmap Profile  ,  Volume Spread Analysis The    Liquidity Heatmap   is a sophisticated institutional trading tool designed to reveal where over-leveraged traders are trapped. By calculating estimated liquidation levels based on volume spikes and leverage, this indicator draws a dynamic "h
US30NinjaMT5
Satyaseelan Shankarananda Moodley
US30 Ninja is a 5 minute scalping indicator that will let know you when there is a trade set up (buy or sell). Once the indicator gives the trade direction, you can open a trade and use a 30 pip stop loss and a 30 pip to 50 pip take profit. Please trade at own own risk. This indicator has been created solely for the US30 market and may not yield positive results on any other pair. 
Reversal Master for MT5 Reversal Master for MT5 is a non‑repainting reversal indicator for MetaTrader 5. It helps you detect potential market reversal points and shows the maximum favourable price movement after each historical signal, so you can better understand how price behaved after similar situations in the past. The MT5 version keeps the familiar reversal‑signal logic of the original Reversal Master for MT4, but adds improved visualisation, historical statistics and a points summary panel
Volume Delta Scanner MT5
Mariusz Franciszek Szczepanczyk
Volume Delta Scanner MT5 Volume Delta Scanner is a real-time market scanning indicator for MetaTrader 5 that monitors multiple symbols and timeframes simultaneously from a single panel. Instead of switching between charts manually, you get an instant overview of buying and selling pressure across your entire watchlist in one glance. The indicator is built on Volume Delta logic — it calculates the difference between buying and selling pressure based on candle structure and tick volume, giving
##   ONLY GOLD ##   Тiльки Золото ## **Mercaria Professional Trading Zones - Complete Guide** ## **Mercaria Professional Trading Zones - Повний посібник** ### **How Mercaria Zones Work / Як працюють зони Mercaria** **English:** Mercaria Zones is an advanced trading indicator that identifies high-probability support and resistance areas using ZigZag extremes combined with mathematical zone calculations. The indicator works on multiple timeframes simultaneously, providing a comprehensive view
Passband Filter Pro Passband Filter Pro is a trend and cycle oscillator for MetaTrader 5. It is built on the Ehlers Super Passband Filter, a band pass filter that removes long term trend drift and short term noise so that only the dominant market cycle remains. The result is a clean oscillator with a color cloud that shows overbought and oversold conditions, cycle turns, and momentum on forex, gold, indices, stocks and crypto. Most traders enter too early or too late. Simple moving averages la
Let us introduce you to a new era of neural indicators for financial markets! Intelligent Moving is a unique indicator that trains its neural network in real time! You no longer need to look for the optimal indicator parameters for each specific situation. No more late signals. The artificial intelligence is able to adapt itself and predict any market movements. Visually, the indicator is drawn as a main solid moving average line, two dotted lines of standard deviations and signal arrows. For
Volume Profile V6
Andrey Kolesnik
4.8 (5)
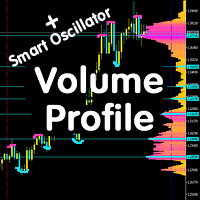
Market Volume Profile indicator + Smart Oscillator. Works on almost all instruments — currency pairs, stocks, futures, cryptocurrencies — using both real and tick volumes. You can set the profile range either automatically (for example, a week, a month, etc.) or manually by moving the boundaries (two vertical lines: red and blue). The profile is displayed as a histogram. The width of the histogram at a given level represents, conditionally, the number of trades executed at that level. The "Mode
Smart trend pro
Israr Hussain Shah
Here   our more valuable tools SMC Trend Trading   ,  Easy SMC Trading  ,  Institutional SMC Architect Volume Analysis Tools  ,  Volume flow Profile  ,  Market volume profile  , FVG with Volume  , Liquidity Heatmap Profile  ,  Volume Spread Analysis Professional trend-following indicator with comprehensive visualization and control panel Key Features: Advanced Trend Detection Reliable Half Trend algorithm for precise trend identification Color-coded trend lines (Blue for bullish, Orange for
Here   our more valuable tools SMC Trend Trading   ,  Easy SMC Trading  ,  Institutional SMC Architect Volume Analysis Tools  ,  Volume flow Profile  ,  Market volume profile  , FVG with Volume  , Liquidity Heatmap Profile  ,  Volume Spread Analysis Transform Your Trading with Intelligent Market Insights! The 2025 Spike Killer Dashboard is a powerful MQL5 indicator that combines cutting-edge signal generation with an intuitive crystal dashboard for real-time market analysis. Designed for tra

TradeAQ
Guo Sheng Zhao
LuoMo Volume & Price Structure 8.98 A multi-function chart indicator for   MetaTrader 4 and MetaTrader 5 , designed to display key volume, volatility, sentiment, and price-structure information directly on the main chart. Main Features Volume and price-based Support & Resistance Volume spike and exhaustion signals ATR volatility expansion alerts Volume Profile with HVN and LVN Bullish and bearish sentiment distribution Developing or fixed POC VAH and VAL levels Supply and Demand zones Volume-wei
Volume Profile Multiple — Multi-Block Volume Profiles with Buffers for Algorithmic Trading Tired of drawing Volume Profile block by block, redrawing and recalculating every time you change timeframe? Volume Profile Multiple automatically plots several consecutive volume profiles on the chart, revealing where institutional interest actually sat in each segment of the market — not just in the last visible range. What it does for you The indicator splits the price history into blocks of N candles e
LevelsHunter Pro
Dmitrii Kovalevskii
LevelsHunter Pro – Professional Volume Profile with History Analysis What it is LevelsHunter Pro is a volume profile indicator that not only shows current POC, VAH and VAL levels but also allows you to   go back in time   and see where these levels were at the moment of any past trade. This is not a tool for guessing on the chart. It is for   cold analysis   of what has already happened. Why a trader needs this The problem:   Most indicators only show "here and now". You close a trade and want t
VR Grid Mt5
Vladimir Pastushak
3 (9)
The VR Grid indicator is designed to create a graphical grid with user-defined settings. Unlike the standard grid , VR Grid is used to build circular levels . Depending on the user's choice, the step between the round levels can be arbitrary. In addition, unlike other indicators and utilities, VR Grid maintains the position of the grid even when the time period changes or the terminal is rebooted. You can find settings, set files, demo versions, instructions, problem solving, at [blog] You can
FREE
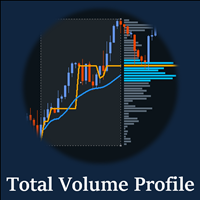
Includes almost all the concepts related to Volume Profile: POC , Value Area , Developing POC , Anchored VWAP , Volume Delta ; since the “Total” in its name. It is fast in its calculations and simple to work with. Features: 1.    Selectable calculation timeframe to find most traded levels. 2.    Capable of calculating Volume Profile based on tick data 3.    Adjustable histogram bars by their count. 4.    Adjustable histogram bars by their height (price range). 5.    Showing Value Area (VA
Crypto_Forex Indicator "CCI FLAT Detector" - is an efficient auxiliary tool in trading! No Repaint. I offer you to upgrade your trading methods with this great indicator for MT5. - Indicator shows price Flat areas on the chart. It has "Flat sensitivity" parameter - which is responsible for flat detection. - "CCI FLAT Detector" can be used for Price Action entries confirmation or in combination with other indicators. - You can use it for trend following systems to detect flat zones and avoid tra
# DRAWDOWN INDICATOR V4.0 - The Essential Tool to Master Your Trading ## Transform Your Trading with a Complete Real-Time Performance Overview In the demanding world of Forex and CFD trading, **knowing your real-time performance** isn't a luxury—it's an **absolute necessity**. The **Drawdown Indicator V4.0** is much more than a simple indicator: it's your **professional dashboard** that gives you a clear, precise, and instant view of your trading account status. --- ## Why This Indicator
The PrimeX7Trader Auto-Visible Volume Profile is a next-generation, highly optimized market analysis tool designed specifically for serious traders who require extreme precision without terminal freezing. Unlike traditional volume profiles that clutter your chart with manual lines or slow down your platform by calculating thousands of unseen historical bars, this indicator dynamically reads only the visible viewport. It is engineered for fast, manual trade execution, making it the perfect compan
Buyers of this product also purchase
Trend Sniper X
Sarvarbek Abduvoxobov
4.86 (42)
Trend Sniper X is a multi-timeframe trend-following indicator for MetaTrader 5 that helps traders identify trend direction and potential reversal points with clarity and precision. for MT4: https://www.mql5.com/en/market/product/193245 Price Information: The current price is promotional and is subject to change as upcoming updates and new features are released. Bonus Offer: To get the FREE Auto-Trade Assistant EA for this indicator, please message the author after purchasing. Code2Profit Channe
Smart Trend Trading System — MetaTrader 5 Message me on MQL5 after purchase to receive Smart Universal Expert Advisor for FREE, plus the online course, PDF manual, and private group access. STTS brings trend direction, entry and exit signals, reversal zones, and important price levels together on your chart. Follow the system manually, or connect a separate compatible EA for automated execution using your chosen settings. ONE SYSTEM. FOUR TRADING APPROACHES. STTS organizes its trading approaches
Zoryk Gold
Reda El Koutbane
4.78 (18)
discount ends SOON next price 69 $ ZORYK — Advanced XAUUSD Signal System for MetaTrader 5 You know the feeling. You spend time analyzing gold. You wait for the entry. You finally open the trade, and price immediately moves against you. You close too early, move the Stop Loss or hesitate for a few seconds. Then the market reaches the exact destination you originally expected without you. The direction was not always the problem. The real problem was uncertainty. You did not know exactly where th
A new King in town - Indicator + Order management indications(tp1+tp2+tp3) + Optional Telegram Signal sender   INCLUDED (FREE) + Bonus EA Robot ( FULL TRADING  and SIGNAL SYSTEM ) Our best EA for Gold: Gold Slayer TRY > Reversion Queen  Expert advisor NEW Free Automation EA link < click here ( disclaimer: this is new and still on testing and phase , use at your risk on demo) Free Telegram Bridge < click here  This indicator includes an advanced Strategy, a trading system with customisable order
M5 Sniper
MeanFX
5 (3)
Get your trading edge in the line of sight M5 Sniper   is a new indicator by MeanFX. It combines   precise trading signals   with   adaptive TP/SL levels   - creating best possible statistical trades as a result! The price increases every 5 purchases, the next price is 79$ Message me after purchase to receive tips/guide and bonus EA What makes it stand out?   Proven statistical performance   on Gold XAUUSD ( works almost on every asset focusing on mastering one timeframe instead of trying to
SMC Intraday Formula
VividMind Digital Solutions
5 (26)
Secure the Lowest Price Today. After purchase, contact via   MQL5 inbox   to receive your buyer kit and bonus. Let's be honest first. No indicator will make you profitable on its own. If someone tells you otherwise, they're selling you a dream. Every indicator that shows perfect buy/sell arrows can be made to look flawless — just zoom into the right window of history and screenshot the winners. We won't do that. SMC Intraday Formula is a tool. It reads the market structure for you, maps the hig
SuperScalp Pro
Van Minh Nguyen
4.54 (37)
SuperScalp Pro - Professional Multi-Layer Confluence Scalping System SuperScalp Pro is an advanced scalping indicator that upgrades classic Supertrend with multiple intelligent confirmation filters. It helps you identify higher-probability Buy/Sell opportunities while significantly reducing false signals. Clear Buy and Sell arrows appear directly on the chart, with automatic ATR-based Stop Loss and Take Profit levels calculated in real time. After purchase, contact me for setup guidance and reco
Auto Optimized SpeedAngle is an institutional-grade momentum vectoring system that eliminates curve-fitting through continuous Walk-Forward Optimization (WFO). Rather than relying on static inputs that degrade when market regimes shift, the indicator dynamically recalibrates its parameters using Out-of-Sample (OOS) validation, ensuring the displayed signals represent genuine statistical edges rather than historical anomalies. By shifting the focus from subjective visual angles to normalized, qua
Boba Analysis Suite
Trade Ready Solutions LLC
5 (1)
Boba Analysis Suite Boba Analysis Suite is an analytical indicator for MetaTrader 5. It brings market structure, relevant price zones and broader market context together in a single chart view. Developed through practical experience as a trader and trading coach, it supports a structured analysis process: assessing market direction, identifying important levels and considering multiple timeframes together. Analysis in Context Individual signals gain meaning through context. Boba Analysis Suite h
GoldenX Entry MT5
VividMind Digital Solutions
5 (17)
Price will increase by $20 every 10 buyers to maintain premium value. After purchase, contact via   MQL5 inbox   to receive your buyer kit and bonus. You have probably tested dozens of indicators before. But we are not here to be “just another signals indicator.” Behind GoldenX Entry is intensive research & development focused on building sophisticated algorithms designed to adapt to the real behavior of every instrument — not generic signals recycled everywhere else. From advanced Auto Optim
Entry Points Pro 10 — the legend of the MQL5 Market. Three years in the Market's Top-3. 595 reviews across two versions. Over 31,000 demo downloads. Thousands of traders open their charts with it every morning. Built and traded by an author who has been in the market since 1999. Version 10 is the biggest rebuild in the indicator's history: I read every review from five years — and built the answers into the code. WHAT IT DOES It shows the entry point in advance — strictly without repainting. The
Adaptive Price Action Engine Buy Indicator- Get EA Based on it for FREE. Self-Optimizing Multi-Timeframe Trend & Candlestick Intelligence Markets do not behave the same way all the time—and not every price-action pattern has the same value in every market regime. Adaptive Price Action Engine is designed to adapt to changing market conditions by combining trend structure, multi-timeframe analysis, candlestick patterns, and statistical optimization into one analytical framework. Two Adaptive Mode
ARIPoint
Temirlan Kdyrkhan
1 (4)
ARIPoint is a powerful trading companion designed to generate high-probability entry signals with dynamic TP/SL/DP levels based on volatility. Built-in performance tracking shows win/loss stats, PP1/PP2 hits, and success rates all updated live. Key Features: Buy/Sell signals with adaptive volatility bands Real-time TP/SL/DP levels based on ATR Built-in MA Filter with optional ATR/StdDev volatility Performance stats panel (Success, Profit/Loss, PP1/PP2) Alerts via popup, sound, push, or email Cu
Gann Made Easy   is a professional and easy to use Forex trading system which is based on the best principles of trading using the theory of W.D. Gann. The indicator provides accurate BUY and SELL signals including Stop Loss and Take Profit levels. You can trade even on the go using PUSH notifications. PLEASE CONTACT ME AFTER PURCHASE TO GET TRADING  INSTRUCTIONS   AND GREAT EXTRA INDICATORS  FOR FREE! Probably you already heard about the Gann trading methods before. Usually the Gann theory is a
M1 Sniper MT5
Oleg Rodin
5 (7)
M1 SNIPER  is an easy to use trading indicator system. It is an arrow indicator which is designed for M1 time frame. The indicator can be used as a standalone system for scalping on M1 time frame and it can be used as a part of your existing trading system. Though this trading system was designed specifically for short-term trading, it still can be helpful for all traders. This trading system can be used with any forex pair and time frame, though lower time frames are recommended from M1 up to M
FiboSniper Pro
Van Minh Nguyen
5 (4)
FiboSniper Pro - Multi-Filter Fibonacci System with Auto SL/TP and Control Panel FiboSniper Pro is a technical indicator that combines dynamic Fibonacci Envelopes with multiple confirmation filters to generate selective Buy and Sell signals. Fibonacci levels are calculated from Moving Average and ATR, then filtered by ADX, EMA, RSI, ATR, Volume, Time and Candle structure. The indicator displays automatic ATR-based Stop Loss and Take Profit levels directly on the chart, along with an interactive
Get Ready for 2 Major New Features in Our Next Update — Coming Soon! We’re taking market analysis to the next level with 2 new features designed to meet your trading needs. Introducing: TRADE OVERVIEW DASHBOARD CONFLUENCE AT ZONE 1. TRADE OVERVIEW DASHBOARD The Complete Market Overview, All on One Screen Stop wasting time going through charts one by one. This dashboard brings key information from multiple timeframes together, helping you see the overall market picture more easily. Multi-Timefr
Break and Retest Hunter
Mohamed Hassan
3.67 (3)
Break and Retest Hunter is a powerful MetaTrader 5 indicator designed to automatically identify support and resistance levels, breakout structures, and potential retest opportunities in real time. Bonus Indicator: After purchasing Break and Retest Hunter , contact me to receive Trade Indicator Assistant EA completely free as a bonus utility. $65 for the next 10 copies . Next price is $120.  Combining adaptive market analysis, clear BUY/SELL signals, Fibonacci-based profit targets, and a premiu
Apex Patterns PRO Buy Indicator - Get Expert Advisor Based on it for FREE. Self-Optimizing Chart Pattern & Breakout Intelligence Traditional pattern scanners rely on fixed inputs, often underperforming when market volatility and structures shift. Apex Patterns PRO is designed to adapt to changing market conditions by combining structural chart pattern recognition, momentum filtering, and statistical self-optimization into one analytical framework. Adaptive Scanning Engine Self-Optimizing Patter
Gold Trend Coach MT5
Cristhian Alexander Gaibor Cuasquer
5 (2)
Gold Trend Coach is a gold (XAUUSD) trend indicator for MetaTrader 5 with buy and sell signals, stop loss and three take profit targets, confirmed on bar close, a multi-timeframe coach dashboard and alerts to your phone and Telegram. Built for M5 scalping and M15 intraday during the London and New York sessions. Gold Trend Coach: XAUUSD gold trend signals with entry, stop and three targets. Launch price $39 for the first 20 copies, next price $59. Write me after purchase and your buyer kit is o
Neuro Poseidon MT5
Daria Rezueva
4.75 (52)
Neuro Poseidon is a new indicator by Daria Rezueva. It combines precise trading signals with adaptive TP/SL levels - creating best possible trades as a result! Message me and get  Neuro Poseidon Assistant  as a gift to automize your trading process! What makes it stand out? 1. Proven profitability on all assets and timeframes 2. Only confirmed BUY and SELL signals present on the chart 3. Adaptive TP & SL levels generated by the software for each trade 4. Easy to understand - suitable for al
Trend Catcher ind mt5
Ramil Minniakhmetov
5 (18)
TREND CATCHER INDICATOR Trend Catcher Indicator analyzes market price movements, using a combination of the author’s proprietary and customized adaptive trend-analysis indicators.  It identifies the true market direction by filtering out short-term noise and focusing on underlying momentum strength, volatility expansion, and price structure behavior.  It also uses a combination of smoothing and trend-filtering customized indicators such as moving averages, RSI, and volatility filters.   Real ope
Unix Scalper
Issam Kassas
4 (4)
Unix Scalper — MetaTrader 5 Message me on MQL5 after purchase to receive Smart Universal Expert Advisor for FREE, plus the online course, PDF manual, and private group access. Find the setup. See the plan. Choose how to trade it. UNIX Scalper brings market analysis, BUY/SELL/WAIT decisions and Entry, Stop Loss, TP1 and TP2 levels into one organized panel. SEE THE SIGNAL AND THE PLAN • Clear decisions: BUY, SELL or WAIT. • Defined levels: Entry, Stop Loss, TP1 and TP2. • Multi-timeframe overvie
Advanced Supply Demand MT5
Bernhard Schweigert
4.53 (15)
Best Solution for any Newbie or Expert Trader! This indicator is a unique, high quality and affordable trading tool because we have incorporated a number of proprietary features and a new formula. With this update, you will be able to show double timeframe zones. You will not only be able to show a higher TF but to show both, the chart TF, PLUS the higher TF: SHOWING NESTED ZONES. All Supply Demand traders will love it. :) Important Information Revealed Maximize the potential of Advanced Supply
FX Trend MT5 NG
Daniel Stein
5 (6)
FX Trend NG: The Next Generation Multi-Market Trend Intelligence Overview FX Trend NG is a professional multi-timeframe trend and market monitoring tool designed to give you a complete structural overview of the market in seconds. Instead of switching between dozens of charts, you instantly see which symbols are trending, where momentum is fading, and where strong alignment exists across timeframes. This tool is part of the Stein Investments ecosystem - 18+ tools plus Max, your 1-on-1 AI tradi
Introducing   Quantum Breakout PRO , the groundbreaking MQL5 Indicator that's transforming the way you trade Breakout Zones! Developed by a team of experienced traders with trading experience of over 13 years,   Quantum Breakout PRO   is designed to propel your trading journey to new heights with its innovative and dynamic breakout zone strategy. Quantum Breakout Indicator will give you signal arrows on breakout zones with 5 profit target zones and stop loss suggestion based on the breakout b
Scalper Vault is a powerful, fully-equipped trading system designed for traders who want to achieve consistency in intraday trading . This high-precision indicator serves as a complete, standalone trading system that delivers institutional-grade analysis for both Forex and Binary Options traders. PLEASE CONTACT ME AFTER PURCHASE TO GET MY TRADING TIPS PLUS A GREAT BONUS! By eliminating the guesswork and complex manual analysis, Scalper Vault allows you to focus purely on execution using easy to
Volatility Master for MetaTrader is a real-time dashboard tool that scans up to  50 symbols  to identify high-volatility , trending markets instantly. With bullish/bearish signals, customizable alerts, and a user-friendly interface, it helps you avoid range-bound conditions and focus on high-probability trades. Clarity leads to confidence. Trade confidently and protect your capital effectively with this powerful dashboard. We don't offer free or bonus indicators in exchange of reviews from you.
Smart Price Action Concepts — MetaTrader 5 Message me on MQL5 after purchase to receive Smart Universal Expert Advisor for FREE, plus the online course, PDF manual, and private group access. See the structure. Identify the zones. Build your trading plan. Bring Smart Money Concepts (SMC), ICT-style analysis and price action together in one organized chart. Identify market structure, order blocks, liquidity reference levels and imbalances, then choose which elements to display through the Smart Pa
SR Liquidity   is a trading indicator designed to reveal the hidden zones where market liquidity concentrates and price reacts most strongly. These special liquidity areas act as powerful support and resistance levels, giving you a clear map of where the market is most likely to reverse. Instead of drawing ordinary Support/Resistance lines, SR Liquidity analyzes real price behavior to detect the zones where buying and selling pressure accumulate. These are actually the pools of liquidity that dr
More from author
Xauxag panel gestion mt5
Vincent Albert Feugier
XAU/XAG Panel Gestion Introduction Gold (XAU) vs. Silver (XAG) arbitrage is a cornerstone strategy for hedge funds and institutional traders. This professional-grade panel for MetaTrader 5 provides an all-in-one control station to exploit correlation gaps and relative strength between these two precious metals. Designed for surgical precision, it automates complex ratio calculations and risk management to ensure flawless execution. 1. Dual-Leg Trading System (Arbitrage) Unlike standard directio
Pairs synthetique mt5
Vincent Albert Feugier
Pairs Synthetic Pro (Synthetic Pairs & Spread) Master Correlation Trading Correlation trading and statistical arbitrage are now within your reach thanks to the Pairs Synthetic Pro indicator. This tool goes beyond simple ratio analysis, acting as a specialized radar for detecting price imbalances between two assets to anticipate market corrections. For example, when Brent rises while WTI lags, the price spread widens. Our indicator, integrated with adaptive Bollinger Bands, identifies when this d
Vortex oscillator mt5
Vincent Albert Feugier
VORTEX OSCILLATOR: The Power of Volume Flow VORTEX OSCILLATOR is an advanced trading tool that transforms the classic Vortex indicator into a highly responsive precision oscillator. Designed for traders who demand absolute clarity, it merges price action and volume to reveal the true strength behind every market movement. What Makes VORTEX OSCILLATOR Unique Most indicators simply follow price, often resulting in late entries. VORTEX OSCILLATOR utilizes a mathematical approach centered on Volume-
Fisher Transform MT4
Vincent Albert Feugier
Fisher Transform by HYPOLITE MAKER – Professional Precision Oscillator Experience the definitive version of the Fisher Transform, engineered by HYPOLITE MAKER. The Fisher Transform is renowned for spotting price reversals before they happen. However, the standard version is often too sensitive to market noise. Fisher Transform by HYPOLITE MAKER fixes these issues to provide a stable, highly visual, and profitable trading experience. What makes this version superior to the standard indicator? To
Price Manipulation Risk Indicator Advanced Risk Assessment and Manipulation Detection Tool The Price Manipulation Risk Indicator is a professional tool designed to measure the current level of market risk. It analyzes price behavior, market activity, and candle dynamics to identify unstable or potentially manipulated phases. This tool helps traders avoid traps, filter out false signals, and improve entry and exit timing. Product Objective Provide a visual and immediate assessment of market condi
Kst pro tools MT4
Vincent Albert Feugier
KST Pro Tools: Advanced Momentum Indicator KST Pro Tools is an advanced and optimized implementation of Martin Pring’s Know Sure Thing (KST) indicator. Designed for traders seeking an objective reading of market momentum, this tool filters out market noise to highlight only the phases of directional acceleration. Through intelligent filtering logic, KST Pro Tools allows you to quickly identify dominant trends and distinguish between phases of strength and periods of neutrality. Key Features Opti
Canal icare MT4
Vincent Albert Feugier
ICARUS CHANNEL The ICARUS CHANNEL is a technical indicator designed to identify extreme price zones and optimize your entry and exit points in the market. How It Works The tool is based on a Simple Moving Average (SMA) , which represents the fair market value. Around this line, it identifies overbought (Premium) and oversold (Discount) zones: Premium Zone (Orange): Price is considered too high. Ideal for selling (short). Discount Zone (Blue): Price is considered a bargain. Ideal for buying (long
Four rsi mt4
Vincent Albert Feugier
Multi-RSI: 4 RSI in 1 for Comprehensive and Fast Market Analysis Analyze market strength and momentum like a professional. Multi-RSI combines four distinct RSI indicators into a single window, providing a clear view of market dynamics across multiple timeframes. Each RSI features a configurable period to adapt to your specific trading strategies and styles. Key Features 4 RSI in one indicator: Track multiple timeframes simultaneously. Fully customizable periods: Individually adjust each RSI to f
Pairs synthetique mt4
Vincent Albert Feugier
Pairs Synthetic Pro (Synthetic Pairs & Spread) Master Correlation Trading Correlation trading and statistical arbitrage are now within your reach thanks to the Pairs Synthetic Pro indicator. This tool goes beyond simple ratio analysis, acting as a specialized radar for detecting price imbalances between two assets to anticipate market corrections. For example, when Brent rises while WTI lags, the price spread widens. Our indicator, integrated with adaptive Bollinger Bands, identifies when this d
Vortex oscillator mt4
Vincent Albert Feugier
VORTEX OSCILLATOR: The Power of Volume Flow VORTEX OSCILLATOR is an advanced trading tool that transforms the classic Vortex indicator into a highly responsive precision oscillator. Designed for traders who demand absolute clarity, it merges price action and volume to reveal the true strength behind every market movement. What Makes VORTEX OSCILLATOR Unique Most indicators simply follow price, often resulting in late entries. VORTEX OSCILLATOR utilizes a mathematical approach centered on Volume-
True strength index mt4
Vincent Albert Feugier
TrueStrength Oscillator v1.00 Visual representation Thick blue line: The main TSI, which tracks market momentum. Thick red line: The signal line, which follows the main line closely to identify crossovers. Thin blue bars: Histogram bars extending from the zero line to the main blue line. Dotted gray line: The zero level, providing a clear reference for trend reversals. Operational advantages Fixed scale: The range remains constant between -0.000001 and +0.000001 for consistent reading. No repain
Klinger Volume Oscillator  Short Description A volume-based flow analysis tool designed to visualize buying and selling pressure through a dual-colored histogram. Detailed Description The Klinger Volume Oscillator Histo is a technical analysis indicator that explores the relationship between price movement and transactional volume. By converting the traditional Klinger Oscillator into a dynamic histogram, this tool allows traders to observe the internal strength of market movements. The indicato
Price manipulation risk
Vincent Albert Feugier
Price Manipulation Risk Indicator Advanced Risk Assessment and Manipulation Detection Tool The Price Manipulation Risk Indicator is a professional tool designed to measure the current level of market risk. It analyzes price behavior, market activity, and candle dynamics to identify unstable or potentially manipulated phases. This tool helps traders avoid traps, filter out false signals, and improve entry and exit timing. Product Objective Provide a visual and immediate assessment of market condi
Kst pro tools
Vincent Albert Feugier
KST Pro Tools: Advanced Momentum Indicator KST Pro Tools is an advanced implementation of the famous Know Sure Thing (KST) indicator by Martin Pring. Designed for traders seeking an objective reading of momentum, this tool filters out market noise to highlight only the phases of directional acceleration. Through an intelligent filtering logic, KST Pro Tools allows you to quickly identify dominant trends and distinguish strong momentum phases from periods of market neutrality. Key Features Optimi
Canal icare
Vincent Albert Feugier
ICARUS CHANNEL The ICARUS CHANNEL is a technical indicator designed to identify extreme price zones and optimize your entry and exit points in the market. How It Works The tool is based on a Simple Moving Average (SMA) , which represents the fair market value. Around this line, it identifies overbought (Premium) and oversold (Discount) zones: Premium Zone (Orange): Price is considered too high. Ideal for selling (short). Discount Zone (Blue): Price is considered a bargain. Ideal for buying (long
Four rsi mt5
Vincent Albert Feugier
Multi-RSI: 4 RSI in 1 for Comprehensive and Fast Market Analysis Analyze market strength and momentum like a professional. Multi-RSI combines four distinct RSI indicators into a single window, providing a clear view of market dynamics across multiple timeframes. Each RSI features a configurable period to adapt to your specific trading strategies and styles. Key Features 4 RSI in one indicator: Track multiple timeframes simultaneously. Fully customizable periods: Individually adjust each RSI to f
Fisher Transform MT5
Vincent Albert Feugier
Fisher Transform by HYPOLITE MAKER – Professional Precision Oscillator Experience the definitive version of the Fisher Transform, engineered by HYPOLITE MAKER. The Fisher Transform is renowned for spotting price reversals before they happen. However, the standard version is often too sensitive to market noise. Fisher Transform by HYPOLITE MAKER fixes these issues to provide a stable, highly visual, and profitable trading experience. What makes this version superior to the standard indicator? To
True strength index mt5
Vincent Albert Feugier
5 (1)
TrueStrength Oscillator v1.00 Visual representation Thick blue line: The main TSI, which tracks market momentum. Thick red line: The signal line, which follows the main line closely to identify crossovers. Thin blue bars: Histogram bars extending from the zero line to the main blue line. Dotted gray line: The zero level, providing a clear reference for trend reversals. Operational advantages Fixed scale: The range remains constant between -0.000001 and +0.000001 for consistent reading. No repain
Klinger Volume Oscillator  Short Description A volume-based flow analysis tool designed to visualize buying and selling pressure through a dual-colored histogram. Detailed Description The Klinger Volume Oscillator Histo is a technical analysis indicator that explores the relationship between price movement and transactional volume. By converting the traditional Klinger Oscillator into a dynamic histogram, this tool allows traders to observe the internal strength of market movements. The indicat
Forex flux liquidity
Vincent Albert Feugier
The Ultimate Raw Strength & Currency Flow Analyzer for MetaTrader 5. FOREX FLUX LIQUIDITY is a high-precision dashboard designed to instantly identify where the "smart money" is moving. By scanning up to 28 currency pairs simultaneously, this tool filters out market noise to reveal the true intrinsic strength and current liquidity of every major currency. 1. Reading and Interpretation The interface utilizes a dual-visual system for lightning-fast decision-making: The Power Gauge: Measures the cu
Canal of shizukesa
Vincent Albert Feugier
SHIZUKESA Channel – Precision Volatility via Kijun Dynamics The SHIZUKESA Channel (Japanese for "Serenity") is a high-performance technical analysis tool built for traders who demand structural clarity. Unlike standard envelopes or Bollinger Bands that fluctuate with noise, this channel is mathematically rigid : it creates a 100% synchronized clone of the Kijun-Sen to identify objective price deviations. Core Features & Functionality Perfect Clone Structure : The bands do not rely on variable st
Trend series indicator
Vincent Albert Feugier
The Trend Series Indicator is a momentum-based tool designed to isolate and quantify the persistence of price cycles. While traditional oscillators like RSI or Stochastics often "flatten" during strong trends, the TSI measures the actual duration of the current market impulse. How It Works The indicator tracks the sequence of consecutive directional closes: Green Bars (Positive): Counts the streak of bullish candles. Each new higher close increments the bar (+1, +2, +3...). Red Bars (Negative):
Trading isn't just about whether the price is going up or down; it's about how it is moving. The DPO is a structural indicator that neutralizes the underlying trend to isolate the market's pure cyclic component. What is the DPO, really? Mathematically, the DPO measures the distance between the current price and its moving average. It doesn't follow direction: It measures speed and acceleration. The "Detrending" concept: By subtracting the trend (the average), the indicator "flattens" the price.
Candle liquidity volume
Vincent Albert Feugier
Volume Color Candles v1.02   is an MT5 indicator that colors candlesticks based on their direction and relative volume. Bullish candles transition from light green to dark green, bearish candles from light red to dark red, featuring 8 gradient levels per direction (16 individually adjustable colors total). Parameters : 21 inputs including 16 customizable colors, volume average period (20), "high volume only" option, and threshold multiplier (1.2x). The algorithm compares current tick_volume to i
Why MarketSentiment Pro? Standard indicators only look at a single timeframe, leaving you blind to the bigger picture. Our proprietary algorithm analyzes 4 simultaneous time cycles across 4 different assets on a single screen. This gives you a unique "Eagle Eye" view of the market. Relative Strength Algorithm: Pure mathematical calculation based on the price position within its recent range ( $Position = \frac{Price - Low}{High - Low}$ ). 80% Reliability Target: By waiting for all 4 gauges to
Trail of SMOKE
Vincent Albert Feugier
Trail of SMOKE v1.0 The Kinetic Footprint of Price. Trail of SMOKE is an advanced momentum indicator that transforms raw volatility into a fluid visual structure. While traditional indicators merely follow price with a lag, Trail of SMOKE projects market energy to identify zones of real acceleration and institutional exhaustion. The Science Behind the "SMOKE" The name isn't just for aesthetics. The indicator functions like an aerodynamic slipstream: Force Projection: It calculates the gap betwee
Lyapunov exponent
Vincent Albert Feugier
Lyapunov Exponent Indicator for MT5 Measures the rate at which nearby market trajectories diverge over time — a concept from chaos theory applied to price series. What it measures The speed at which two initially close market states diverge. Fast divergence indicates a chaotic/trending regime. Convergence indicates a stable/consolidating regime. Reading the indicator Value near 1 → market in chaotic / trending regime Value near 0 → market in stable / ranging regime White line : Lyapunov exponent
Asymmetry lnp
Vincent Albert Feugier
ASYMMETRY OF LOSSES & PROFITS — MT5 Indicator The concept Most traders know their loss in %. Few know how much they need to gain to get back to breakeven. This is the mathematical asymmetry of markets: losing 50% doesn't require +50% to recover — it requires +100% . The bigger the loss, the more disproportionate the recovery effort. Loss Required gain to recover -10% +11.1% -25% +33.3% -50% +100% -75% +300% -90% +900% This indicator makes that number visible, continuously, directly on your MT5 c
NOTIFY PANEL            Your trading dashboard delivered straight                   to your pocket — in real time OVERVIEW NotifyPanel is a lightweight Expert Advisor featuring 3 buttons that instantly sends your trading data as push notifications to your smartphone via the MetaTrader 5
Kurtosis indicator
Vincent Albert Feugier
What is Kurtosis? Kurtosis is a statistical indicator that measures the flatness of the price distribution over a given period. More precisely, it quantifies the importance of extreme price movements compared to a normal distribution. A normal distribution has a kurtosis of 3 — this is the red reference line on the indicator. Formula Kurtosis = m₄ / (m₂)² Where m₂ is the variance of prices and m₄ is the 4th central moment. The more extreme price shocks occurred over the period, the larger the nu
Filter:
No reviews
Reply to review