Kurtosis indicator

What is Kurtosis?

Kurtosis is a statistical indicator that measures the flatness of the price distribution over a given period. More precisely, it quantifies the importance of extreme price movements compared to a normal distribution. A normal distribution has a kurtosis of 3 — this is the red reference line on the indicator.

Formula

Kurtosis = m₄ / (m₂)²

Where m₂ is the variance of prices and m₄ is the 4th central moment. The more extreme price shocks occurred over the period, the larger the numerator m₄ becomes, and the higher the kurtosis rises.

How to read the indicator

The blue curve is the main value. It oscillates around level 3 (red dotted line). The grey horizontal levels (1, 5, 7, 9, 11) serve as visual reference points to gauge intensity. The real-time value is displayed directly at the tip of the blue curve.

When the curve rises above 3, the market has produced abnormally violent moves over the period. When it drops below 3, prices are moving in a uniform and calm fashion, without extremes.

Practical interpretation

Kurtosis above 3 — leptokurtic regime. The market has experienced sudden shocks, abnormally long candles. This is typical of economic announcements, session openings, or range breakouts. The risk of a violent move is high. Pay attention to position sizing.

Kurtosis equal to 3 — normal regime. Prices are behaving in an ordinary way. Neither too calm nor too explosive. Neutral regime.

Kurtosis below 3 — platykurtic regime. The market is consolidating, prices are moving in a regular and predictable manner. Little risk of surprise. Typical of ranging phases or low liquidity periods.

Key signal to watch

A kurtosis that sharply rebounds from a low level indicates that a violent move has just occurred or is forming. This is not a directional indicator — it does not tell you whether the market will go up or down — but it tells you how much the market is deviating from its normal behaviour.

Recommended settings on H1

For classic day trading on H1, period 50 is the best compromise. It covers approximately 2.5 days of candles, which is statistically sufficient to obtain a stable value without lagging too far behind events. Below 20, the signal becomes too erratic. Above 100, it reacts too slowly to be useful for intraday trading.


Recommended products
The indicator builds current quotes, which can be compared with historical ones and on this basis make a price movement forecast. The indicator has a text field for quick navigation to the desired date. Options: Symbol - selection of the symbol that the indicator will display; SymbolPeriod - selection of the period from which the indicator will take data; IndicatorColor - indicator color; Inverse - true reverses quotes, false - original view; Next are the settings of the text field, in w
Price Magnet — Price Density and Attraction Levels Indicator Price Magnet is a professional analytical tool designed to identify key support and resistance levels based on statistical Price Density. The indicator analyzes a specified historical period and detects price levels where the market spent the most time. These zones act as “magnets,” attracting price action or forming a structural base for potential reversals. Unlike traditional Volume Profile tools, Price Magnet focuses on price-time d
XAUUSD OrderFlow Structure AutoPOC Pro is an advanced MetaTrader 5 indicator designed to analyze market structure, order flow, buying and selling pressure, liquidity, and volume distribution directly on the chart. The indicator is especially focused on XAUUSD (Gold) analysis, although it can also be used with other instruments available in MetaTrader 5. Its objective is to bring together several analytical tools that would normally require multiple indicators: market structure, BOS and CHOCH, Or
Was: $249  Now: $99   Market Profile defines a number of day types that can help the trader to determine market behaviour. A key feature is the Value Area, representing the range of price action where 70% of trading took place. Understanding the Value Area can give traders valuable insight into market direction and establish the higher odds trade. It is an excellent addition to any system you may be using. Inspired by Jim Dalton’s book “Mind Over Markets”, this indicator is designed to suit the
Order Book, known also as Market Book, market depth, Level 2, - is a dynamically updated table with current volumes of orders to buy and to sell specific financial instument at price levels near Bid and Ask. MetaTrader 5 provides the means for receiving market book from your broker, but in real time only, without access to its history. The indicator OrderBook Cumulative Indicator accumulates market book data online and visualizes them on the chart. In addition, the indicator can show the market
BoxChart MT5
Evgeny Shevtsov
5 (7)
The market is unfair if only because 10% of participants manage 90% of funds. An ordinary trader has slim changes to stand against these "vultures". This problem can be solved. You just need to be among these 10%, learn to predict their intentions and move with them. Volume is the only preemptive factor that faultlessly works on any timeframe and symbol. First, the volume appears and is accumulated, and only then the price moves. The price moves from one volume to another. Areas of volume accumu
Volume Profile Multiple — Multi-Block Volume Profiles with Buffers for Algorithmic Trading Tired of drawing Volume Profile block by block, redrawing and recalculating every time you change timeframe? Volume Profile Multiple automatically plots several consecutive volume profiles on the chart, revealing where institutional interest actually sat in each segment of the market — not just in the last visible range. What it does for you The indicator splits the price history into blocks of N candles e
MR Volume Profile 5
Sergey Khramchenkov
The "MR Volume Profile 5" indicator is a charting tool that displays trading volume at different price levels rather than time intervals. A key concept in volume profile is the point of control (POC)—the price level with the highest volume traded during the session or time range. While tools like VWAP or OBV provide volume trends, the "MR Volume Profile 5" indicator offers granular detail about where the most market activity occurs at specific price levels. This makes it a more precise tool for
Flow Architect
Alex Amuyunzu Raymond
Flow Architect Lite - Professional Market Structure Toolkit Free Version Features: Core Structure Analysis: Daily VWAP Engine   - Volume-weighted average price for institutional level tracking Standard Deviation Bands (SD1)   - Dynamic support and resistance zones Break of Structure Detection   - Visual markers for market structure shifts Fair Value Gap Identification   - Highlighted imbalance zones on your charts ATR Volatility Context   - Real-time Average True Range measurement Clean Informat
The Super Arrow Indicator provides non-repainting buy and sell signals with exceptional accuracy. Key Features No repainting – confirmed signals remain fixed Clear visual arrows: green for buy, red for sell Real-time alerts via pop-up, sound, and optional email Clean chart view with no unnecessary clutter Works on all markets: Forex, gold, oil, indices, crypto Adjustable Parameters TimeFrame Default:   "current time frame" Function:   Sets the time frame for indicator calculation Options:   Can
Volume Profile Canvas - Professional Volume Profile Indicator for MetaTrader 5 DESCRIPTION Volume Profile Canvas is a professional volume profile indicator for MetaTrader 5 that renders directly on the chart using a high-performance Canvas engine. It calculates and displays the volume distribution across price levels, identifying the Point of Control (POC), Value Area High (VAH) and Value Area Low (VAL) in real time. This is a pure analysis tool. It does not trade. It gives you an instant vi
Wapv Price and volume
Eduardo Da Costa Custodio Santos
The WAPV Price and Volume Indicator for MT5 is part of the ( Wyckoff Academy Wave Market ) and (Wyckoff Academy Price and Volume) toolset. The WAPV Price and Volume Indicator for MT5 was created to make it easy to visualize the volume movement on the chart in an intuitive way. With it you can observe the moments of peak volume and moments when the market has no professional interest Identify moments when the market is moving by inertia and not by movement of "smart money". It consists of 4 color
VOLUME PROFILE SAF-XII                            Professional Market Profile Analysis for MT5   (The Definitive Tool for Grid & Mean-Reversion Traders)         WHAT IS VOLUME PROFILE? Volume Profile is a professional institutional tool that displays trading activity at specific price levels, unlike traditional volume indicators that show volume over time. It reveals WHERE trading occurred, within your window of choice, helping identify:   • FAIR VALUE AREAS (VAH/VAL) - Price levels wh
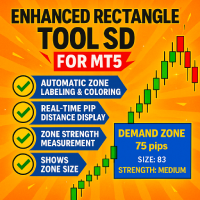
The Smart Supply and Demand Rectangle Tool Indicator is your ultimate MT5 companion for instantly visualizing key supply and demand data—right where you need it: on your zones, in real time. This tool automatically overlays rich, actionable data ontop of your zones, such as zone classification, pip distance, strength, and zone size—cleanly positioned inside each zone. No more clutter, no more guessing—just clear, dynamic insights to support your decisions. Built for Traders. Powered by Precis
Weis Wave Scouter
Jean Carlos Martins Roso
Discover the power of advanced volume analysis with Weis Wave Scouter, a revolutionary indicator for MetaTrader 5 that combines the proven principles of the Wyckoff method and Volume Spread Analysis (VSA). Designed for traders seeking precision and depth in their operations, this indicator offers a tactical reading of the market through cumulative volume wave analysis, helping to identify key points of trend reversals and continuations. Weis Wave Scouter features a clear visual interface with co
TradeAQ
Guo Sheng Zhao
LuoMo Volume & Price Structure 8.98 A multi-function chart indicator for   MetaTrader 4 and MetaTrader 5 , designed to display key volume, volatility, sentiment, and price-structure information directly on the main chart. Main Features Volume and price-based Support & Resistance Volume spike and exhaustion signals ATR volatility expansion alerts Volume Profile with HVN and LVN Bullish and bearish sentiment distribution Developing or fixed POC VAH and VAL levels Supply and Demand zones Volume-wei
Mirror Chart MT5
Andrej Hermann
5 (1)
The Mirror Chart MT5 is a overlay indicator specifically designed to project a second financial instrument directly onto the main chart window. This tool is invaluable for traders who rely on correlation analysis, as it visualizes the price movements of two different instruments in real time. Unlike traditional overlays, this indicator utilizes intelligent, dynamic centering and scaling logic. It continuously analyzes the visible price range in the current window for both symbols and calculates
FREE
Symbol: EURUSD Timeframe: 30 minutes (M30) For other symbols or timeframes, adjust the settings to match the market. Volume Profile POC Breakout builds a volume profile from recent candles, finds the Point of Control (POC) and marks clean breakouts of that level. Each breakout is shown as a complete trade plan with entry, stop loss and three take profit levels, filtered by the higher timeframe trend and rated by a quality score. The indicator does not open trades. It is a visual and analysis to
Volume Bars
DARIO GALLIONE
An effective indicator that highlights candles with increasing volumes, overshadowing those with shrinking volumes. Also suitable for Forex because it uses tick_volume.  You can set the colors to your liking. It will be easier to spot trends and possible reversals. The increasing volumes indicate the presence of large investors and therefore determine the reliability of the candle under observation
This is Gekko's Cutomized Cutomized Average Directional Index (ADX), a customized version of the famous ADX indicator. Use the regular ADX and take advantage two entry signals calculations and different ways of being alerted whenever there is potential entry or exit point. Inputs Period: Period for the ADX calculation; PlotSignalType: How will the indicator calculate entry (swing) signals: 1- ShowSwingsOnTrendLevel : Show Signals for Trend Confirmation Swings; 2- ShowSwingsOnTrendLevelDirection
This indicator acts as an advanced chart analysis assistant for traders who love trading Chart Patterns. It is designed to reduce the burden of visual analysis and increase accuracy in making a profit. Main features of this indicator from a practical usage perspective: 1. Automated Pattern Detection Saves time and reduces bias: You don't need to manually draw trendlines. The indicator will search for price swings (Pivot High/Low) and automatically draw Rising Wedge and Falling Wedge structures w
Market Levels Edge
Alessandro Farinella
MarketLevelsEdge is a market-structure overlay for MetaTrader 5 that plots the key levels institutional and retail order flow actually react to — previous day/week high and low, session VWAP, and daily open — and fuses them into a single, easy-to-read confluence score. It does not generate trade signals on its own: it is built to sit alongside your own strategy, sharpening your read of market bias and flagging the price zones where reversals or breakouts are statistically more likely to happen.
PivotWave
Jeffrey Quiatchon
Introducing PivotWave – your ultimate trading companion that redefines precision and market analysis. Designed with traders in mind, PivotWave is more than just an indicator; it’s a powerful tool that captures the pulse of the market, identifying key turning points and trends with pinpoint accuracy. PivotWave leverages advanced algorithms to provide clear visual signals for optimal entry and exit points, making it easier for traders to navigate volatile market conditions. Whether you are a begin
Deriv Synthetic HTF Candle Projection GMT2 Higher Timeframe Candle Projection & Previous Levels Tool for Deriv Synthetic Indices (MT5) Overview Deriv Synthetic HTF Candle Projection GMT2 is a professional MetaTrader 5 indicator built specifically for Deriv Synthetic indices . It projects the current forming Higher Timeframe (HTF) candle onto the chart and automatically draws key reference levels from previous candles. This indicator is designed to help traders maintain higher timeframe context
FREE
BBMA with EMA50
Teeraporn Satitman
This indicator consist of Standard BBMA Standard signal Sign on chart added EMA50 Behavior Tracking: The chart background changes color based on the EMA50 (default is black) and shifts to white when a breakout of the Bollinger Bands occurs. Three Engulfing Color Change: Automatically adjusts colors to help you easily determine market zones. default yellow/white High-Low Line Sign: Highlights the potential trading range and key price levels for better visual  MHV
FREE
The Donchian Time Sync Analyzer brings powerful multi-timeframe dimension to classic Donchian channel analysis, allowing traders to simultaneously monitor trend strength and potential reversal signals across five different chart periods. This advanced indicator calculates the highest highs and lowest lows across your selected timeframes, generating clear visual signals that help identify convergence of trend direction across multiple time horizons. By providing coordinated analysis from minute t
VSA Wyckoff Volume is a volume analysis tool built on Volume Spread Analysis (VSA) and Wyckoff methodology principles. Instead of showing raw volume bars, it classifies every bar's volume relative to its own trailing average, making it immediately clear when a bar's activity is unusually high or low — often the first sign of institutional participation, climax moves, or exhaustion. Key Features: 1. Six-Level Volume Classification Each volume bar is compared against a Wilder-smoothed volume movi
POC level MT5
Mikhail Nazarenko
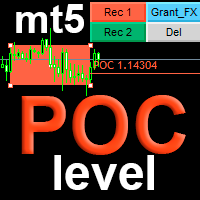
The indicator automatically calculates       and displays the level of the maximum       real   volume Point Of Control (POC) of the Market Profile for the   array of candles   highlighted by a rectangular area. This will significantly increase the accuracy of your position entries when trading POC bounces and reversals. Attention when testing the demo version!   In the MT5 strategy tester , there is no possibility of dragging a rectangle and this is a problem of limitations of the MT5 strategy
ApeX Trade Manager MT5  →     ApeX Journal MT5  →     ApeX Indicator SMC MT5  →     ApeX Indicator ICT Concepts MT5  →     ApeX Indicator Volume Profile MT5  →    ApeX Indicator ICT Macros MT5  → One profile per session tells you about the session. One profile per swing tells you about the trade you are in. ApeX Volume Profile builds a profile for every pivot the market makes. 1. The profile Point of Control — The price where the most volume traded in that leg, optionally extended right or bo
Buyers of this product also purchase
Trend Sniper X
Sarvarbek Abduvoxobov
4.86 (42)
Trend Sniper X is a multi-timeframe trend-following indicator for MetaTrader 5 that helps traders identify trend direction and potential reversal points with clarity and precision. for MT4: https://www.mql5.com/en/market/product/193245 Price Information: The current price is promotional and is subject to change as upcoming updates and new features are released. Bonus Offer: To get the FREE Auto-Trade Assistant EA for this indicator, please message the author after purchasing. Code2Profit Channe
A new King in town - Indicator + Order management indications(tp1+tp2+tp3) + Optional Telegram Signal sender   INCLUDED (FREE) + Bonus EA Robot ( FULL TRADING  and SIGNAL SYSTEM ) Our best EA for Gold: Gold Slayer TRY > Reversion Queen  Expert advisor >JOIN Community Channel < NEW Free Automation EA link < click here ( disclaimer: this is new and still on testing and phase , use at your risk on demo) Free Telegram Bridge < click here  This indicator includes an advanced Strategy, a trading sys
Smart Trend Trading System — MetaTrader 5 Message me on MQL5 after purchase to receive Smart Universal Expert Advisor for FREE, plus the online course, PDF manual, and private group access. STTS brings trend direction, entry and exit signals, reversal zones, and important price levels together on your chart. Follow the system manually, or connect a separate compatible EA for automated execution using your chosen settings. ONE SYSTEM. FOUR TRADING APPROACHES. STTS organizes its trading approaches
Zoryk Gold
Reda El Koutbane
4.76 (17)
discount ends SOON next price 69 $ ZORYK — Advanced XAUUSD Signal System for MetaTrader 5 You know the feeling. You spend time analyzing gold. You wait for the entry. You finally open the trade, and price immediately moves against you. You close too early, move the Stop Loss or hesitate for a few seconds. Then the market reaches the exact destination you originally expected without you. The direction was not always the problem. The real problem was uncertainty. You did not know exactly where th
M5 Sniper
MeanFX
5 (3)
Get your trading edge in the line of sight M5 Sniper   is a new indicator by MeanFX. It combines   precise trading signals   with   adaptive TP/SL levels   - creating best possible statistical trades as a result! The price increases every 5 purchases, the next price is 79$ Message me after purchase to receive tips/guide and bonus EA Auto Optimisation only works on LIVE chart , needs data feed >JOIN Community Channel < What makes it stand out?   Proven statistical performance   on Gold XAUUSD
SuperScalp Pro
Van Minh Nguyen
4.54 (37)
SuperScalp Pro - Professional Multi-Layer Confluence Scalping System SuperScalp Pro is an advanced scalping indicator that upgrades the classic Supertrend with multiple intelligent confirmation filters. It helps you identify higher-probability Buy/Sell opportunities while significantly reducing false signals. Clear Buy and Sell arrows appear directly on the chart, along with automatic ATR-based Stop Loss and Take Profit levels calculated in real time. After purchase, please message me on MQL5 to
SMC Intraday Formula
VividMind Digital Solutions
5 (26)
Secure the Lowest Price Today. After purchase, contact via   MQL5 inbox   to receive your buyer kit and bonus. Let's be honest first. No indicator will make you profitable on its own. If someone tells you otherwise, they're selling you a dream. Every indicator that shows perfect buy/sell arrows can be made to look flawless — just zoom into the right window of history and screenshot the winners. We won't do that. SMC Intraday Formula is a tool. It reads the market structure for you, maps the hig
Entry Points Pro 10 — the legend of the MQL5 Market. Three years in the Market's Top-3. More than 600 reviews across two versions. More than 28,000 demo downloads. Thousands of traders open their charts with it every morning. Built and traded by an author who has been in the market since 1999. Version 10 is the biggest rebuild in the indicator's history: I read every review from five years — and built the answers into the code. WHAT IT DOES It shows the entry point in advance — strictly without
GoldenX Entry MT5
VividMind Digital Solutions
5 (17)
Price will increase by $20 every 10 buyers to maintain premium value. After purchase, contact via   MQL5 inbox   to receive your buyer kit and bonus. You have probably tested dozens of indicators before. But we are not here to be “just another signals indicator.” Behind GoldenX Entry is intensive research & development focused on building sophisticated algorithms designed to adapt to the real behavior of every instrument — not generic signals recycled everywhere else. From advanced Auto Optim
Auto Optimized SpeedAngle is an institutional-grade momentum vectoring system that eliminates curve-fitting through continuous Walk-Forward Optimization (WFO). Rather than relying on static inputs that degrade when market regimes shift, the indicator dynamically recalibrates its parameters using Out-of-Sample (OOS) validation, ensuring the displayed signals represent genuine statistical edges rather than historical anomalies. By shifting the focus from subjective visual angles to normalized, qua
ARIPoint
Temirlan Kdyrkhan
1 (4)
ARIPoint is a powerful trading companion designed to generate high-probability entry signals with dynamic TP/SL/DP levels based on volatility. Built-in performance tracking shows win/loss stats, PP1/PP2 hits, and success rates all updated live. Key Features: Buy/Sell signals with adaptive volatility bands Real-time TP/SL/DP levels based on ATR Built-in MA Filter with optional ATR/StdDev volatility Performance stats panel (Success, Profit/Loss, PP1/PP2) Alerts via popup, sound, push, or email Cu
Gann Made Easy   is a professional and easy to use Forex trading system which is based on the best principles of trading using the theory of W.D. Gann. The indicator provides accurate BUY and SELL signals including Stop Loss and Take Profit levels. You can trade even on the go using PUSH notifications. PLEASE CONTACT ME AFTER PURCHASE TO GET TRADING  INSTRUCTIONS   AND GREAT EXTRA INDICATORS  FOR FREE! Probably you already heard about the Gann trading methods before. Usually the Gann theory is a
M1 Sniper MT5
Oleg Rodin
5 (7)
M1 SNIPER  is an easy to use trading indicator system. It is an arrow indicator which is designed for M1 time frame. The indicator can be used as a standalone system for scalping on M1 time frame and it can be used as a part of your existing trading system. Though this trading system was designed specifically for short-term trading, it still can be helpful for all traders. This trading system can be used with any forex pair and time frame, though lower time frames are recommended from M1 up to M
Adaptive Price Action Engine Buy Indicator- Get EA Based on it for FREE. Self-Optimizing Multi-Timeframe Trend & Candlestick Intelligence Markets do not behave the same way all the time—and not every price-action pattern has the same value in every market regime. Adaptive Price Action Engine is designed to adapt to changing market conditions by combining trend structure, multi-timeframe analysis, candlestick patterns, and statistical optimization into one analytical framework. Two Adaptive Mode
Power Candles MT5
Daniel Stein
4.58 (12)
Power Candles - Self-Optimizing Strength Indicator Strength usually lives in a sub-window. The line runs below, the candle above, and your eye keeps connecting the two. Power Candles puts the strength into the candle itself, colored from dark red to dark green, so the chart reads at a glance and the sub-window stays closed. The indicator also finds its own settings for the symbol and timeframe in front of you. One click on [ Apply Best ] draws entry, Stop Loss and Take Profit at the exact prices
Next Update — Version 2.52 Coming Soon! [NEW] Get Ready for 4 Major New Features Designed to Enhance Your Market Analysis and Trading Workflow We’re taking market analysis to the next level with 4   new features designed to meet your trading needs. Introducing: TRADE OVERVIEW DASHBOARD CONFLUENCE AT ZONE STRONG & WEAK HIGH/LOW OTE 1. TADE OVERVIEW DASHBOARD  A dashboard that helps you understand the overall market picture more easily, providing guidance to support your trading decisions and h
Boba Analysis Suite
Trade Ready Solutions LLC
5 (2)
Boba Analysis Suite Boba Analysis Suite is an analytical indicator for MetaTrader 5. It brings market structure, relevant price zones and broader market context together in a single chart view. Developed through practical experience as a trader and trading coach, it supports a structured analysis process: assessing market direction, identifying important levels and considering multiple timeframes together. Analysis in Context Individual signals gain meaning through context. Boba Analysis Suite h
FiboSniper Pro
Van Minh Nguyen
5 (4)
FiboSniper Pro - Multi-Filter Fibonacci System with Auto SL/TP and Control Panel FiboSniper Pro is a technical indicator that combines dynamic Fibonacci Envelopes with multiple confirmation filters to generate selective Buy and Sell signals. Fibonacci levels are calculated from Moving Average and ATR, then filtered by ADX, EMA, RSI, ATR, Volume, Time and Candle structure. The indicator displays automatic ATR-based Stop Loss and Take Profit levels directly on the chart, along with an interactive
Tokyo mt5 Indicator
Vasiliy Strukov
5 (12)
Tokyo Indicator provides a clear visual overview of trend direction, potential trading signals, and market conditions. Its colour-coded, stepped trend line distinguishes bullish phases in blue from bearish phases in magenta. Matching directional arrows highlight potential buying and selling opportunities when the displayed trend changes. An integrated dashboard brings together the current signal, market bias, momentum, volatility, and signal quality in one convenient view. This allows traders t
Trend Catcher ind mt5
Ramil Minniakhmetov
5 (18)
TREND CATCHER INDICATOR Trend Catcher Indicator analyzes market price movements, using a combination of the author’s proprietary and customized adaptive trend-analysis indicators.  It identifies the true market direction by filtering out short-term noise and focusing on underlying momentum strength, volatility expansion, and price structure behavior.  It also uses a combination of smoothing and trend-filtering customized indicators such as moving averages, RSI, and volatility filters.   Real ope
Gold Trend Coach MT5
Cristhian Alexander Gaibor Cuasquer
5 (2)
Gold Trend Coach is a gold (XAUUSD) trend indicator for MetaTrader 5 with buy and sell signals, stop loss and three take profit targets, confirmed on bar close, a multi-timeframe coach dashboard and alerts to your phone and Telegram. Built for M5 scalping and M15 intraday during the London and New York sessions. Gold Trend Coach: XAUUSD gold trend signals with entry, stop and three targets. Launch price $39 for the first 20 copies, next price $59. Write me after purchase and your buyer kit is o
Quantum TrendPulse
Bogdan Ion Puscasu
5 (26)
Introducing Quantum TrendPulse , the ultimate trading tool that combines the power of SuperTrend , RSI , and Stochastic into one comprehensive indicator to maximize your trading potential. Designed for traders who seek precision and efficiency, this indicator helps you identify market trends, momentum shifts, and optimal entry and exit points with confidence. Key Features: SuperTrend Integration: Easily follow the prevailing market trend and ride the wave of profitability. RSI Precision: Detect
Neuro Poseidon MT5
Daria Rezueva
4.75 (52)
Neuro Poseidon is a new indicator by Daria Rezueva. It combines precise trading signals with adaptive TP/SL levels - creating best possible trades as a result! Message me and get  Neuro Poseidon Assistant  as a gift to automize your trading process! What makes it stand out? 1. Proven profitability on all assets and timeframes 2. Only confirmed BUY and SELL signals present on the chart 3. Adaptive TP & SL levels generated by the software for each trade 4. Easy to understand - suitable for al
Azimuth Pro
Ottaviano De Cicco
5 (7)
Azimuth Pro V2: Synthetic Fractal Structure and Confirmed Entries for MT5 Overview Azimuth Pro is a multi-level swing structure indicator by Merkava Labs . Four nested swing layers, swing-anchored VWAP, ABC pattern detection, three-timeframe structural filtering, and closed-bar confirmed entries — one chart, one workflow from micro-swings to macro-cycles. This is not a blind signal product. It is a structure-first workflow for traders who care about location, context, and timing. Halloween P
Introducing   Quantum Breakout PRO , the groundbreaking MQL5 Indicator that's transforming the way you trade Breakout Zones! Developed by a team of experienced traders with trading experience of over 13 years,   Quantum Breakout PRO   is designed to propel your trading journey to new heights with its innovative and dynamic breakout zone strategy. Quantum Breakout Indicator will give you signal arrows on breakout zones with 5 profit target zones and stop loss suggestion based on the breakout b
Multi Currency Strength and Momentum Indicator MT5 Dynamic Forex28 Navigator is the evolution of our long-time, popular indicators, combining the power of three into one: Advanced Currency Strength28 Indicator (700 reviews) Advanced Currency IMPULSE with ALERT (530 reviews) CS28 Combo Signals (recent Bonus) The two predecessor indicators together have received more than 1,200 reviews on the MQL5 Market and have been a staple in the MT4 community since 2016. Dynamic Forex28 Navigator MT5 carries
Scalper Vault is a powerful, fully-equipped trading system designed for traders who want to achieve consistency in intraday trading . This high-precision indicator serves as a complete, standalone trading system that delivers institutional-grade analysis for both Forex and Binary Options traders. PLEASE CONTACT ME AFTER PURCHASE TO GET MY TRADING TIPS PLUS A GREAT BONUS! By eliminating the guesswork and complex manual analysis, Scalper Vault allows you to focus purely on execution using easy to
Volatility Master for MetaTrader is a real-time dashboard tool that scans up to  50 symbols  to identify high-volatility , trending markets instantly. With bullish/bearish signals, customizable alerts, and a user-friendly interface, it helps you avoid range-bound conditions and focus on high-probability trades. Clarity leads to confidence. Trade confidently and protect your capital effectively with this powerful dashboard. We don't offer free or bonus indicators in exchange of reviews from you.
SR Liquidity   is a trading indicator designed to reveal the hidden zones where market liquidity concentrates and price reacts most strongly. These special liquidity areas act as powerful support and resistance levels, giving you a clear map of where the market is most likely to reverse. Instead of drawing ordinary Support/Resistance lines, SR Liquidity analyzes real price behavior to detect the zones where buying and selling pressure accumulate. These are actually the pools of liquidity that dr
OrderFlux – Orderflow Footprint Chart, Volume Profile & Market Profile Indicator for MetaTrader 5 OrderFlux is an order flow footprint indicator for MetaTrader 5 that explains itself. It opens the single candle and shows what happens inside it: the volume traded at every price level, split into aggressive buyers and aggressive sellers. From the ticks it builds a complete footprint chart in real time with delta, imbalance, absorption, volume profile, market profile (TPO), VWAP, cumulative delta (
More from author
Pairs synthetique mt5
Vincent Albert Feugier
Pairs Synthetic Pro (Synthetic Pairs & Spread) Master Correlation Trading Correlation trading and statistical arbitrage are now within your reach thanks to the Pairs Synthetic Pro indicator. This tool goes beyond simple ratio analysis, acting as a specialized radar for detecting price imbalances between two assets to anticipate market corrections. For example, when Brent rises while WTI lags, the price spread widens. Our indicator, integrated with adaptive Bollinger Bands, identifies when this d
Vortex oscillator mt5
Vincent Albert Feugier
VORTEX OSCILLATOR: The Power of Volume Flow VORTEX OSCILLATOR is an advanced trading tool that transforms the classic Vortex indicator into a highly responsive precision oscillator. Designed for traders who demand absolute clarity, it merges price action and volume to reveal the true strength behind every market movement. What Makes VORTEX OSCILLATOR Unique Most indicators simply follow price, often resulting in late entries. VORTEX OSCILLATOR utilizes a mathematical approach centered on Volume-
Fisher Transform MT4
Vincent Albert Feugier
Fisher Transform by HYPOLITE MAKER – Professional Precision Oscillator Experience the definitive version of the Fisher Transform, engineered by HYPOLITE MAKER. The Fisher Transform is renowned for spotting price reversals before they happen. However, the standard version is often too sensitive to market noise. Fisher Transform by HYPOLITE MAKER fixes these issues to provide a stable, highly visual, and profitable trading experience. What makes this version superior to the standard indicator? To
Four rsi mt5
Vincent Albert Feugier
Multi-RSI: 4 RSI in 1 for Comprehensive and Fast Market Analysis Analyze market strength and momentum like a professional. Multi-RSI combines four distinct RSI indicators into a single window, providing a clear view of market dynamics across multiple timeframes. Each RSI features a configurable period to adapt to your specific trading strategies and styles. Key Features 4 RSI in one indicator: Track multiple timeframes simultaneously. Fully customizable periods: Individually adjust each RSI to f
FREE
Price Manipulation Risk Indicator Advanced Risk Assessment and Manipulation Detection Tool The Price Manipulation Risk Indicator is a professional tool designed to measure the current level of market risk. It analyzes price behavior, market activity, and candle dynamics to identify unstable or potentially manipulated phases. This tool helps traders avoid traps, filter out false signals, and improve entry and exit timing. Product Objective Provide a visual and immediate assessment of market condi
Kst pro tools MT4
Vincent Albert Feugier
KST Pro Tools: Advanced Momentum Indicator KST Pro Tools is an advanced and optimized implementation of Martin Pring’s Know Sure Thing (KST) indicator. Designed for traders seeking an objective reading of market momentum, this tool filters out market noise to highlight only the phases of directional acceleration. Through intelligent filtering logic, KST Pro Tools allows you to quickly identify dominant trends and distinguish between phases of strength and periods of neutrality. Key Features Opti
Canal icare MT4
Vincent Albert Feugier
ICARUS CHANNEL The ICARUS CHANNEL is a technical indicator designed to identify extreme price zones and optimize your entry and exit points in the market. How It Works The tool is based on a Simple Moving Average (SMA) , which represents the fair market value. Around this line, it identifies overbought (Premium) and oversold (Discount) zones: Premium Zone (Orange): Price is considered too high. Ideal for selling (short). Discount Zone (Blue): Price is considered a bargain. Ideal for buying (long
Four rsi mt4
Vincent Albert Feugier
Multi-RSI: 4 RSI in 1 for Comprehensive and Fast Market Analysis Analyze market strength and momentum like a professional. Multi-RSI combines four distinct RSI indicators into a single window, providing a clear view of market dynamics across multiple timeframes. Each RSI features a configurable period to adapt to your specific trading strategies and styles. Key Features 4 RSI in one indicator: Track multiple timeframes simultaneously. Fully customizable periods: Individually adjust each RSI to f
FREE
Pairs synthetique mt4
Vincent Albert Feugier
Pairs Synthetic Pro (Synthetic Pairs & Spread) Master Correlation Trading Correlation trading and statistical arbitrage are now within your reach thanks to the Pairs Synthetic Pro indicator. This tool goes beyond simple ratio analysis, acting as a specialized radar for detecting price imbalances between two assets to anticipate market corrections. For example, when Brent rises while WTI lags, the price spread widens. Our indicator, integrated with adaptive Bollinger Bands, identifies when this d
Vortex oscillator mt4
Vincent Albert Feugier
VORTEX OSCILLATOR: The Power of Volume Flow VORTEX OSCILLATOR is an advanced trading tool that transforms the classic Vortex indicator into a highly responsive precision oscillator. Designed for traders who demand absolute clarity, it merges price action and volume to reveal the true strength behind every market movement. What Makes VORTEX OSCILLATOR Unique Most indicators simply follow price, often resulting in late entries. VORTEX OSCILLATOR utilizes a mathematical approach centered on Volume-
True strength index mt4
Vincent Albert Feugier
TrueStrength Oscillator v1.00 Visual representation Thick blue line: The main TSI, which tracks market momentum. Thick red line: The signal line, which follows the main line closely to identify crossovers. Thin blue bars: Histogram bars extending from the zero line to the main blue line. Dotted gray line: The zero level, providing a clear reference for trend reversals. Operational advantages Fixed scale: The range remains constant between -0.000001 and +0.000001 for consistent reading. No repain
Klinger Volume Oscillator  Short Description A volume-based flow analysis tool designed to visualize buying and selling pressure through a dual-colored histogram. Detailed Description The Klinger Volume Oscillator Histo is a technical analysis indicator that explores the relationship between price movement and transactional volume. By converting the traditional Klinger Oscillator into a dynamic histogram, this tool allows traders to observe the internal strength of market movements. The indicato
Price manipulation risk
Vincent Albert Feugier
Price Manipulation Risk Indicator Advanced Risk Assessment and Manipulation Detection Tool The Price Manipulation Risk Indicator is a professional tool designed to measure the current level of market risk. It analyzes price behavior, market activity, and candle dynamics to identify unstable or potentially manipulated phases. This tool helps traders avoid traps, filter out false signals, and improve entry and exit timing. Product Objective Provide a visual and immediate assessment of market condi
Kst pro tools
Vincent Albert Feugier
KST Pro Tools: Advanced Momentum Indicator KST Pro Tools is an advanced implementation of the famous Know Sure Thing (KST) indicator by Martin Pring. Designed for traders seeking an objective reading of momentum, this tool filters out market noise to highlight only the phases of directional acceleration. Through an intelligent filtering logic, KST Pro Tools allows you to quickly identify dominant trends and distinguish strong momentum phases from periods of market neutrality. Key Features Optimi
Canal icare
Vincent Albert Feugier
ICARUS CHANNEL The ICARUS CHANNEL is a technical indicator designed to identify extreme price zones and optimize your entry and exit points in the market. How It Works The tool is based on a Simple Moving Average (SMA) , which represents the fair market value. Around this line, it identifies overbought (Premium) and oversold (Discount) zones: Premium Zone (Orange): Price is considered too high. Ideal for selling (short). Discount Zone (Blue): Price is considered a bargain. Ideal for buying (long
Fisher Transform MT5
Vincent Albert Feugier
Fisher Transform by HYPOLITE MAKER – Professional Precision Oscillator Experience the definitive version of the Fisher Transform, engineered by HYPOLITE MAKER. The Fisher Transform is renowned for spotting price reversals before they happen. However, the standard version is often too sensitive to market noise. Fisher Transform by HYPOLITE MAKER fixes these issues to provide a stable, highly visual, and profitable trading experience. What makes this version superior to the standard indicator? To
True strength index mt5
Vincent Albert Feugier
5 (1)
TrueStrength Oscillator v1.00 Visual representation Thick blue line: The main TSI, which tracks market momentum. Thick red line: The signal line, which follows the main line closely to identify crossovers. Thin blue bars: Histogram bars extending from the zero line to the main blue line. Dotted gray line: The zero level, providing a clear reference for trend reversals. Operational advantages Fixed scale: The range remains constant between -0.000001 and +0.000001 for consistent reading. No repain
Klinger Volume Oscillator  Short Description A volume-based flow analysis tool designed to visualize buying and selling pressure through a dual-colored histogram. Detailed Description The Klinger Volume Oscillator Histo is a technical analysis indicator that explores the relationship between price movement and transactional volume. By converting the traditional Klinger Oscillator into a dynamic histogram, this tool allows traders to observe the internal strength of market movements. The indicat
Xauxag panel gestion mt5
Vincent Albert Feugier
XAU/XAG Panel Gestion Introduction Gold (XAU) vs. Silver (XAG) arbitrage is a cornerstone strategy for hedge funds and institutional traders. This professional-grade panel for MetaTrader 5 provides an all-in-one control station to exploit correlation gaps and relative strength between these two precious metals. Designed for surgical precision, it automates complex ratio calculations and risk management to ensure flawless execution. 1. Dual-Leg Trading System (Arbitrage) Unlike standard directio
Forex flux liquidity
Vincent Albert Feugier
The Ultimate Raw Strength & Currency Flow Analyzer for MetaTrader 5. FOREX FLUX LIQUIDITY is a high-precision dashboard designed to instantly identify where the "smart money" is moving. By scanning up to 28 currency pairs simultaneously, this tool filters out market noise to reveal the true intrinsic strength and current liquidity of every major currency. 1. Reading and Interpretation The interface utilizes a dual-visual system for lightning-fast decision-making: The Power Gauge: Measures the cu
Canal of shizukesa
Vincent Albert Feugier
SHIZUKESA Channel – Precision Volatility via Kijun Dynamics The SHIZUKESA Channel (Japanese for "Serenity") is a high-performance technical analysis tool built for traders who demand structural clarity. Unlike standard envelopes or Bollinger Bands that fluctuate with noise, this channel is mathematically rigid : it creates a 100% synchronized clone of the Kijun-Sen to identify objective price deviations. Core Features & Functionality Perfect Clone Structure : The bands do not rely on variable st
Trend series indicator
Vincent Albert Feugier
The Trend Series Indicator is a momentum-based tool designed to isolate and quantify the persistence of price cycles. While traditional oscillators like RSI or Stochastics often "flatten" during strong trends, the TSI measures the actual duration of the current market impulse. How It Works The indicator tracks the sequence of consecutive directional closes: Green Bars (Positive): Counts the streak of bullish candles. Each new higher close increments the bar (+1, +2, +3...). Red Bars (Negative):
STC Pro-Volume Dynamics: Advanced Momentum & Market Pressure Indicator STC Pro-Volume Dynamics is a high-performance trend cycle indicator developed for MetaTrader 5. Engineered for systematic and discretionary traders who demand precision, it merges the proven Schaff Trend Cycle (STC) algorithm with an integrated visual analysis of execution volumes. The objective of this tool is not to provide "magic" predictions, but to deliver a clear, stable, and statistically actionable reading of price dy
Trading isn't just about whether the price is going up or down; it's about how it is moving. The DPO is a structural indicator that neutralizes the underlying trend to isolate the market's pure cyclic component. What is the DPO, really? Mathematically, the DPO measures the distance between the current price and its moving average. It doesn't follow direction: It measures speed and acceleration. The "Detrending" concept: By subtracting the trend (the average), the indicator "flattens" the price.
Candle liquidity volume
Vincent Albert Feugier
Volume Color Candles v1.02   is an MT5 indicator that colors candlesticks based on their direction and relative volume. Bullish candles transition from light green to dark green, bearish candles from light red to dark red, featuring 8 gradient levels per direction (16 individually adjustable colors total). Parameters : 21 inputs including 16 customizable colors, volume average period (20), "high volume only" option, and threshold multiplier (1.2x). The algorithm compares current tick_volume to i
Why MarketSentiment Pro? Standard indicators only look at a single timeframe, leaving you blind to the bigger picture. Our proprietary algorithm analyzes 4 simultaneous time cycles across 4 different assets on a single screen. This gives you a unique "Eagle Eye" view of the market. Relative Strength Algorithm: Pure mathematical calculation based on the price position within its recent range ( $Position = \frac{Price - Low}{High - Low}$ ). 80% Reliability Target: By waiting for all 4 gauges to
Trail of SMOKE
Vincent Albert Feugier
Trail of SMOKE v1.0 The Kinetic Footprint of Price. Trail of SMOKE is an advanced momentum indicator that transforms raw volatility into a fluid visual structure. While traditional indicators merely follow price with a lag, Trail of SMOKE projects market energy to identify zones of real acceleration and institutional exhaustion. The Science Behind the "SMOKE" The name isn't just for aesthetics. The indicator functions like an aerodynamic slipstream: Force Projection: It calculates the gap betwee
Lyapunov exponent
Vincent Albert Feugier
Lyapunov Exponent Indicator for MT5 Measures the rate at which nearby market trajectories diverge over time — a concept from chaos theory applied to price series. What it measures The speed at which two initially close market states diverge. Fast divergence indicates a chaotic/trending regime. Convergence indicates a stable/consolidating regime. Reading the indicator Value near 1 → market in chaotic / trending regime Value near 0 → market in stable / ranging regime White line : Lyapunov exponent
Asymmetry lnp
Vincent Albert Feugier
ASYMMETRY OF LOSSES & PROFITS — MT5 Indicator The concept Most traders know their loss in %. Few know how much they need to gain to get back to breakeven. This is the mathematical asymmetry of markets: losing 50% doesn't require +50% to recover — it requires +100% . The bigger the loss, the more disproportionate the recovery effort. Loss Required gain to recover -10% +11.1% -25% +33.3% -50% +100% -75% +300% -90% +900% This indicator makes that number visible, continuously, directly on your MT5 c
NOTIFY PANEL            Your trading dashboard delivered straight                   to your pocket — in real time OVERVIEW NotifyPanel is a lightweight Expert Advisor featuring 3 buttons that instantly sends your trading data as push notifications to your smartphone via the MetaTrader 5
Filter:
No reviews
Reply to review