ETE Detector Head Shoulders Indicator

ETE Detector – Head & Shoulders Indicator

Turn your charts into clear and actionable trading opportunities!

🚀 About the Indicator

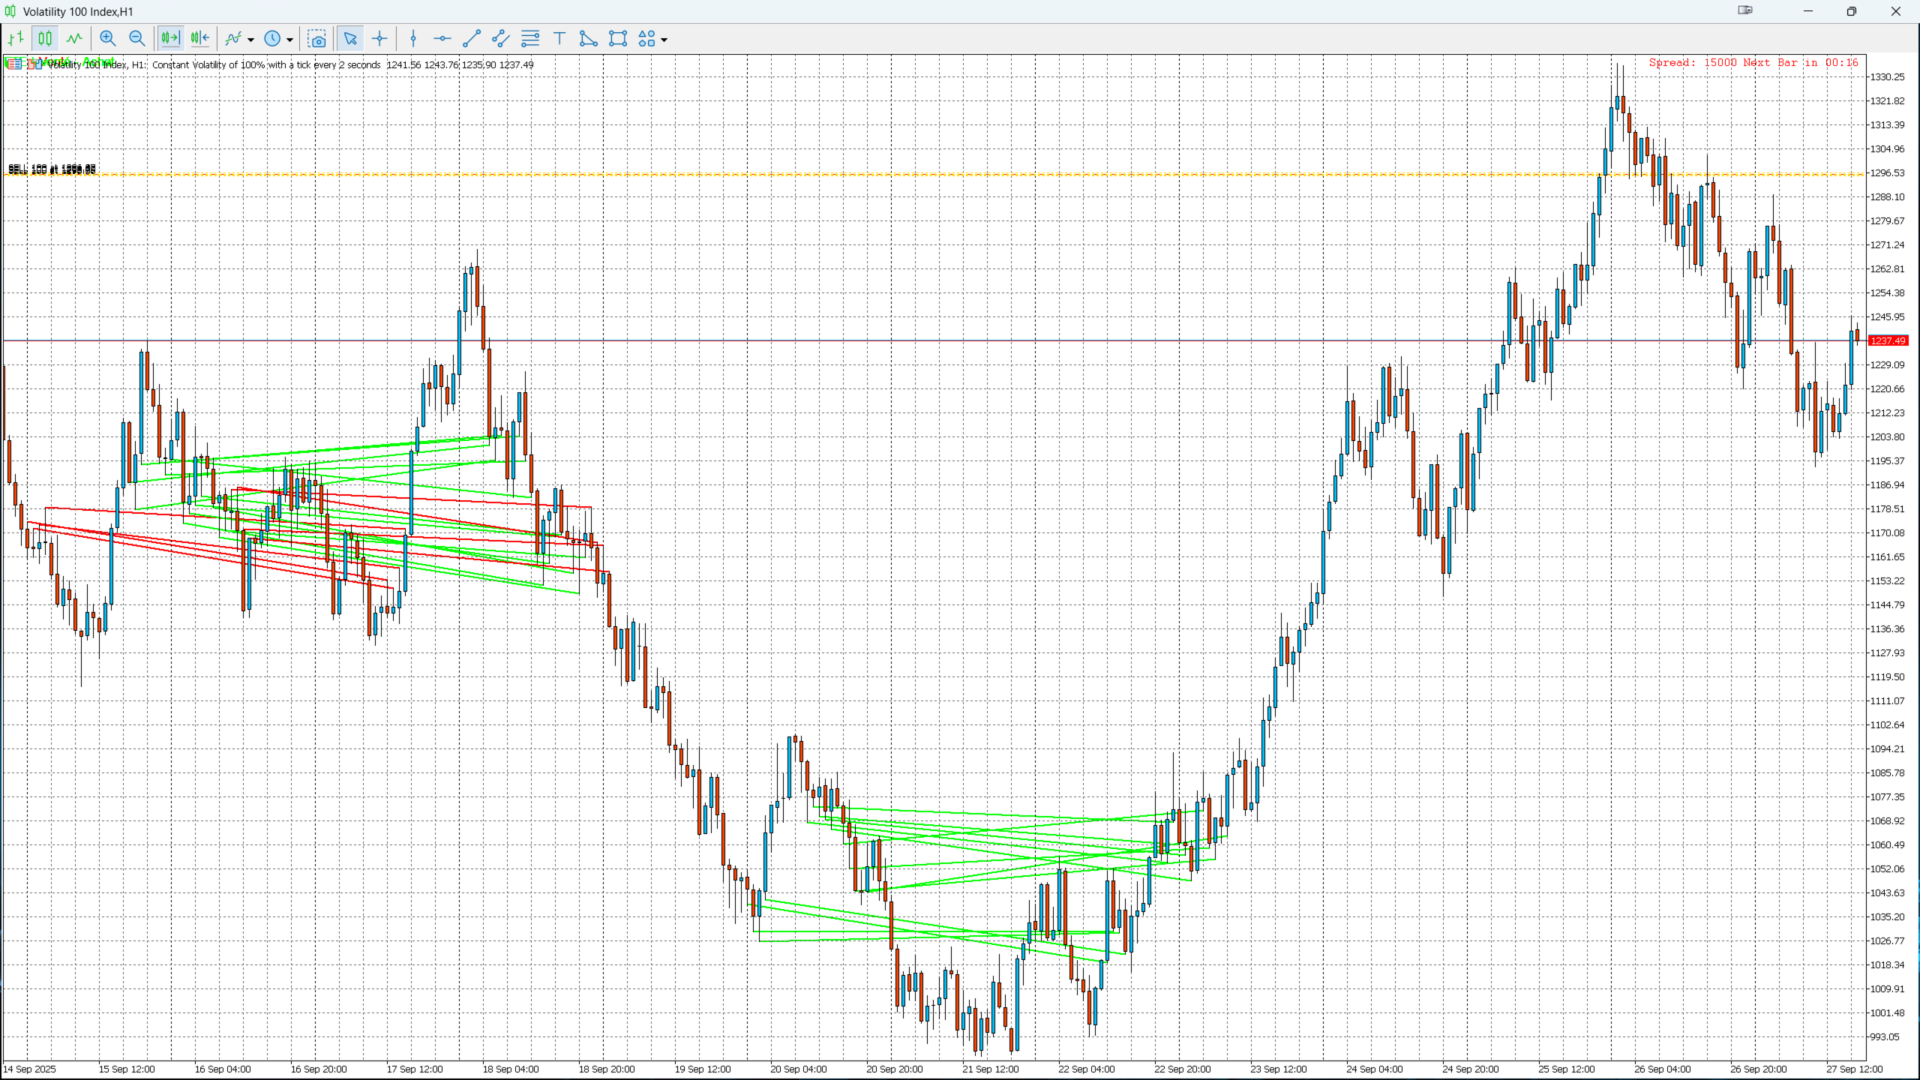
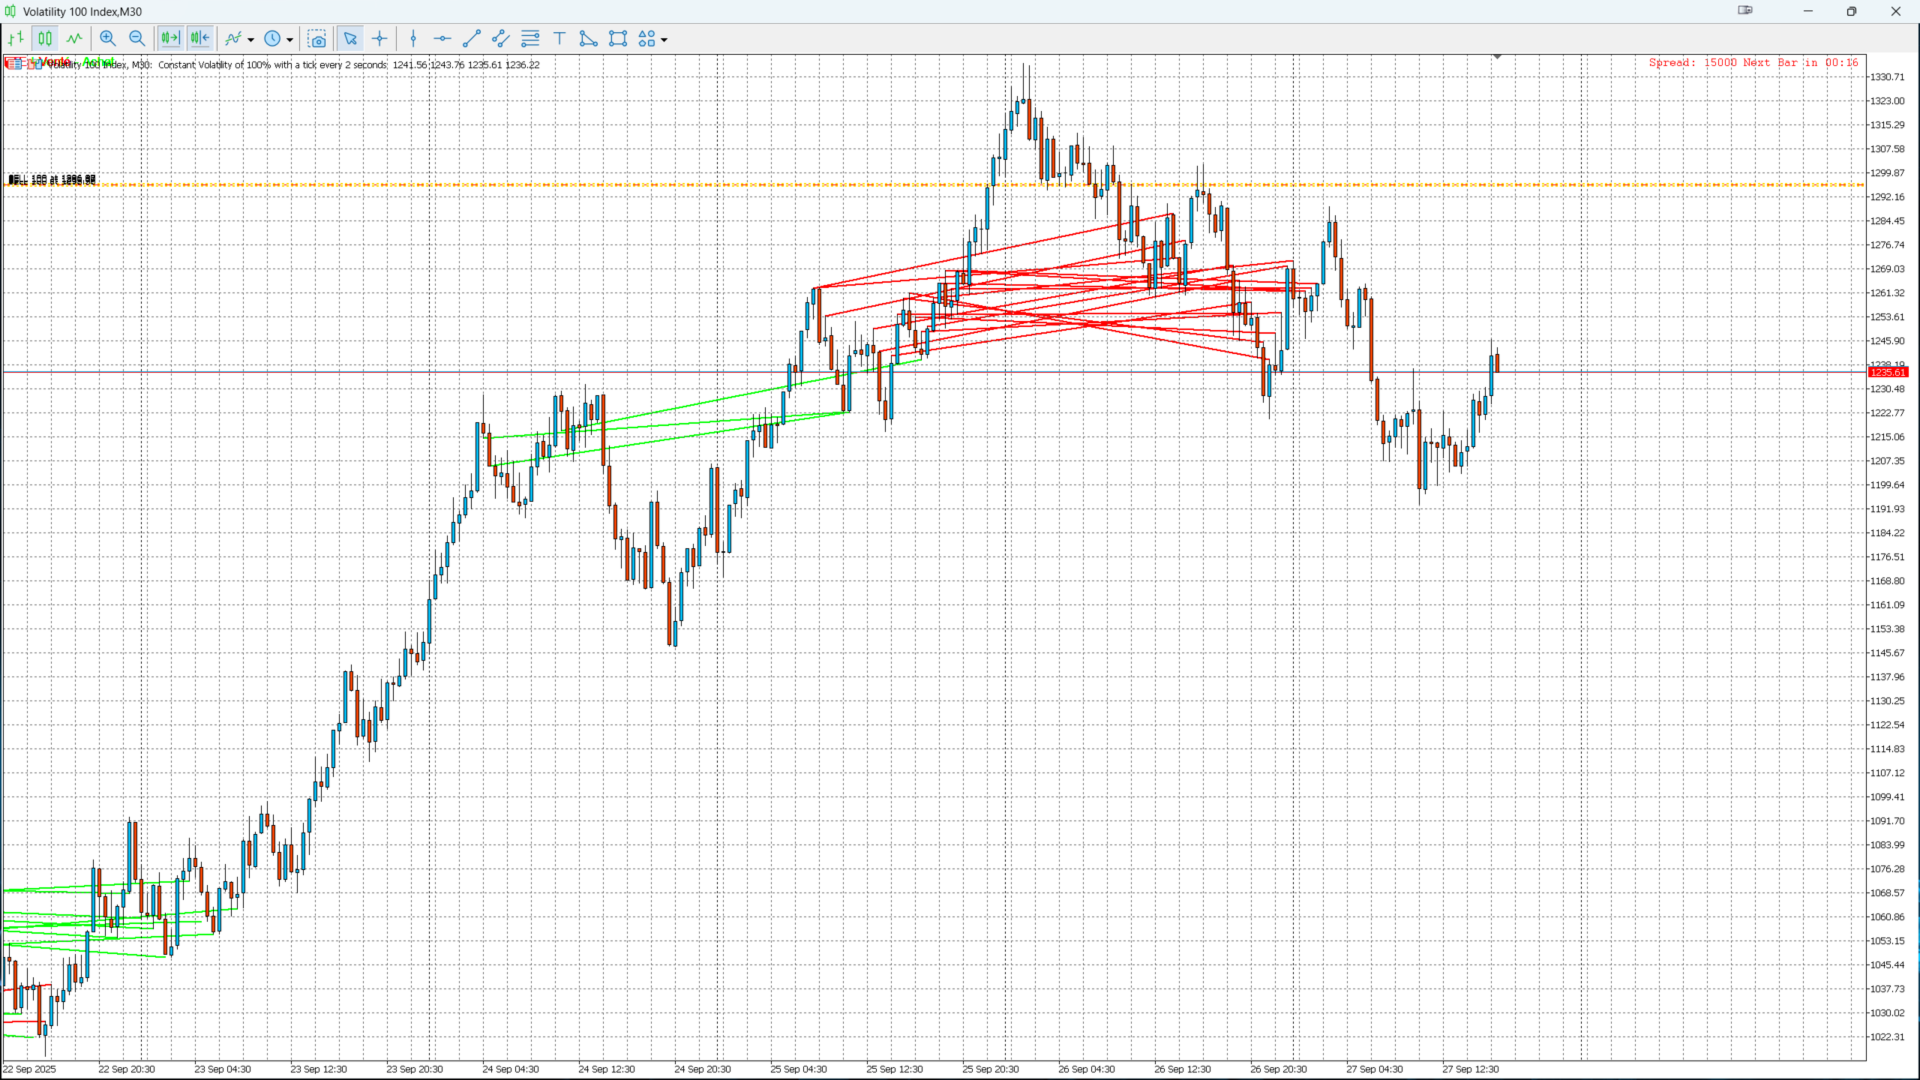
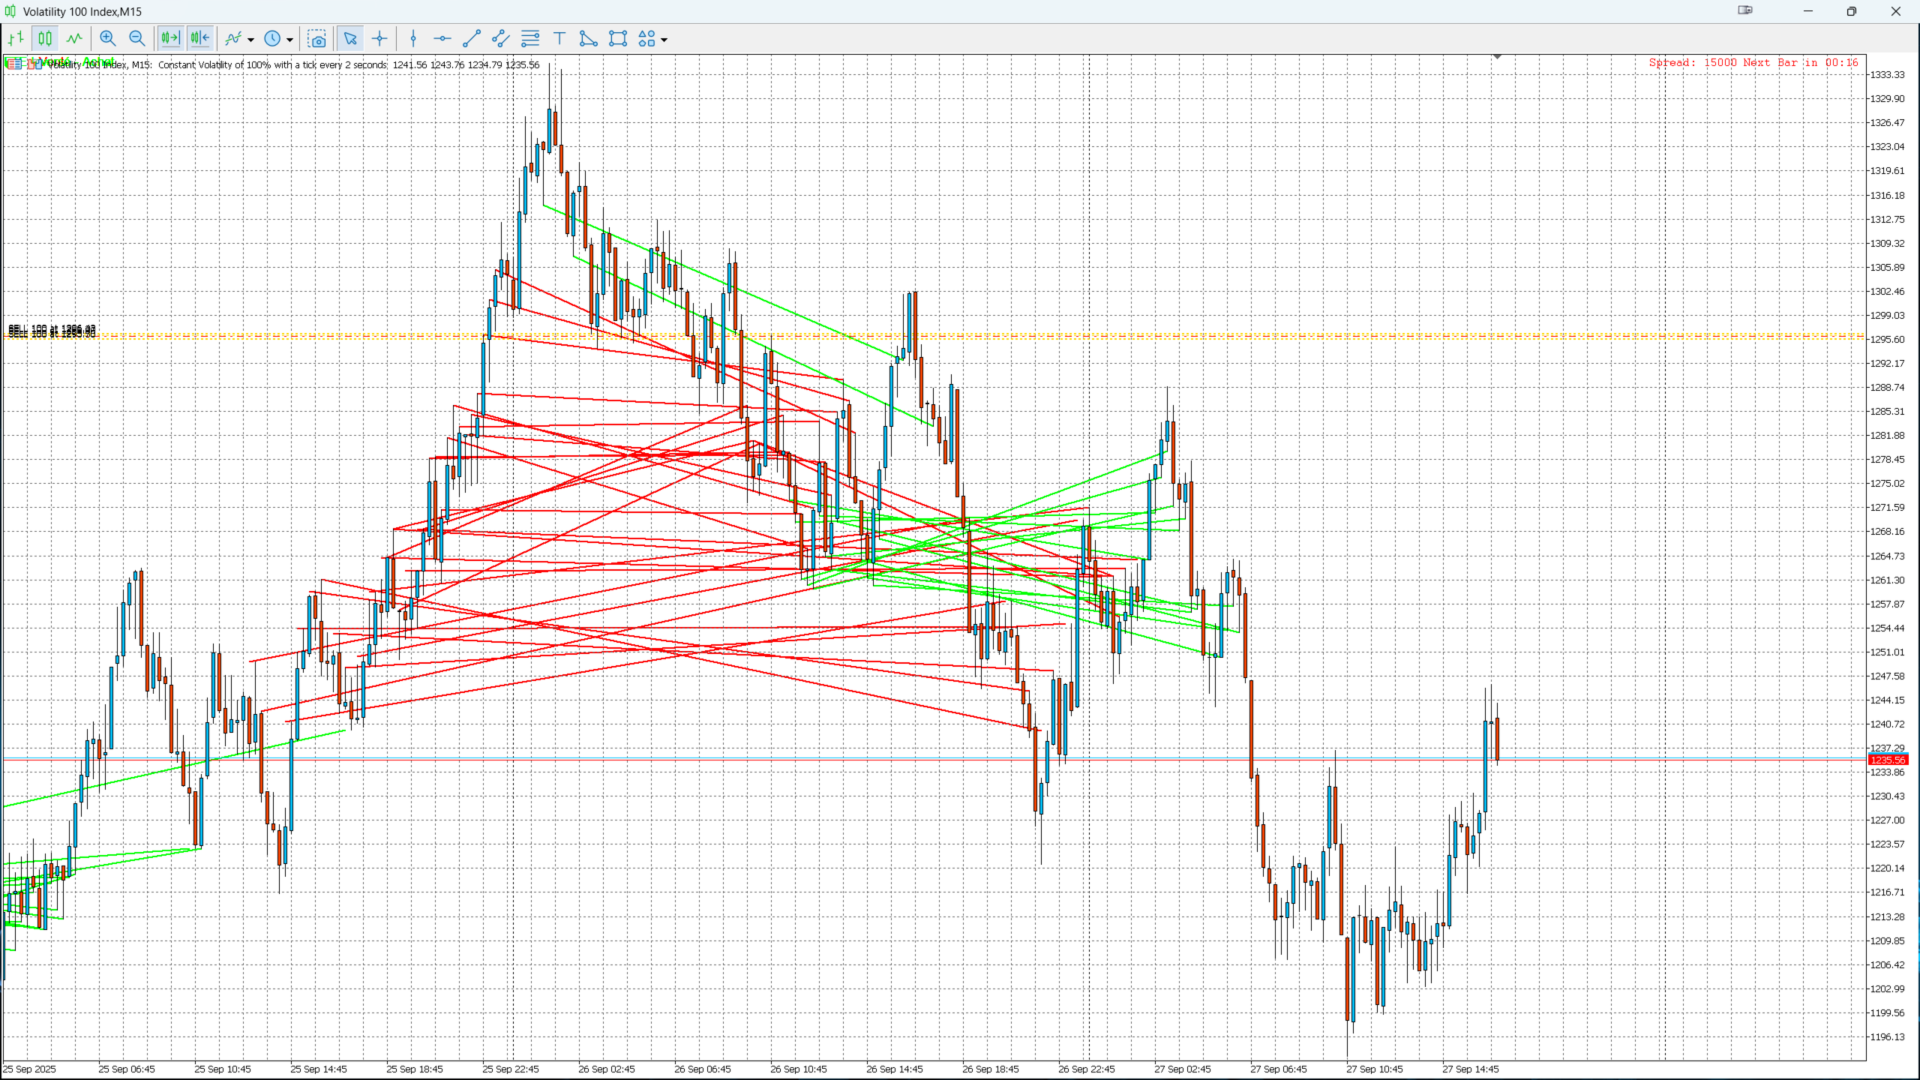
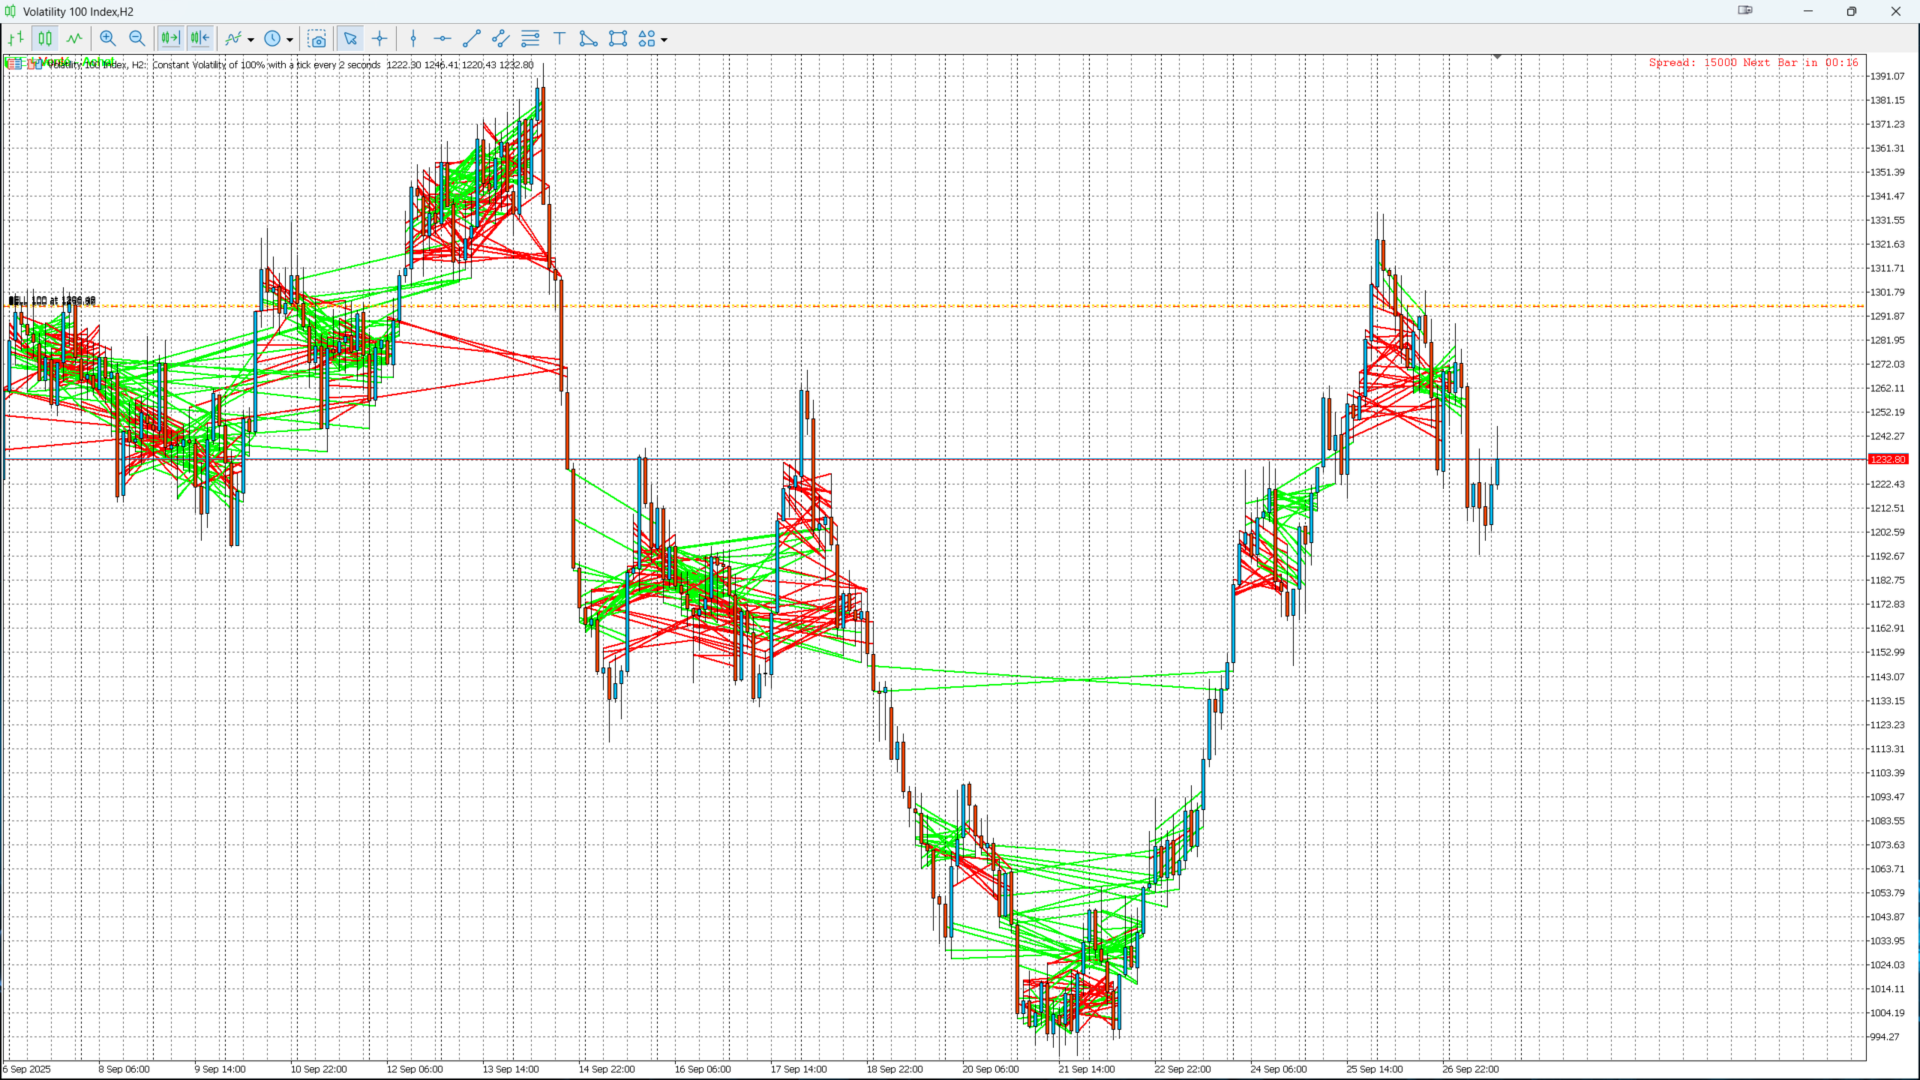
The ETE Detector automatically identifies Head & Shoulders (H&S) and Inverse Head & Shoulders (IH&S) patterns — classic trend reversal formations.
No more spending hours searching manually: your analysis becomes fast, accurate, and visual.

💡 What You Get

  • Automatic detection of trend reversal patterns

  • Colored arrows: green 🔺 for buys (Inverse H&S), red 🔻 for sells (H&S)

  • Neckline automatically drawn to highlight breakout zones

  • “●” labels for shoulders and head, clearly visualizing the formation

  • Explanatory text directly on the chart: "H&S – Sell" or "Inverse H&S – Buy"

🎯 Benefits for Traders

  • Save time: no more manual pattern hunting

  • Make better decisions: spot reversals before others

  • Clear visualization: instantly recognize complete patterns

  • Works on any market and timeframe

  • Easily customizable settings for your trading style

⚙️ Customizable Inputs

Parameter Description Default Value
LookBack Number of candles to analyze 300
MinDistance Minimum distance between shoulder and head 5
Tolerance Symmetry tolerance between shoulders (%) 2%
BuyColor Color for Inverse H&S (Buy) Green
SellColor Color for H&S (Sell) Red

📈 How to Use

  1. Add the indicator to your MT5 chart

  2. Observe the arrows, labels, and necklines

  3. Analyze breakout zones to identify buy or sell opportunities

  4. Optionally combine with a trend indicator to filter false signals

✨ Why Choose ETE Detector

  • Ultra-fast and reliable detection

  • Intuitive and professional visualization

  • Perfect for all traders: beginners or experienced

  • Optimize your performance by spotting reversals ahead of others

📞 Support & Contact

  • Author: KOUAME N’DA LEMISSA

  • Email: [your email here]

  • Compatible with MT5 only


Recommended products
WAPV Weis Wave Chart MT5
Eduardo Da Costa Custodio Santos
The Weis Wave Chart for MT5 is a Price and Volume indicator. The Price and Volume reading was widely disseminated through Richard Demille Wyckoff based on the three laws created by him: Supply and Demand, Cause and Effect and Effort vs. Result. In 1900 R.Wyckoff already used the wave chart in his analyses. Many years later, around 1990, David Weis Automated R. Wyckoff's wave chart and today we bring you the evolution of David Weis' wave chart. It shows the amount of Volume and the amount of pips
Advanced Stochastic Scalper MT5 is a professional indicator based on the popular Stochastic Oscillator. Advanced Stochastic Scalper is an oscillator with dynamic overbought and oversold levels, while in the standard Stochastic Oscillator, these levels are static and do not change. This allows Advanced Stochastic Scalper to adapt to the ever-changing market. When a buy or a sell signal appears, an arrow is drawn on the chart and an alert is triggered allowing you to open a position in a timely ma
Automated Trendlines MT5
Georgios Kalomoiropoulos
Trendlines  are the most essential tool of technical analysis in forex trading.  Unfortunately, most  traders don’t draw them correctly. Automated Trendlines indicator is a professional tool for serious traders that help you visualize the trending movement of the markets . AMAZING OFFER --> Activations from 5 to 20 for "MTF Supply Demand Zones" and "Automated Trendlines" There are two types of Trendlines Bullish Trendlines and Bearish Trendlines. In the uptrend, Forex trend line is drawn throu
Turn your chart into a professional trading dashboard that shows where price is flowing and when the next shock is coming —without loading a single extra window. This indicator combines a price-following MA ribbon with a live news radar directly on the chart, giving you both trend and event risk in one glance. Trend Ribbon – Read the market bias instantly A smooth, step-style moving average ribbon follows price action bar by bar. Color change shows the active trend: aqua for bullish flow , gold
NosTraderMus LinearRegressionBands MT5 — Linear Regression Bands with RSI & Signal Arrows NosTraderMus LinearRegressionBands MT5 is a professional MetaTrader 5 indicator that plots a regression line over a rolling price window and builds dynamic bands from the standard deviation of the fit residuals . On top of this statistical channel it integrates an RSI filter (with selectable timeframe) and buy/sell arrows when objective extreme + confirmation conditions are met. It aims for clear, disciplin
RSI Arrows Profesional
Magdalena Estefania Colonna
RSI Arrows Professional v1.00 Advanced Technical Indicator for MetaTrader 5 Overview RSI Arrows Professional is a sophisticated technical indicator that combines the power of the traditional RSI (Relative Strength Index) with an intelligent directional signal system. Designed specifically for traders looking to identify optimal entry and exit points in the market, this indicator implements conservative trading strategies based on momentum analysis. Key Features Conservative Signal Strategy
Fibaction
Abdelkhalek Orabi
Indicator Name: Fibaction – price action candle Detector Description: Fibo Signal Boxes is a powerful Smart Money Concept (SMC)-inspired indicator that auto-detects price action candles. bullish hammers and shooting stars, then draws precise Fibonacci entry zones and multiple take-profit levels directly on the chart. as for the SL personally i use 40 pips rules  Key Features: Detects bullish hammer and shooting star reversal candles. Automatically draws Fibonacci entry and TP boxes. as
Introduction to the Manual Backtesting Indicator on MQL5 The MetaTrader platform provides an excellent backtesting tool for evaluating Expert Advisors (EAs). However, when it comes to manually backtesting a strategy to assess its effectiveness, this tool has some limitations: You cannot manually draw zones or trend lines while in backtesting mode. You cannot switch timeframes to check time alignment. For example, if my strategy requires additional confirmation from a higher timeframe (HTF), this
Weis Wave Scouter
Jean Carlos Martins Roso
Discover the power of advanced volume analysis with Weis Wave Scouter, a revolutionary indicator for MetaTrader 5 that combines the proven principles of the Wyckoff method and Volume Spread Analysis (VSA). Designed for traders seeking precision and depth in their operations, this indicator offers a tactical reading of the market through cumulative volume wave analysis, helping to identify key points of trend reversals and continuations. Weis Wave Scouter features a clear visual interface with co
STRICTLY FOR BOOM INDEX ONLY!!!!! Here I bring the Maximum Trend Arrows OT1.0 MT5 indicator. This indicator is made up of a combination of different trend indicators for entries and exits, for entries an orange arrow will paint on the chart below the current market and a red flag for closing of trades and it produces buy arrows only. When the orange arrow appears, it will appear along with it's sound to notify you. The 1H timeframe is recommended, don't use it anywhere else than on the 1H timefr
The indicator determines the state of the market: trend or flat. The state of the market is determined by taking into account volatility. The flat (trading corridor)is displayed in yellow. The green color shows the upward trend. The red color shows the downward trend. The height of the label corresponds to the volatility in the market. The indicator does not redraw . Settings History_Size   - the amount of history for calculation. Period_Candles  - the number of candles to calculate the indicat
Limitless MT5
Dmitriy Kashevich
Limitless MT5 is a universal indicator suitable for every beginner and experienced trader. works on all currency pairs, cryptocurrencies, raw stocks Limitless MT5 - already configured and does not require additional configuration And now the main thing Why Limitless MT5? 1 complete lack of redrawing 2 two years of testing by the best specialists in trading 3 the accuracy of correct signals exceeds 80% 4 performed well in trading during news releases Trading rules 1 buy signal - the ap
Oscillator trading signals - это динамический индикатор, определяющий состояние к продолжению тенденции роста или падению цены торгового инструмента и отсечению зон с нежелательной торговлей. Индикатор состоит из 2 линий осцилляторов. Медленная и быстрая сигнальная линия.  Шкала отображения перевернутая. Зоны вблизи 0 свидетельствуют о тенденции роста цены валютной пары. Зоны -100 свидетельствуют о падении цены валютной пары. На основном графике в виде стрелок отображается потенциально выгодные
A Média Móvel é um indicador que faz parte da Análise Técnica. Com ela, é possível identificar o equilíbrio dos preços no mercado, observando tendências de alta, neutra ou baixa. Este indicador customizado traz opções extras pera definir o método de cálculo podendo-se esclolher entre SMA,EMA,SSMA,LWMA,JJMA,JurX,ParMA,T3,Vidya,AMA,HULL MA. Também conta com varias opções para escolher o método de cálculo para o preço base a ser usado no cáculo da média.
DYJ TradingView
Daying Cao
5 (1)
DYJ TRADINGVIEW is a multi indicator rating system, using the rating signals counts and analysis tools to find entry opportunities in global markets DYJ TRADINGVIEW has 10 built-in indicators for market analysis. Indicator-based analysis is used by many traders to help them make decisions on what trades to take and where to enter and exit them.  We use several different types that can complement each other well. Use us to follow your market, You can find more accurate transactions. The trend ind
ATrend
Zaha Feiz
4.82 (17)
ATREND: How It Works and How to Use It How It Works The " ATREND " indicator for the MT5 platform is designed to provide traders with robust buy and sell signals by utilizing a combination of technical analysis methodologies. This indicator primarily leverages the Average True Range (ATR) for volatility measurement, alongside trend detection algorithms to identify potential market movements. Leave a massage after purchase and receive a special bonus gift. Key Features: ⦁ Dynamic Trend Detect
Owl Smart Levels MT5
Sergey Ermolov
4.03 (32)
MT4 version  |   FAQ The Owl Smart Levels Indicator is a complete trading system within the one indicator that includes such popular market analysis tools as Bill Williams' advanced fractals , Valable ZigZag which builds the correct wave structure of the market, and Fibonacci levels which mark the exact levels of entry into the market and places to take profits. Detailed description of the strategy Instructions for working with the indicator Advisor-assistant in trading Owl Helper Private User
Hunter trend
Yaroslav Varankin
Hunter Trend: Arrow Indicator for Binary Options Trading Hunter Trend is an arrow indicator designed for trading binary options (turbo options) on the M1 timeframe, allowing for short-term trading opportunities. How to Trade with this Tool: Signals may appear when a candlestick forms. Once such a signal appears, wait for the closure of that candlestick. Upon the opening of a new candlestick, open a trade for 1-2 candlesticks in the indicated direction. In this case, for 1-2 minutes. A blue dot
HAshi-E is an enhanced way to analyze Heiken-Ashi signals. Briefing: Heiken-Ashi is particularly valued for its ability to filter out short-term volatility, making it a preferred tool for identifying and following trends, helps in decision-making regarding entry and exit points, and assists in distinguishing between false signals and genuine trend reversals. Unlike traditional candlestick charts, Heiken-Ashi candles are calculated using average values of previous bars, creating a smoother, mo
PipFinite Trend PRO MT5
Karlo Wilson Vendiola
4.84 (556)
Breakthrough Solution For Trend Trading And Filtering With All Important Features Built Inside One Tool! Trend PRO's smart algorithm detects the trend, filters out market noise and gives entry signals with exit levels. The new features with enhanced rules for statistical calculation improved the overall performance of this indicator. Important Information Revealed Maximize the potential of Trend Pro, please visit www.mql5.com/en/blogs/post/713938 The Powerful Expert Advisor Version Automatin
Cvd Divergence
Thalles Nascimento De Carvalho
CVD Divergence – Professional Flow and Divergence Analysis CVD Divergence is a technical indicator designed to detect reliable divergences between price and Cumulative Delta Volume (CVD). It accurately identifies moments when the real order flow does not confirm the price movement, revealing potential reversals, exhaustion points, and institutional manipulation. The indicator combines aggressive volume analysis with structural price reading, delivering clear, objective, and early signals. What t
RSI Divergence Signal
Luiz Felipe De Oliveira Caldas
RSI Divergence Signal The  RSI Divergence Signal  is a technical analysis tool used in financial markets to identify potential trend reversals. It compares the Relative Strength Index (RSI) with price action to detect divergences. When the RSI moves in the opposite direction of the price, it signals a potential change in momentum, suggesting that the current trend may be weakening. This divergence can indicate a buying opportunity in a downtrend or a selling opportunity in an uptrend. Traders u
Looking for reliable levels on a price chart? Already tired of searching for similar indicators? Are the levels not working out as they should? Then this is the indicator for you. Volume Prices Universal is a reliable indicator of horizontal volumes. What does it show? First of all, the main idea of ​​the indicator is to display at which price mark the price has been for the longest time. Thus, the display of price volumes on the price chart is formed. With the help of which you can very simpl
KasTon Trend System: The Complete 2-in-1 Trading Strategy Identify the Trend, Confirm the Signal, and Trade with Confidence! Do you suffer from confusion while trading? Do you find it difficult to determine the market's direction? Are you tired of losing money on false signals? The KasTon Trend System is here as an integrated solution to all these problems. This is not just an indicator; it is a complete trading strategy built on the synergy of two powerful, custom-built indicators. Our main g
This indicator builds upon the previously posted Nadaraya-Watson smoothers. Here we have created an envelope indicator based on Kernel Smoothing with integrated alerts from crosses between the price and envelope extremities. Unlike the Nadaraya-Watson estimator, this indicator follows a contrarian methodology. Please note that by default this indicator can be subject to repainting. Users can use a non-repainting smoothing method available from the settings. The triangle labels are designed so
WanaScalper
Isaac Wanasolo
1 (1)
A scalping indicator based on mathematical patterns, which on average gives signals with relatively small SL, and also occasionally helps to catch big moves in the markets (more information in the video) This indicator has three main types of notifications: The first type warns of a possible/upcoming signal on the next bar The second type indicates the presence of a ready signal to enter the market/open a position The third type is for SL and TP levels - you will be notified every time price re
Unlock the Market's Hidden Blueprint with Advanced Pattern Recognizer Tired of staring at charts, struggling to spot high-probability trading opportunities? What if you had a professional analyst scanning the markets 24/7, drawing perfect trendlines, and calculating precise profit targets for you? Introducing Advanced Pattern Recognizer for MetaTrader 5 – Your Automated Technical Analysis Powerhouse. This isn't just another indicator. It's a sophisticated algorithmic engine designed to do the he
Your Trend Friend
Luigi Nunes Labigalini
5 (1)
The trend is your friend! Look at the color of the indicator and trade on that direction. It does not  repaint. After each candle is closed, that's the color of the trend. You can focus on shorter faster trends or major trends, just test what's most suitable for the symbol and timeframe you trade. Simply change the "Length" parameter and the indicator will automatically adapt. You can also change the color, thickness and style of the lines. Download and give it a try! There are big movements w
HAshi-E is an enhanced way to analyze Heiken-Ashi signals. Briefing: Heiken-Ashi is particularly valued for its ability to filter out short-term volatility, making it a preferred tool for identifying and following trends, helps in decision-making regarding entry and exit points, and assists in distinguishing between false signals and genuine trend reversals. Unlike traditional candlestick charts, Heiken-Ashi candles are calculated using average values of previous bars, creating a smoother, mo
Strong Candle Indicates the size of each candlestick with the text value above it and indicates which candlestick has a body larger than the one specified in the parameters in percentage, that is, a strong candlestick (between Size_Min and Size_Max) with at least x% of body. The candlestick size is placed in the buffer and that is the buy or sell indication, where: value > 0 = bullish candle or value < 0 bearish candle, value = 0 means no indication (the candle did not match the desired pattern
Buyers of this product also purchase
Divergence Bomber
Ihor Otkydach
4.99 (77)
Each buyer of this indicator also receives the following for free: The custom utility "Bomber Utility", which automatically manages every trade, sets Stop Loss and Take Profit levels, and closes trades according to the rules of this strategy Set files for configuring the indicator for various assets Set files for configuring Bomber Utility in the following modes: "Minimum Risk", "Balanced Risk", and "Wait-and-See Strategy" A step-by-step video manual to help you quickly install, configure, and s
Quantum TrendPulse
Bogdan Ion Puscasu
5 (19)
Introducing Quantum TrendPulse , the ultimate trading tool that combines the power of SuperTrend , RSI , and Stochastic into one comprehensive indicator to maximize your trading potential. Designed for traders who seek precision and efficiency, this indicator helps you identify market trends, momentum shifts, and optimal entry and exit points with confidence. Key Features: SuperTrend Integration: Easily follow the prevailing market trend and ride the wave of profitability. RSI Precision: Detect
Grabber System MT5
Ihor Otkydach
4.79 (19)
Let me introduce you to an excellent technical indicator – Grabber, which works as a ready-to-use "All-Inclusive" trading strategy. Within a single code, it integrates powerful tools for technical market analysis, trading signals (arrows), alert functions, and push notifications. Every buyer of this indicator also receives the following for free: Grabber Utility for automatic management of open orders Step-by-step video guide: how to install, configure, and trade with the indicator Custom set fi
First of all Its worth emphasizing here that this Trading Tool is Non Repainting , Non Redrawing and Non Lagging Indicator , Which makes it ideal for professional trading . Online course, user manual and demo. The Smart Price Action Concepts Indicator is a very powerful tool for both new and experienced traders . It packs more than 20 useful indicators into one , combining advanced trading ideas like Inner Circle Trader Analysis and Smart Money Concepts Trading Strategies . This indicator focus
Top indicator for MT5   providing accurate signals to enter a trade without repainting! It can be applied to any financial assets:   forex, cryptocurrencies, metals, stocks, indices .  Watch  the video  (6:22) with an example of processing only one signal that paid off the indicator! MT4 version is here It will provide pretty accurate trading signals and tell you when it's best to open a trade and close it. Most traders improve their trading results during the first trading week with the help of
SynaptixQuant Dominance Matrix
Devie Arevalo Montemayor
5 (1)
SynaptixQuant Dominance Matrix: Institutional-Grade Market State Extraction Engineered for traders who require a data-driven view of market behaviour beyond surface-level indicators. The Synaptix Quant (SQ) Dominance Matrix is not a conventional currency strength display. Behind its intentionally streamlined interface runs a sophisticated analytical architecture designed to quantify market conditions with precision. Every output is generated through layered signal processing built to identify d
TPSproTREND PrO MT5
Roman Podpora
4.72 (18)
Buy TREND PRO now and get another advanced trend indicator for free To receive, write in private messages. ИНСТРУКЦИЯ RUS    -  INSTRUCTIONS  ENG    -  VERSION MT4   Main functions: Accurate entry signals WITHOUT REPAINTING! Once a signal appears, it remains valid! This is a significant distinction from repainting indicators that might provide a signal and then alter it, potentially leading to deposit losses. Now, you can enter the market with higher probability and precision. There's also a f
How many times have you bought a trading indicator with great back-tests, live account performance proof with fantastic numbers and stats all over the place but after using it, you end up blowing your account? You shouldn't trust a signal by itself, you need to know why it appeared in the first place, and that's what RelicusRoad Pro does best! User Manual + Strategies + Training Videos + Private Group with VIP Access + Mobile Version Available A New Way To Look At The Market RelicusRoad is the
Quantum Trend Sniper
Bogdan Ion Puscasu
4.74 (53)
Introducing   Quantum Trend Sniper Indicator , the groundbreaking MQL5 Indicator that's transforming the way you identify and trade trend reversals! Developed by a team of experienced traders with trading experience of over 13 years,   Quantum Trend Sniper Indicator   is designed to propel your trading journey to new heights with its innovative way of identifying trend reversals with extremely high accuracy. ***Buy Quantum Trend Sniper Indicator and you could get Quantum Breakout Indicator for
Trend Forecaster
Alexey Minkov
5 (7)
The Trend Forecaster indicator utilizes a unique proprietary algorithm to determine entry points for a breakout trading strategy. The indicator identifies price clusters, analyzes price movement near levels, and provides a signal when the price breaks through a level. The Trend Forecaster indicator is suitable for all financial assets, including currencies (Forex), metals, stocks, indices, and cryptocurrencies. You can also adjust the indicator to work on any time frames, although it is recommen
Shock Pullback
Suleiman Alhawamdah
5 (1)
Shock Pullback v 3.5 + AI/ML forecasts: - Add Integrated Artificial and deep learning have been integrated within the MQL5 environment. - A qualitative addition for integrated future forecasts using deep learning and artificial intelligence (AI/ML) within MQL5, based on the methodology and operation of the core indicator built on the Shock Pullback and its inherent integrated functions. - Suitable for scalping trading  How to Use the Indicator  Shock Pullback: There are 3 images in the com
Best Solution for any Newbie or Expert Trader! This Indicator is a unique, high quality and affordable trading tool because we have incorporated a number of proprietary features and a new formula. With only ONE chart you can read Currency Strength for 28 Forex pairs! Imagine how your trading will improve because you are able to pinpoint the exact trigger point of a new trend or scalping opportunity? User manual:   click here That's the first one, the original! Don't buy a worthless wannabe clone
AriX
Temirlan Kdyrkhan
1 (4)
AriX Indicator for MT5 A powerful trend-following and signal-evaluation tool AriX is a custom MT5 indicator that combines Moving Averages and ATR-based risk/reward logic to generate clear buy/sell signals. It visualizes dynamic SL/TP levels, evaluates past trade outcomes, and displays win/loss statistics in a clean on-chart panel. Key features include: Buy/Sell signals based on MA crossovers ATR-based SL/TP1/TP2/TP3 levels with visual lines and labels Signal outcome tracking with real-time stat
TPSpro RFI Levels MT5
Roman Podpora
4.53 (19)
INSTRUCTIONS RUS   /   INSTRUCTIONS   ENG    -     Version MT4 Main functions: Displays active zones of sellers and buyers! The indicator displays all the correct first impulse levels/zones for purchases and sales. When these levels/zones are activated, where the search for entry points begins, the levels change color and are filled with certain colors. Arrows also appear for a more intuitive perception of the situation. LOGIC AI - Display of zones (circles) for searching entry points when acti
Step into the world of Forex trading with confidence, clarity, and precision using Gold Indicator a next-generation tool engineered to take your trading performance to the next level. Whether you’re a seasoned professional or just beginning your journey in the currency markets, Gold Indicator equips you with powerful insights and help you trade smarter, not harder. Built on the proven synergy of three advanced indicators, Gold Indicator focuses exclusively on medium and long-term trends elimina
ARICoins
Temirlan Kdyrkhan
ARICoin is a powerful trading companion designed to generate high-probability entry signals with dynamic TP/SL/DP levels based on volatility. Built-in performance tracking shows win/loss stats, PP1/PP2 hits, and success rates all updated live. Key Features: Buy/Sell signals with adaptive volatility bands Real-time TP/SL/DP levels based on ATR Built-in MA Filter with optional ATR/StdDev volatility Performance stats panel (Success, Profit/Loss, PP1/PP2) Alerts via popup, sound, push, or email Cust
Introducing   Quantum Breakout PRO , the groundbreaking MQL5 Indicator that's transforming the way you trade Breakout Zones! Developed by a team of experienced traders with trading experience of over 13 years,   Quantum Breakout PRO   is designed to propel your trading journey to new heights with its innovative and dynamic breakout zone strategy. Quantum Breakout Indicator will give you signal arrows on breakout zones with 5 profit target zones and stop loss suggestion based on the breakout b
Advanced Supply Demand MT5
Bernhard Schweigert
4.5 (14)
Best Solution for any Newbie or Expert Trader! This indicator is a unique, high quality and affordable trading tool because we have incorporated a number of proprietary features and a new formula. With this update, you will be able to show double timeframe zones. You will not only be able to show a higher TF but to show both, the chart TF, PLUS the higher TF: SHOWING NESTED ZONES. All Supply Demand traders will love it. :) Important Information Revealed Maximize the potential of Advanced Supply
MTF Supply Demand Zones MT5
Georgios Kalomoiropoulos
5 (1)
Next Generation Of Automated Supply And Demand Zones. New and Innovative Algorithm that Works At Any Chart. All Zones Are Being Created Dynamically According To Price Action Of The Market. AMAZING OFFER --> Activations from 5 to 20 for "MTF Supply Demand Zones" and "Automated Trendlines" TWO TYPES OF ALERTS -->  1) WHEN PRICE HITS A ZONE    2)WHEN A NEW ZONE IS FORMED  If you get the MTF Supply Demand Zones you can join the " Trade Like Me " Video Series. It contains 14 Live Sessions where 
Berma Bands
Muhammad Elbermawi
5 (7)
The Berma Bands (BBs) indicator is a valuable tool for traders seeking to identify and capitalize on market trends. By analyzing the relationship between the price and the BBs, traders can discern whether a market is in a trending or ranging phase. Visit the [ Berma Home Blog ] to know more. Berma Bands are composed of three distinct lines: the Upper Berma Band, the Middle Berma Band, and the Lower Berma Band. These lines are plotted around the price, creating a visual representation of the pric
This indicator uses support and resistance, volume and some special formula to calculate the volume to filter the candles. If the volume reaches a specific value, And at the same time, Candle breaks the support/resistance line, There would be a signal and we can enter the market. Signals appear when the current candle closes. then you can enter the trade when a new candle appears. Please don't forget to follow your money management plan. MT4 Version Support/Resistance Breakout MT4 :   https:/
DESCRIPTION ICSM (Impulse-Correction SCOB Mapper) is the indicator that analyzes the price movement and identifies valid impulses, corrections and SCOBs (Single Canndle Ordere Block). It is a powerful tool that can be used with any type of technical analysis because it's flexible, informative, easy to use and it does substantially improve trader's awareness of the most liquid zones of interest. SETTINGS General | Visuals Colour theme — defines the colour theme of the ICSM. SCOB | Visuals Show
PZ Trend Trading MT5
PZ TRADING SLU
3.8 (5)
Capture every opportunity: your go-to indicator for profitable trend trading Trend Trading is an indicator designed to profit as much as possible from trends taking place in the market, by timing pullbacks and breakouts. It finds trading opportunities by analyzing what the price is doing during established trends. [ Installation Guide | Update Guide | Troubleshooting | FAQ | All Products ] Trade financial markets with confidence and efficiency Profit from established trends without getting whip
Spike detector Rider
Francisco Mandomo Simbine
Spike Detector Rider – Intelligent Trading in Volatile Markets Introduction The Spike Detector Rider  is an advanced system for MetaTrader 5 designed to detect explosive price movements in high-volatility assets such as synthetic indices and commodities. It combines volatility filters, trend analysis, and automated risk management to provide intelligent trade confirmations. After purchase, please send me a private message via MQL5 to receive the installation manual and setup instructions. Asset
The Volume Spread Analysis indicator is based on the original Volume Spread Analysis method. It was designed for quick and easy recognition of VSA patterns. Even though this indicator looks very simple, it is the most sophisticated tool we've ever made. It is a really powerful analytical tool that generates very reliable trading signals. Because it is very user-friendly and understandable, it is suitable for every type of trader, regardless of his experience. What is VSA? VSA - Volume Spread A
Best Solution for any Newbie or Expert Trader! This indicator is a unique, high quality and affordable trading tool because we have incorporated a number of proprietary features and a secret formula. With only ONE chart it gives Alerts for all 28 currency pairs. Imagine how your trading will improve because you are able to pinpoint the exact trigger point of a new trend or scalping opportunity! Built on new underlying algorithms it makes it even easier to identify and confirm potential trades.
MetaForecast M5
Vahidreza Heidar Gholami
5 (3)
MetaForecast predicts and visualizes the future of any market using different powerful methods. While financial markets are not always predictable, if there are patterns in the past data, MetaForecast can learn and predict the future as accurately as possible. It features a complete implementation of neural networks embedded directly into the indicator, enabling traders to create and train AI models using data from multiple symbols to learn complex patterns. MetaForecast leverages your computer'
Stargogs Spike Catcher
Lorenzo Edward Beukes
4.5 (8)
Stargogs Spike Catcher V4.0 This Indicator is Developed To milk the BOOM and CRASH indices . Now Also work on weltrade for PAIN and GAIN indices. Send me Message if you need any help with the indicator.  CHECK OUT THE STARGOGS SPIKE CATCHER EA/ROBOT V3: CLICK HERE ALSO CHECK OUT SECOND TO NONEFX SPIKE CATCHER:   CLICK HERE STARGOGS SPIKE CATCHER V4.0 WHATS NEW! Brand New Strategy. This is the Indicator you need for 2025. New Trend Filter to minimize losses and maximize profits. New Trendline th
Super Signal – Skyblade Edition Professional No-Repaint / No-Lag Trend Signal System with Exceptional Win Rate | For MT4 / MT5 Core Features: Super Signal – Skyblade Edition is a smart signal system designed specifically for trend trading. It applies a multi-layered confirmation mechanism to detect only strong, directional moves supported by real momentum. This system does   not attempt to predict tops or bottoms . It only triggers signals when all three of the following conditions are met: Clea
Royal Scalping Indicator M5
Vahidreza Heidar Gholami
5 (6)
Royal Scalping Indicator is an advanced price adaptive indicator designed to generate high-quality trading signals. Built-in multi-timeframe and multi-currency capabilities make it even more powerful to have configurations based on different symbols and timeframes. This indicator is perfect for scalp trades as well as swing trades. Royal Scalping is not just an indicator, but a trading strategy itself. Features Price Adaptive Trend Detector Algorithm Multi-Timeframe and Multi-Currency Trend Low
More from author
Canal H Pro
N'da Lemissa Kouame
English – Canal H Pro Name: Canal H Pro – Support, Resistance & Breakout Short Description: Premium indicator with three dynamic lines (high, low, median) . Perfect for Breakout, Range, and trend following. Full Description: Red (High) → dynamic resistance Blue (Low) → dynamic support Yellow (Median) → balance and trend filter Automatic BUY/SELL signals on chart Adjustable period and colors Works on all strategies and timeframes Canal H Pro – spot key zones and take positions fast.
NuageTrend Pro
N'da Lemissa Kouame
Nuage Trend Pro – Trend Tracking & Kijun Signals Nuage Trend Pro is an advanced indicator for MetaTrader 5 , designed to quickly identify strong market trends and pinpoint optimal entry points through Kijun crossovers. Transform your charts into clear visual maps to trade with accuracy and confidence . Key Features Automatic Kijun Cross Detection : Instantly highlights key moments when price crosses the base line. Dynamic Trend Cloud : Your chart comes alive with intuitive colors – green f
Weekly Levels Pro
N'da Lemissa Kouame
Description – Weekly Levels Pro Weekly Levels Pro – Key Weekly Levels is a simple yet powerful indicator for MetaTrader 5, designed to automatically display the four most important trading levels of each week: Weekly High → natural resistance level Weekly Low → natural support level Weekly Open → trend reference point Weekly Close → bullish or bearish strength indicator Key Features: Automatically updates at the start of each new week Clear and easy-to-read display directly on the char
Pin Bar Pro v1
N'da Lemissa Kouame
Pin Bar Pro v1.0 – MQL5 Indicator Description: Pin Bar Pro is a professional MetaTrader 5 indicator that automatically detects Pin Bars , a key candlestick pattern for anticipating market reversals. Signals are displayed as custom arrows directly on the chart: Blue arrow → Buy signal (bullish Pin Bar) Red arrow → Sell signal (bearish Pin Bar) Features: Automatic detection of Pin Bars Customizable visual arrows ( Arrow_Up_Code , Arrow_Down_Code ) Adjustable vertical offset ( Arrow_Offset_Pts ) W
Monthly Levels Pro
N'da Lemissa Kouame
ENGLISH – Monthly Levels Pro v1.0 The Ultimate Monthly Market Levels Indicator Master key market zones at a glance. Monthly Levels Pro helps you analyze long-term trends and spot essential support and resistance levels by automatically displaying the High, Low, Open, and Close of a monthly candle. Why Choose Monthly Levels Pro? Instant Analysis – See monthly levels immediately without checking candles manually. Smarter Trading – Spot reversal or breakout zones at a glance. Clear Visuals –
Indicator Monthly Levels + Pin Bar Pro Description The Monthly Levels + Pin Bar Pro indicator combines the power of monthly key levels (High, Low, Open, Close) with automatic detection of Price Action reversal patterns (Pin Bars) . Designed for technical and institutional traders, it helps anticipate market reaction zones and generates clear visual signals directly on the chart. Main Features Automatic monthly levels : High, Low, Open, Close. Pin Bar detection (bullish & bearish) in r
Yearly Levels Pro
N'da Lemissa Kouame
1️⃣ English – Yearly Levels Pro v1.0 Version: 1.0 Developer: KOUAME N'DA LEMISSA Platform: MetaTrader 5 (MT5) Type: Technical Indicator / Annual Price Levels Description: Yearly Levels Pro v1.0, developed by KOUAME N'DA LEMISSA, is a powerful indicator to quickly identify annual key price levels. It automatically calculates the Open, High, Low, and Close prices of a specific year and displays them on the chart with colored horizontal lines. Key Features: High (Red), Low (Blue), Open (Green), Cl
English Version Quarterly Levels Pro v1.0 – Commercial Notice Product Name: Quarterly Levels Pro v1.0 Developer: KOUAME N'DA LEMISSA Version: 1.0 Description: Quarterly Levels Pro , developed by KOUAME N'DA LEMISSA , is a professional indicator for MetaTrader 5 that automatically displays High, Low, Open, and Close levels of a quarterly period. It allows traders to clearly visualize key support and resistance zones on the chart, facilitating medium-term trading decisions. Main Features: Aut
English (Anglais) Description Multi-Timeframe Levels Pro v1.0 automatically plots key Daily, Monthly, Quarterly, and Yearly levels (High, Low, Open, Close) directly on your chart. These levels are essential for identifying strong supports, resistances, and breakout zones. Key Features Automatic display of Daily / Monthly / Quarterly / Yearly levels Clear and color-coded High, Low, Open, Close Customizable Shift to analyze past periods Works on all markets: Forex, Indices, Commodities, Stocks, Cr
Marubozu Pro MT5
N'da Lemissa Kouame
Commercial Description – Marubozu Pro (MT5) Description Marubozu Pro is a professional indicator for MetaTrader 5 that automatically detects Marubozu candles (bullish and bearish) directly on your chart. It helps traders identify strong market momentum where buyers or sellers take full control, by displaying clear visual arrows for buy and sell signals. This tool is designed to be simple, effective, and fast , perfect for manual trading or as a filter in automated strategies. Key Features
Fusion Monthly Levels + PinBar + Marubozu Description This unique indicator merges three powerful technical analysis tools into one: Monthly Levels (High, Low, Open, Close) – to identify key support and resistance zones. PinBar Detection – a reliable reversal candlestick pattern signaling price rejections. Marubozu Detection – strong trending candles that indicate directional momentum. Thanks to this fusion, you get a visual, comprehensive, and responsive tool to anticipate market moves.
ABCD Lemissa + Monthly Levels + PinBar + Marubozu Indicator Description This indicator combines multiple powerful tools to provide a complete market overview: ABCD Lemissa – Automatically detects ABCD structures with points A, B, C, and D , support/resistance zones, and buy/sell arrows. Monthly Levels – Displays High, Low, Open, Close levels of monthly candles for identifying key zones. PinBar & Marubozu – Detects PinBar candles (reversal signals) and Marubozu candles (strong trend candles) w
Order Block Pro MT5
N'da Lemissa Kouame
Order Block Pro (MQL5) – Version 1.0 Author: KOUAME N'DA LEMISSA Platform: MetaTrader 5 Description: Order Block Pro is an advanced indicator designed to automatically detect bullish and bearish Order Blocks on your chart. By analyzing consolidation candles followed by strong impulsive candles, this tool highlights key areas where price movements are likely to accelerate. This indicator is perfect for traders who want to: Identify precise entry and exit points. Detect dynamic support and resist
ETE Detector v4.0 (Head & Shoulders) Author: KOUAME N’DA LEMISSA Version: 4.0 Platform: MetaTrader 5 Indicator Type: Chart / Visual Trading Signals Overview The ETE Detector v4.0 is a technical indicator designed to automatically detect classic and inverse Head & Shoulders patterns (H&S) on MT5 charts. These patterns are widely used to anticipate trend reversals. With this tool, traders can: Detect sell signals (classic H&S) and buy signals (inverse H&S) with accuracy. Easily visualize patterns
Avis commercial – ETE DETECTOR POWER v5.0 (Head & Shoulders Pro) Détection automatique des motifs tête et épaules ETE DETECTOR POWER v5.0 est un outil professionnel conçu pour les traders qui souhaitent anticiper les retournements majeurs du marché en utilisant l'un des modèles graphiques les plus puissants : le Head & Shoulders (H&S) et sa variation inverse. Grâce à son système de gestion d'objets optimisé (MaxObjects) , l'indicateur reste fluide et lisible, même sur des graphiques chargés
Dynamique mensuelle des plages hautes et basses v1.0 Auteur : KOUAME N'DA LEMISSA Description : L' indicateur dynamique mensuel de fourchette haute et basse affiche les niveaux mensuels clés sur votre graphique grâce à des fonctionnalités avancées de suivi dynamique. Il permet aux traders de visualiser facilement les zones de support et de résistance mensuelles, ainsi que les zones où le prix tend à dépasser ou à tester ces niveaux, offrant ainsi des opportunités de trading précises. P
Monthly High & Low Dynamic Range + Liquidity Zones v1.2 Author: KOUAME N'DA LEMISSA Description: Transform your market analysis with this powerful indicator that combines: Key Monthly Levels: High, Low, Open, and Close to identify the most important support and resistance zones. Dynamic High/Low Range: Automatically tracks extreme price movements to detect significant market shifts. Liquidity Zones: Visual rectangles showing areas where liquidity is concentrated (Buy/Sell). The thickness and c
Nom du produit :   Booster Trading Pro Auteur :   KOUAME N'DA LEMISSA Plateforme :   MetaTrader 5 Type :   Indicateur technique multifonction Description Transformez votre analyse de marché avec   Booster Trading Pro   , l'indicateur tout-en-un qui combine : Niveaux mensuels clés :   haut, bas, ouverture et clôture pour identifier rapidement les zones de support et de résistance. Plage dynamique haute et basse :   suivez les mouvements de prix extrêmes au-dessus ou en dessous des niveaux me
StructureBlocksAuto + MensuelOU La puissance de la structure rencontre la précision mensuelle Description Fusion StructureBlocksAuto + MonthlyOR est un indicateur tout-en-un avancé combinant la détection de la structure du marché (swings automatiques, plus hauts/plus bas et blocs de structure) avec le système Monthly Open Range (MOR) . Il offre une combinaison professionnelle d'analyse de la structure institutionnelle et de niveaux clés mensuels pour vous aider à détecter les zones de tradi
Channel Ultima
N'da Lemissa Kouame
Channel Ultima – Indicateur Multi-Canal Dynamique Description courte Channel Ultima est un indicateur avancé qui trace automatiquement trois canaux dynamiques du marché. Il offre une lecture claire des zones de support, de résistance et d'équilibre , idéale pour les traders techniques et structurels. Présentation détaillée Channel Ultima détecte et affiche trois canaux indépendants associés sur les pivots majeurs et mineurs du marché. Chaque canal représente une zone de pression sur le p
Carte de liquidité institutionnelle Pro Voyez ce que voient les institutions — avant tout le monde Aperçu Institutional Liquidity Map Pro est un indicateur professionnel conçu pour cartographier les zones de liquidité institutionnelle à l'aide des niveaux mensuels les plus hauts et les plus bas . Il détecte automatiquement les zones de stop-hunt , les zones de retournement potentiel et les zones d'accumulation/distribution institutionnelles . L'indicateur suit dynamiquement jusqu'à trois ni
Filter:
No reviews
Reply to review