Channel Ultima
- Indicators
- Version: 1.0
- Activations: 5

Channel Ultima – Indicateur multicanal dynamique
Auteur : KOUAME N'DA LEMISSA
Plateforme : MetaTrader 5 (MT5)
Description:
Channel Ultima est un indicateur de structure de marché avancé qui trace automatiquement trois canaux dynamiques multi-temporels.
Il permet une analyse précise de la structure des prix, des zones de support et de résistance, ainsi que des zones d'équilibre, offrant ainsi une vision claire et professionnelle du marché.
Cet outil est conçu pour les traders techniques, les traders SMC et les stratégies d'analyse de l'action des prix.
Aperçu détaillé :
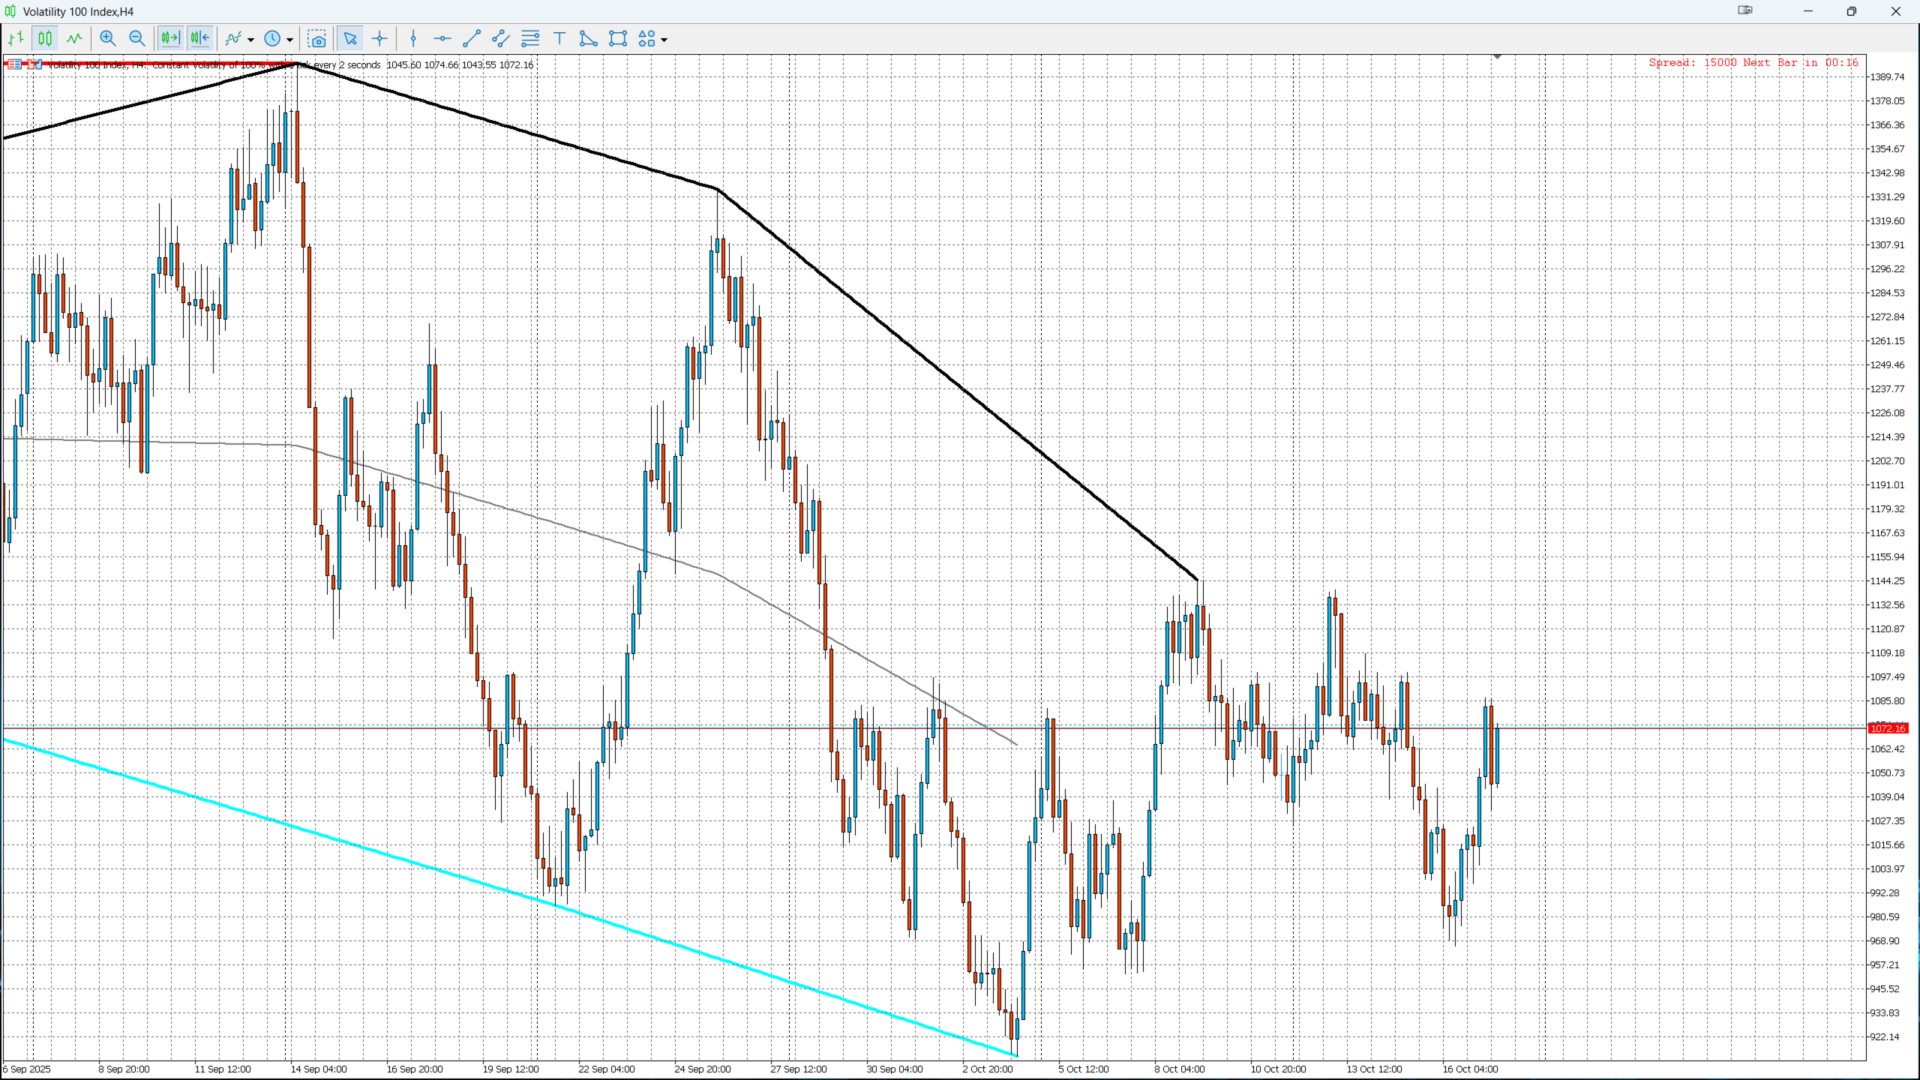
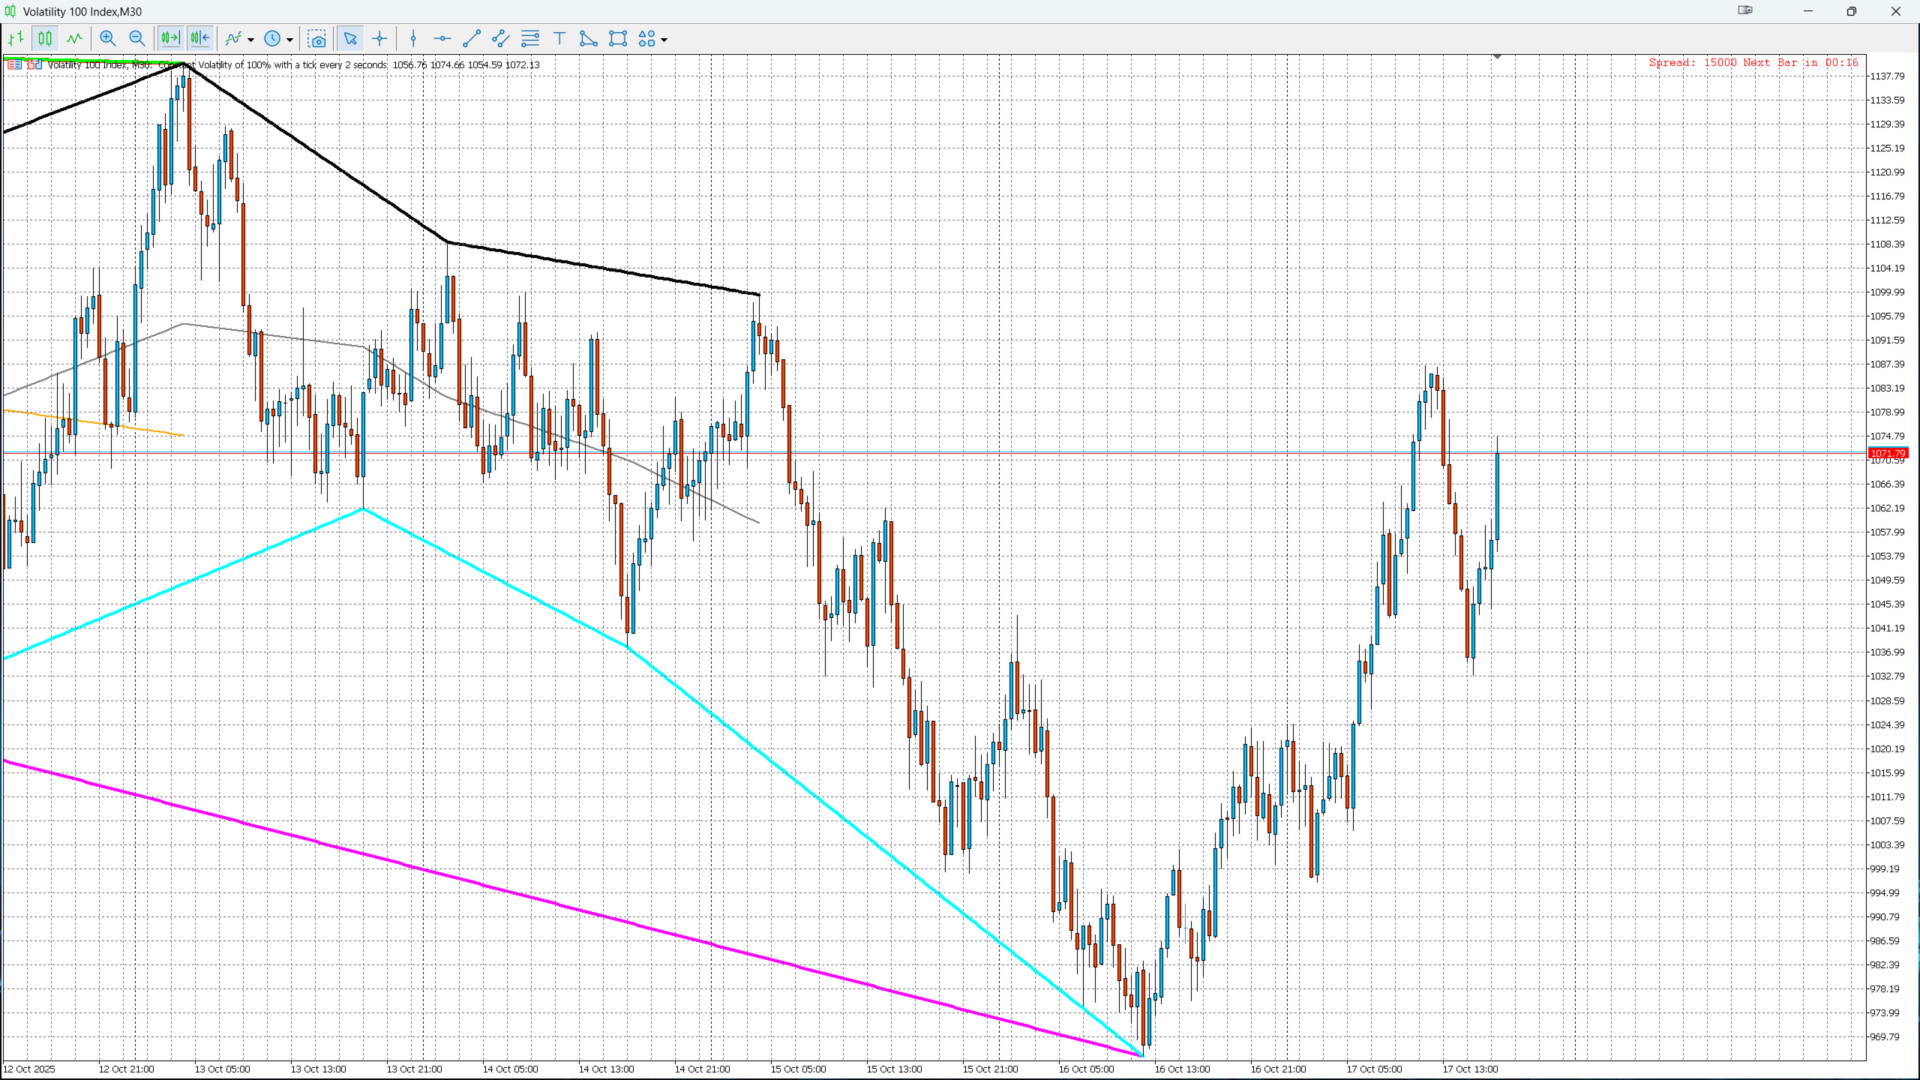
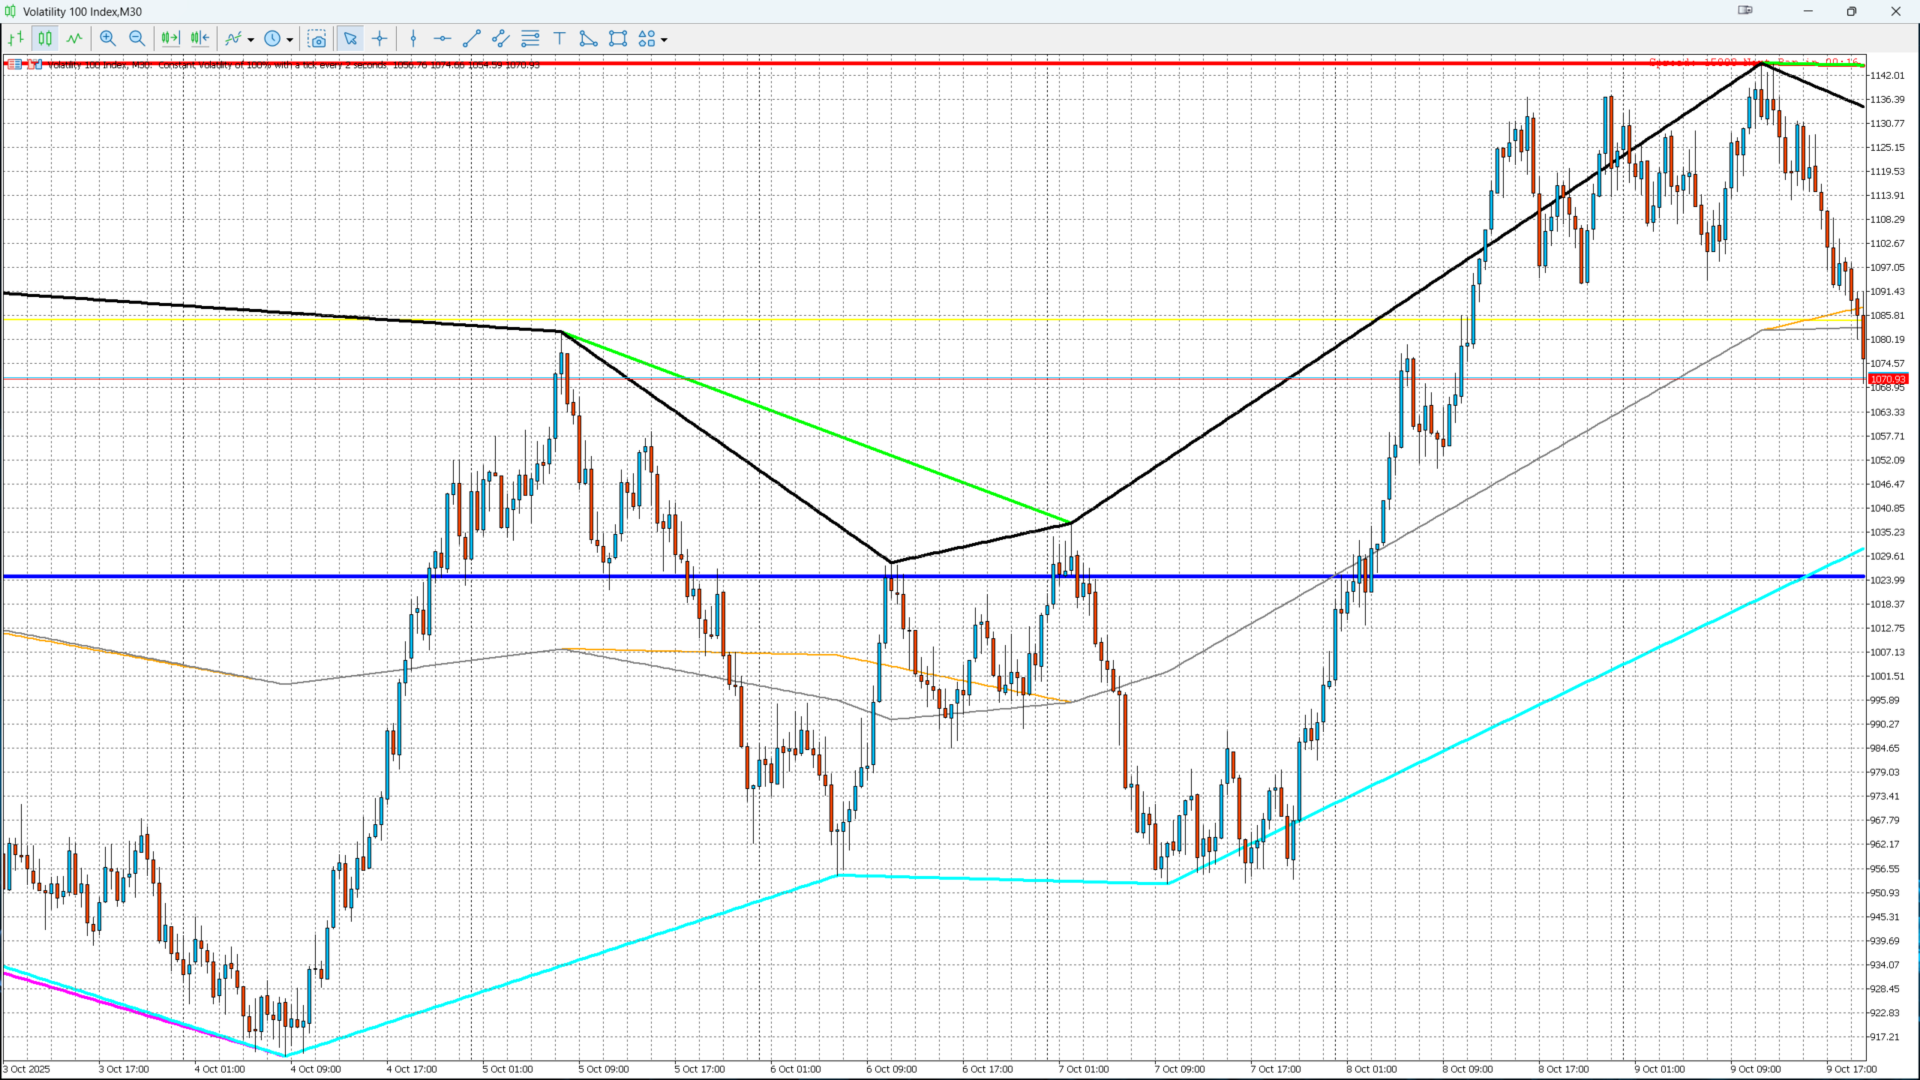
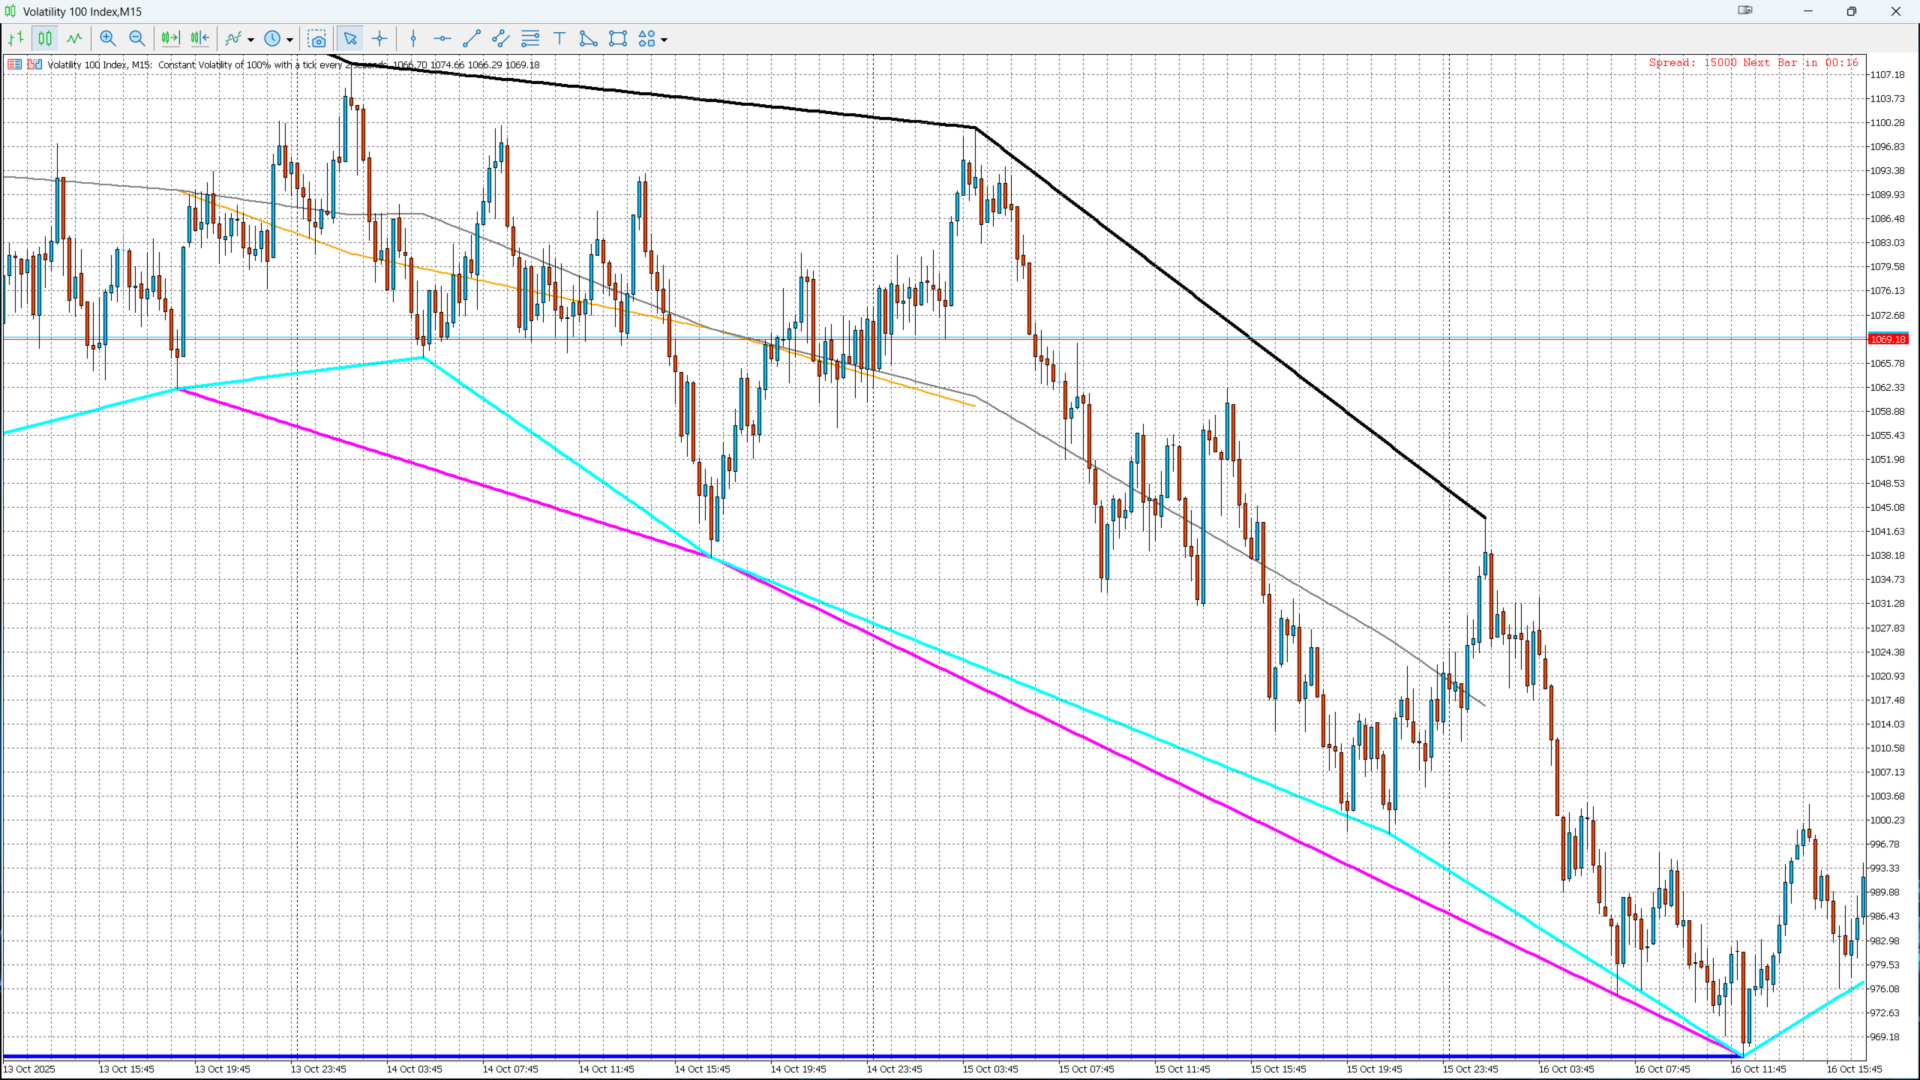
Channel Ultima détecte automatiquement les changements importants du marché afin de construire trois canaux indépendants :
• Canal à court terme → mouvements rapides et opportunités intraday
• Canal à moyen terme → tendances et mouvements intermédiaires
• Canal à long terme → structure du marché mondial
Chaque canal est composé de :
• Ligne supérieure (résistance dynamique)
• Ligne médiane (équilibre du marché)
• Ligne inférieure (support dynamique)
Les canaux s'adaptent automatiquement en temps réel à l'évolution des prix.
Objectif et utilité :
• Visualiser la structure multicouche du marché
• Identifier les zones de liquidité et de retournement
• Optimiser les points d'entrée lors des cassures ou des rebonds
• Confirmer les signaux avec d'autres outils (Kijun, Donchian, FZG)
Channel Ultima agit comme une boussole structurelle de l'évolution des prix, essentielle pour une lecture professionnelle du marché.
Caractéristiques principales :
• 3 canaux indépendants (court/moyen/long terme)
• Détection automatique des plus hauts et des plus bas
• Lignes dynamiques : Haut/Moyen/Bas
• Extension automatique à la bougie actuelle
• Couleurs distinctes pour chaque canal
• Performances optimisées en temps réel
• Compatible avec tous les actifs et toutes les unités de temps
Paramètres personnalisables :
| Paramètre | Description |
| Barres de rétrospective | Nombre de bougies utilisées pour la détection du pivot |
| Sensibilité du swing | Ajuste la précision de la détection des niveaux haut/bas |
| Étendre à la barre actuelle | Permet l'extension automatique des canaux |
| Ensemble de couleurs | Personnalisation visuelle des chaînes |
Utilisation stratégique :
- Appliquer Channel Ultima sur le graphique MT5
- Observez l'interaction des prix avec les canaux
- Les transactions rebondissent sur les supports/résistances ou les cassures.
- Confirmer les entrées avec des outils techniques supplémentaires
💡 Conseil : Lorsque les trois canaux s'alignent dans la même direction, cela signale une forte probabilité de continuation ou d'inversion structurelle.
Applications pratiques :
• Concepts de gestion financière intelligente (SMC)
• Analyse de l'action des prix / Structure du marché
• Swing trading et trading intraday
• Zones de liquidité (Hauts égaux / Bas égaux)
• Filtrage des fausses cassures
Avantages :
• Lecture claire et instantanée de la structure du marché
• Analyse structurelle simplifiée
• Configuration simple et flexible
• Convient à tous les styles de trading
• Léger et performant sur MetaTrader 5
Spécifications techniques :
• Plateforme : MetaTrader 5 (MT5)
• Actifs : Forex, Indices, Crypto, Matières premières
• Unités de temps : M1 → MN1
• Dépendances : Aucune
• Auteur : KOUAME N'DA LEMISSA
Conclusion:
Channel Ultima est un outil avancé d'analyse de la structure du marché conçu pour améliorer la précision des analyses et la prise de décision en matière de trading.