Fusion Monthly Levels PinBar Marubozu

Fusion Monthly Levels + PinBar + Marubozu

📝 Description
This unique indicator merges three powerful technical analysis tools into one:

  • Monthly Levels (High, Low, Open, Close) – to identify key support and resistance zones.

  • PinBar Detection – a reliable reversal candlestick pattern signaling price rejections.

  • Marubozu Detection – strong trending candles that indicate directional momentum.

Thanks to this fusion, you get a visual, comprehensive, and responsive tool to anticipate market moves.

🚀 Advantages

  • Combines institutional levels + price action.

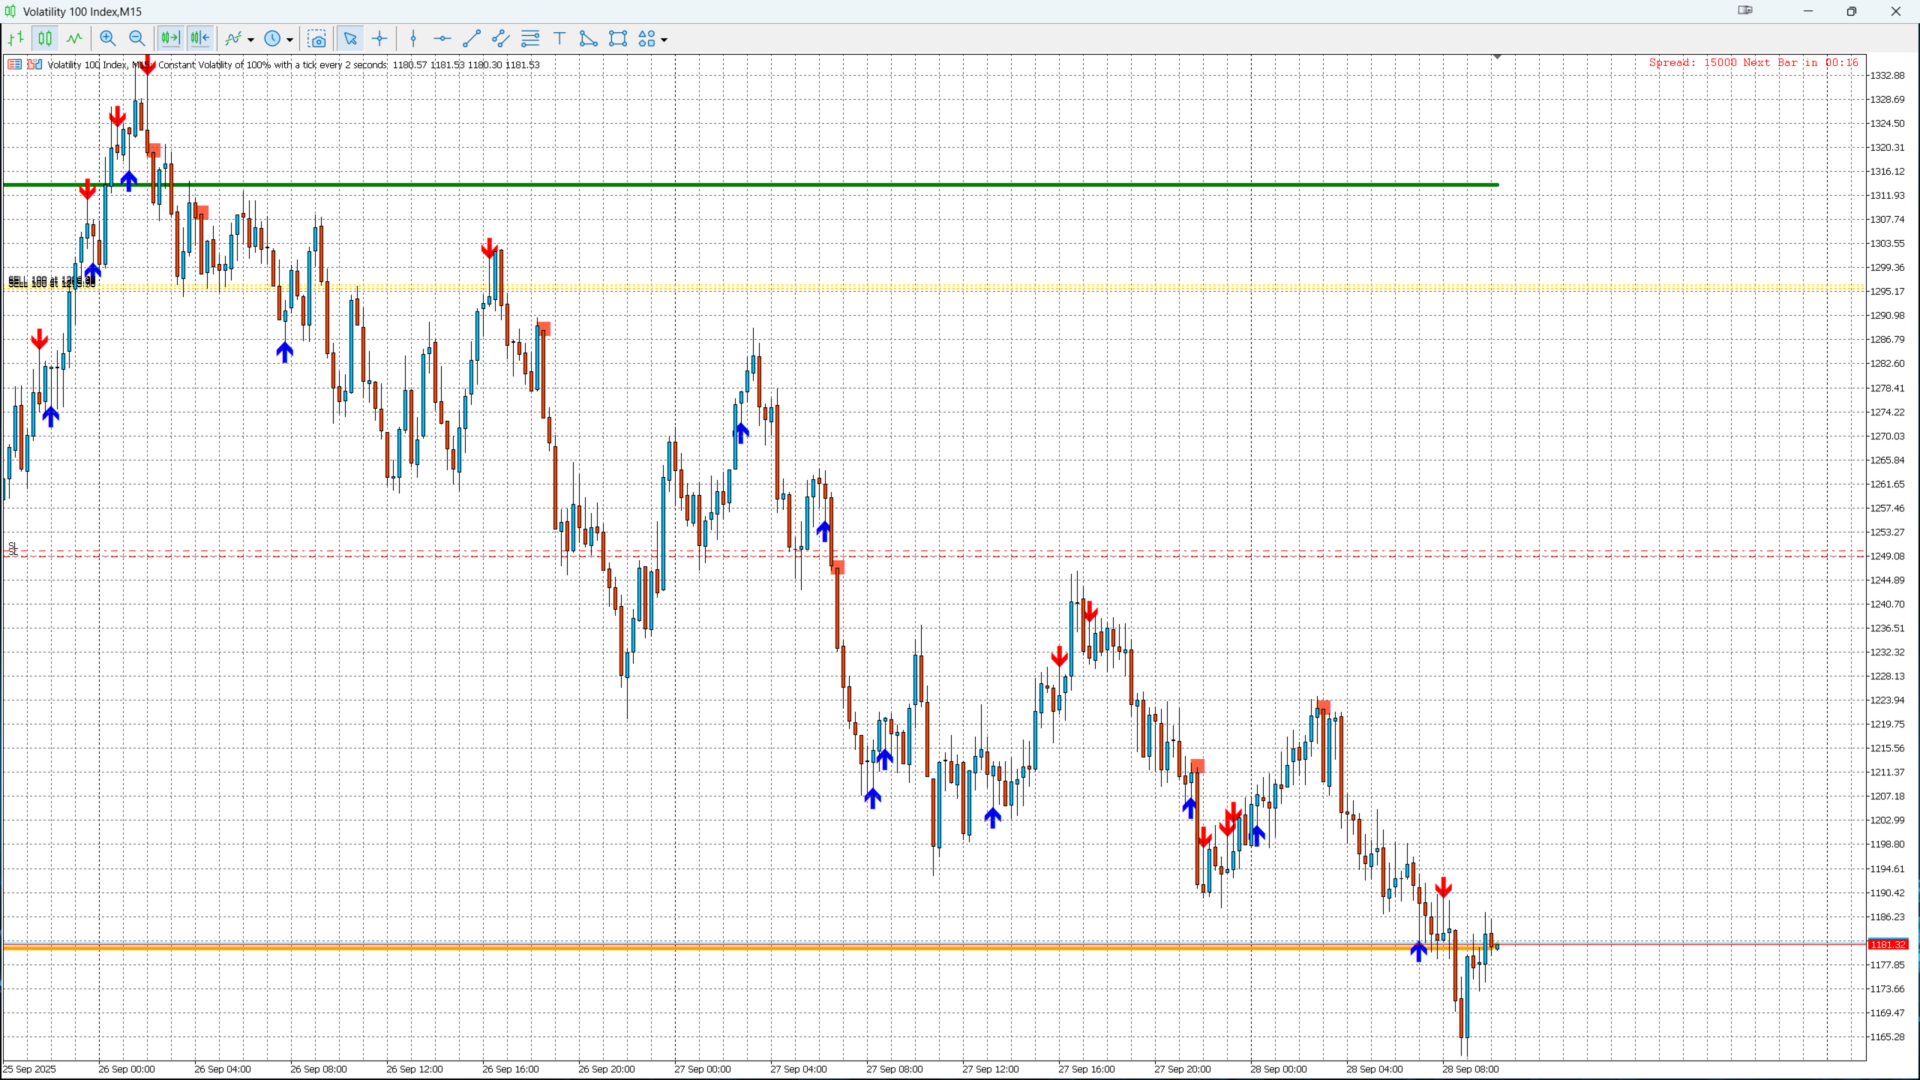
  • Clear visual signals: blue/red arrows for PinBars, blue/red squares for Marubozu.

  • Works on all assets (Forex, Indices, Crypto, Commodities, Stocks).

  • Customizable parameters (reference timeframe, wick size, arrow style).

  • Optimized code with zero lag, even on multiple charts.

  • Fully compatible with MetaTrader 5.
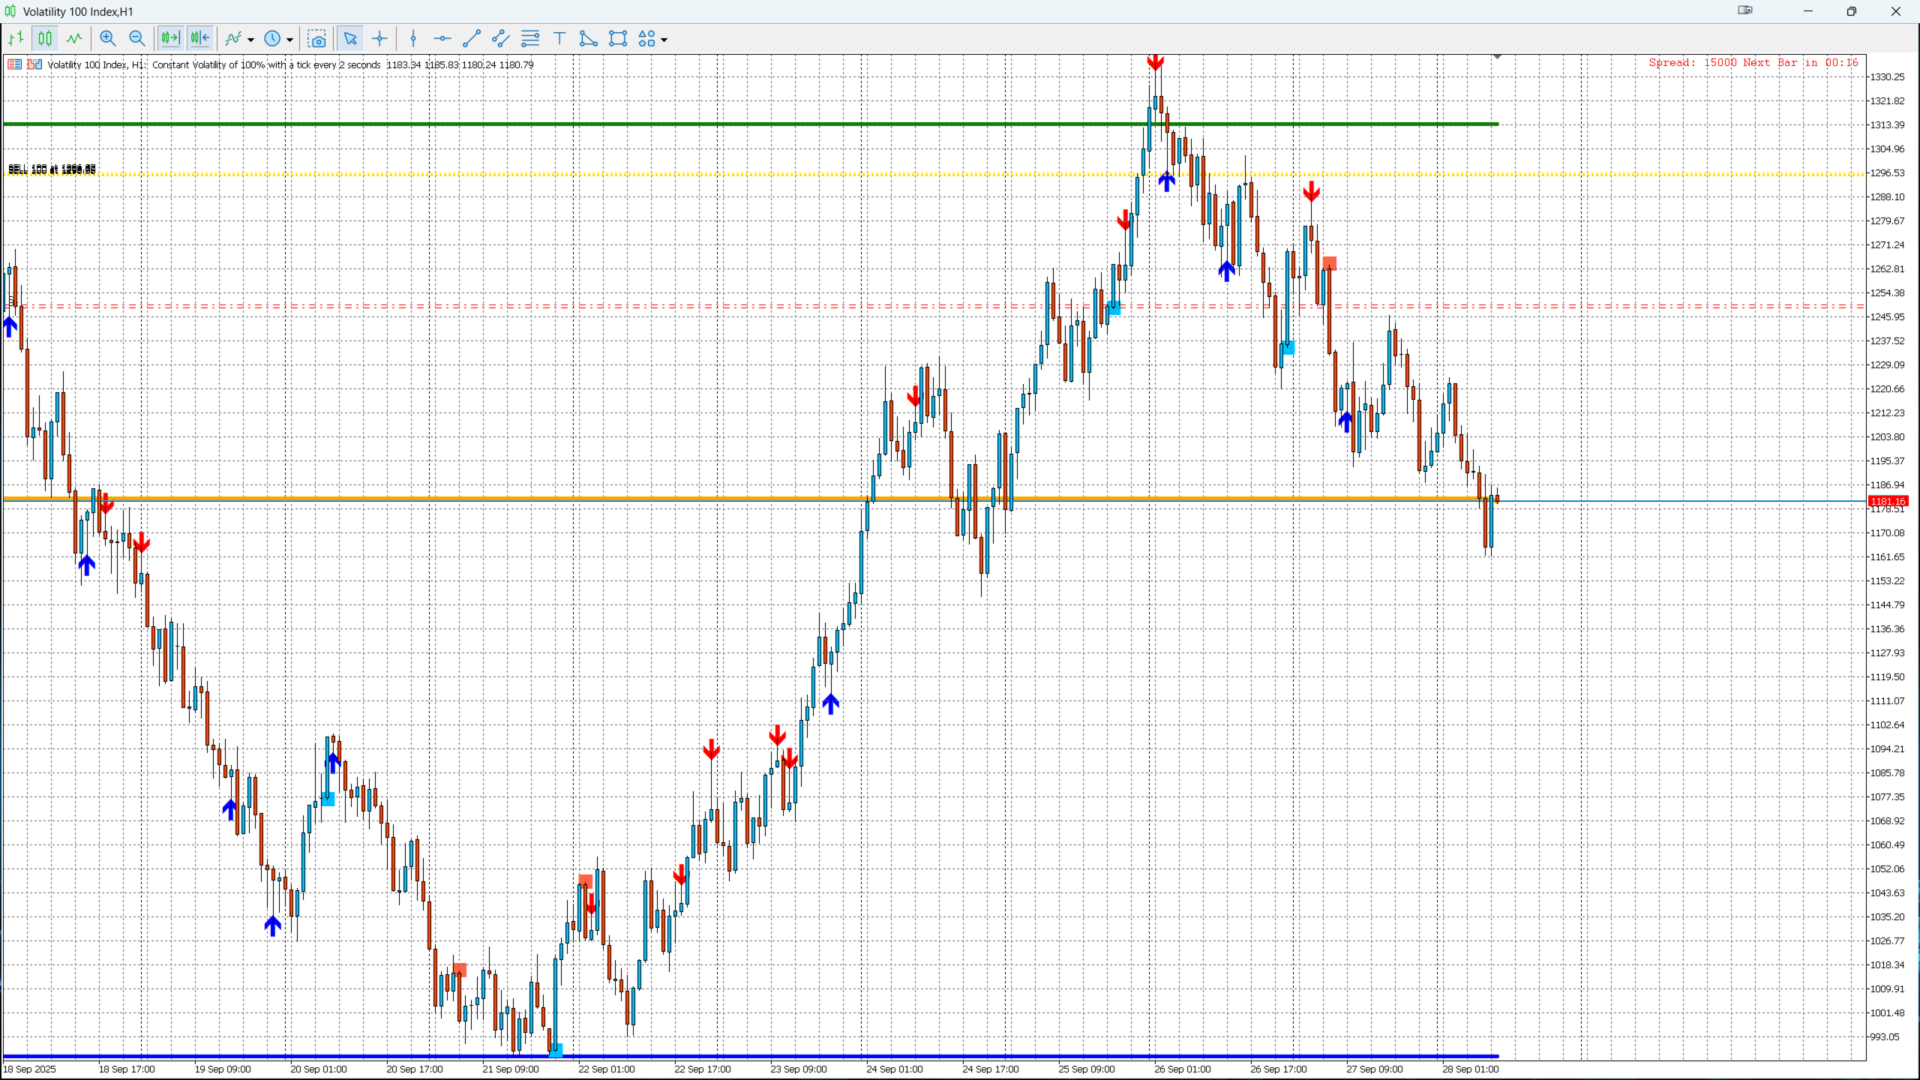
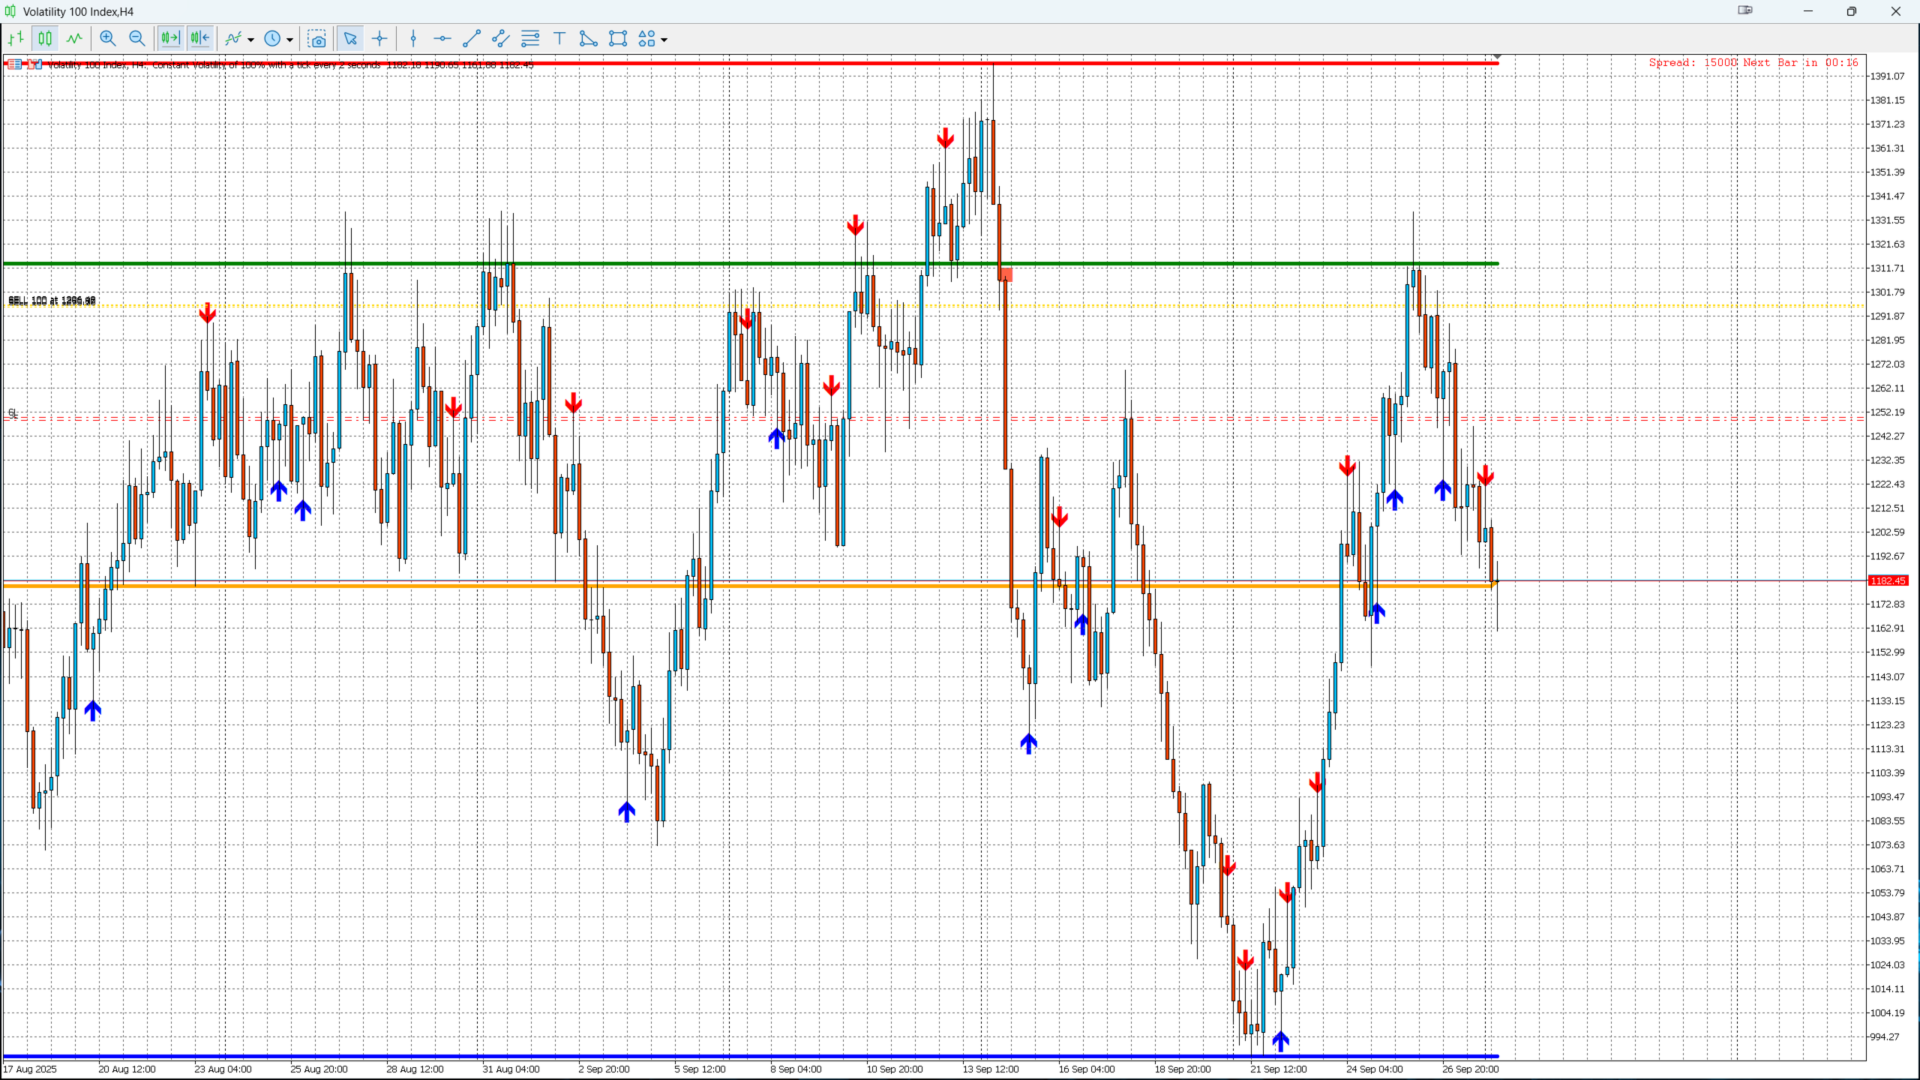
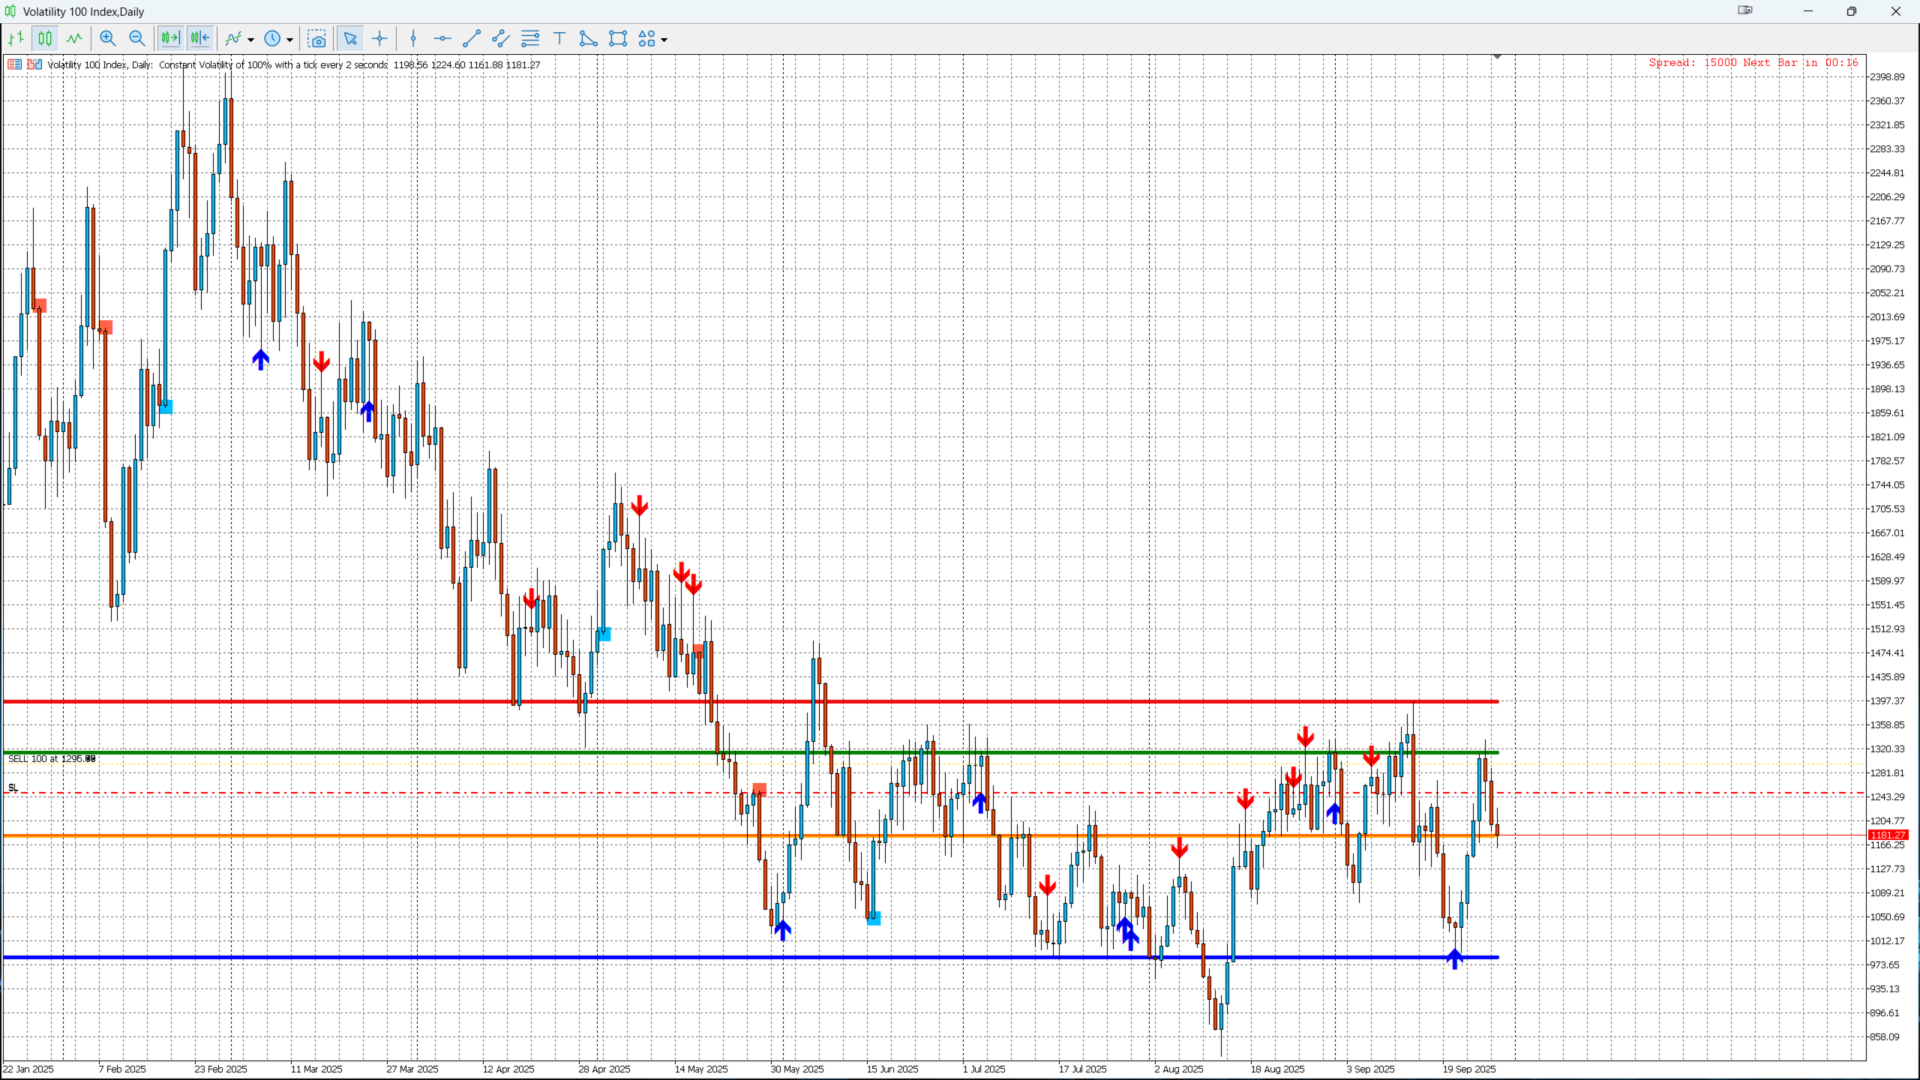
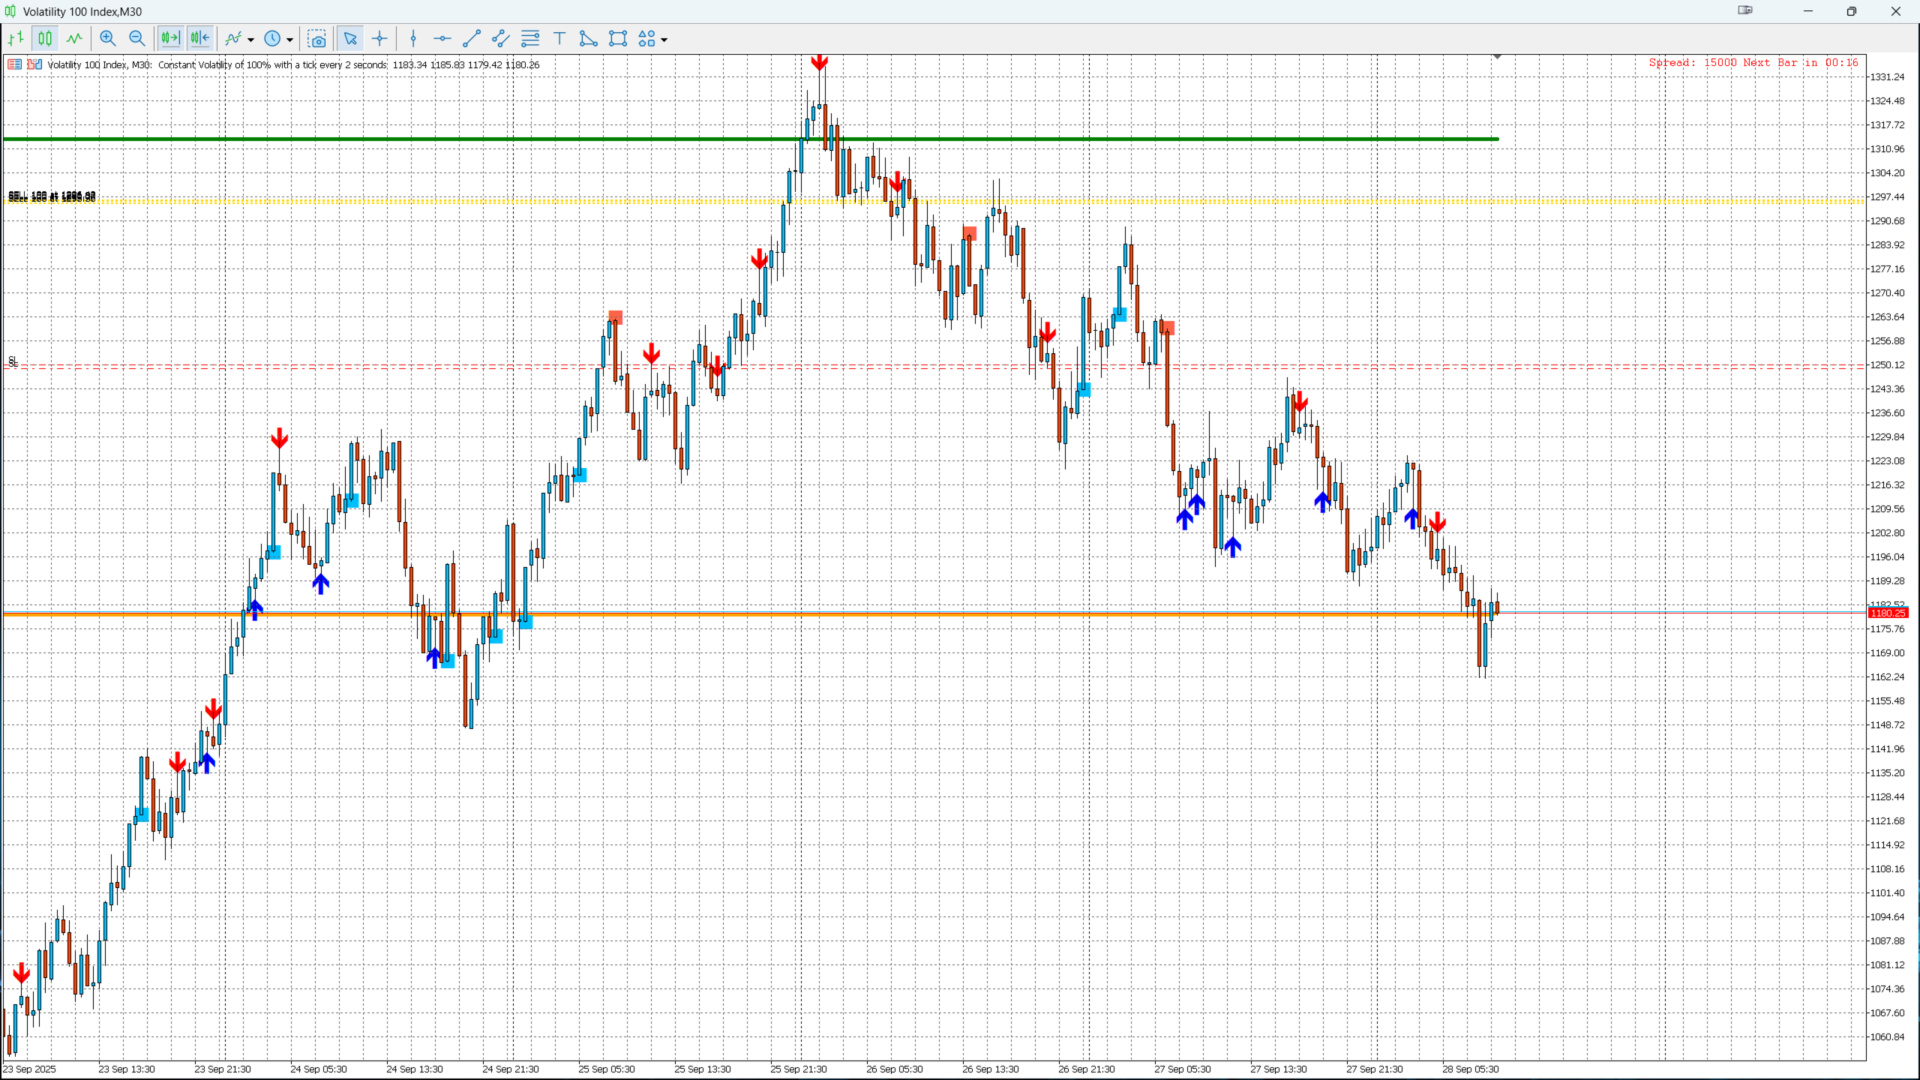
🔔 Signals

  • Bullish PinBar → blue arrow below the candle.

  • Bearish PinBar → red arrow above the candle.

  • Bullish Marubozu → blue square below the candle.

  • Bearish Marubozu → red square above the candle.

Monthly Levels:

  • Red = Monthly High

  • Blue = Monthly Low

  • Green = Monthly Open

  • Orange = Monthly Close

⚙️ Settings

  • Ref_Timeframe → choose the reference period (default: Monthly).

  • Arrow_Offset_Pts → vertical offset for arrows/squares.

  • WickMaxRatio → maximum wick size to validate a Marubozu.

  • Wingdings Codes → customize symbols (arrows, squares, etc.).

📊 How to Use

  1. Identify key zones (Monthly High/Low).

  2. Wait for a PinBar or Marubozu to form near these levels.

  3. Confirm entry with additional tools (trend, volume, indicators).

  4. Suitable for scalping, day trading, and swing trading.

🎯 Ideal For

  • Price Action traders.

  • Traders looking for an all-in-one indicator to simplify charts.

  • Both beginners and advanced traders aiming to anticipate reversals and trend continuations.


Recommended products
Owl Smart Levels MT5
Sergey Ermolov
4.03 (32)
MT4 version  |   FAQ The Owl Smart Levels Indicator is a complete trading system within the one indicator that includes such popular market analysis tools as Bill Williams' advanced fractals , Valable ZigZag which builds the correct wave structure of the market, and Fibonacci levels which mark the exact levels of entry into the market and places to take profits. Detailed description of the strategy Instructions for working with the indicator Advisor-assistant in trading Owl Helper Private User
Fibaction
Abdelkhalek Orabi
Indicator Name: Fibaction – price action candle Detector Description: Fibo Signal Boxes is a powerful Smart Money Concept (SMC)-inspired indicator that auto-detects price action candles. bullish hammers and shooting stars, then draws precise Fibonacci entry zones and multiple take-profit levels directly on the chart. as for the SL personally i use 40 pips rules  Key Features: Detects bullish hammer and shooting star reversal candles. Automatically draws Fibonacci entry and TP boxes. as
PZ Support Resistance MT5
PZ TRADING SLU
3.71 (7)
Unlock key market insights with automated support and resistance lines Tired of plotting support and resistance lines? This is a multi-timeframe indicator that detects and plots supports and resistance lines in the chart with the same precision as a human eye would. As price levels are tested over time and its importance increases, the lines become thicker and darker, making price leves easy to glance and evaluate. [ Installation Guide | Update Guide | Troubleshooting | FAQ | All Products ] Boos
PipFinite Exit EDGE MT5
Karlo Wilson Vendiola
4.87 (30)
Did You Have A Profitable Trade But Suddenly Reversed? In a solid strategy, exiting a trade is equally important as entering. Exit EDGE helps maximize your current trade profit and avoid turning winning trades to losers. Never Miss An Exit Signal Again Monitor all pairs and timeframes in just 1 chart www.mql5.com/en/blogs/post/726558 How To Trade You can close your open trades as soon as you receive a signal Close your Buy orders if you receive an Exit Buy Signal. Close your Sell orders if
Trend Master Chart MT5
Frederic Jacques Collomb
Trend Master Chart is the trend indicator you need. It overlays the chart and uses color coding to define different market trends/moves. It uses an algorithm that combines two moving averages and different oscillators. The periods of these three elements are modifiable. It works on any time-frame and any Pair. At a glance you will be able to identify an upward or downward trend and the different entry points into this trend. For example during a marked upward trend (light green color) the diffe
Precision Breakout Pro
James Patrick D Artanion Grieves
- How It Works Core Concept This is a range breakout trading indicator that identifies consolidation periods (ranges) and generates signals when price breaks above or below those ranges. It can operate in both trending and mean reversion modes. Key Components: 1. Range Identification Range Period : Defines a specific time window each trading day (e.g., 10:00 AM - 12:00 PM) Range Calculation : During this period, the indicator tracks the highest high and lowest low prices Trading Days : Configura
Double HMA MTF for MT5
Pavel Zamoshnikov
4 (4)
This is an advanced multi-timeframe version of the popular Hull Moving Average (HMA) Features Two lines of the Hull indicator of different timeframes on the same chart. The HMA line of the higher timeframe defines the trend, and the HMA line of the current timeframe defines the short-term price movements. A graphical panel with HMA indicator data from all timeframes at the same time . If the HMA switched its direction on any timeframe, the panel displays a question or exclamation mark with a tex
This indicator will help traders quickly identify inside bars, which are often used in price action trading strategies as potential consolidation or continuation patterns. An inside bar formation is a counter trend candle on both sides as it didn't break the previous candle high or low. Key feature: Identify inside bars in real-time. Colours inside bars while keeping normal bars. Configurable history bars. Optional pop-up alerts and phone notifications with symbol name and time of detection. W
Wave Trend MT5
Diego Arribas Lopez
MT4 Version Wave Trend MT5 Wave Trend is an oscillator, which helps identifing in a extremely accurate manner market reversals. The Oscillator being obove the overbought level and a cross down of the fast into the slow MA usually indicates a good SELL signal. If the oscillators is below the oversold level and the fast MA crosses over the slower MA usually highlights a good BUY signal. The Wave Trend indicator can be also used when divergences appear against the price, indicating the current move
Auto Optimized RSI   is a smart and easy-to-use arrow indicator designed for precision trading. It automatically finds the most effective RSI Buy and Sell levels for your selected symbol and timeframe using real historical data simulations. The indicator can be used as a standalone system or as part of your existing trading strategy. It is especially useful for intraday trading. Unlike traditional RSI indicators that rely on fixed 70/30 levels,   Auto Optimized RSI   dynamically adjusts its lev
MSnR Lines
Pierre Paul Amoussou
MSnR Lines is a custom indicator designed to display Support and Resistance levels on a chart. These levels are based on Malaysian Support and Resistance theory, which defines levels not as areas but as specific price levels derived from line chart peaks and valleys. Features: Three types of levels: A-Level, V-Level, and Gap Level. Freshness indication for levels: Fresh levels are more significant than unfresh levels. Customizable color and style for fresh and unfresh levels. Option to display o
ParitySnap
Kazutaka Yamamoto
ParitySnap — Triad Z-Score Reversion Non-Repaint / Hedge-Fund-Inspired Mean Reversion / NY-Close Pivot-SL Holiday Promo (until Dec 25, JST): Lifetime $199 / Rental $30 - Standard after promo: Lifetime $209- / Rental $40 - WHAT IT DOES ParitySnap detects tri-currency parity distortions (e.g., GOLD: XAUUSD–AUDUSD–XAUAUD ) and prints non-repainting entries on the just-closed bar when a Z-score mean-reversion edge is present. Built for traders who value transparency and statistical rigor , it bring
EmoSandR
Clever Emoghene
EmoSupportandResistance Indicator EmoSupportandResistance is an indicator for MetaTrader that automatically highlights important support and resistance zones. These zones represent price levels where the market has previously reacted, making them useful reference points for technical analysis. The indicator updates zones in real time as new price data becomes available and plots them clearly on the chart. Main Features Automatic identification of support and resistance levels Real-time updating
Ultimate Supply Demand MT5
Ramon Sobrevals Arce
5 (4)
After working during many months, with the help of Neural Networks, we have perfected the ultimate tool you are going to need for identifying key price levels (Supports and Resistances) and Supply and Demand zones. Perfectly suitable to trigger your trades, set up your future actions, decide your Take Profit and Stop Loss levels, and confirm the market direction. Price will always move between those levels, bouncing or breaking; from one zone to another, all the remaining movements are just mark
The SMC Venom Model BPR indicator is a professional tool for traders working within the Smart Money (SMC) concept. It automatically identifies two key patterns on the price chart: FVG   (Fair Value Gap) is a combination of three candles, in which there is a gap between the first and third candles. It forms a zone between levels where there is no volume support, which often leads to a price correction. BPR   (Balanced Price Range) is a combination of two FVG patterns that form a “bridge” - a zon
Noize Absorption Index - is the manual trading system that measures the difference of pressure between bears forces and bulls forces. Green line - is a noize free index that showing curent situation. Zero value of index shows totally choppy/flat market.Values above zero level shows how powerfull bullish wave is and values below zero measures bearish forces.Up arrow appears on bearish market when it's ready to reverse, dn arrow appears on weak bullish market, as a result of reverse expectation.
This Indicator enhances the default Relative Strength Index (RSI) by introducing several improvements. First, it visually highlights overbought and oversold regions by changing the RSI color from white to red. Second, it includes additional reference lines at 20, 40, 50, 60, and 80, providing a clearer framework for assessing RSI values. The most notable feature is the use of the middle 50-line to indicate the current market cycle. The color of the 50-line dynamically reflects the cycle: green f
PipFinite Trend PRO MT5
Karlo Wilson Vendiola
4.84 (556)
Breakthrough Solution For Trend Trading And Filtering With All Important Features Built Inside One Tool! Trend PRO's smart algorithm detects the trend, filters out market noise and gives entry signals with exit levels. The new features with enhanced rules for statistical calculation improved the overall performance of this indicator. Important Information Revealed Maximize the potential of Trend Pro, please visit www.mql5.com/en/blogs/post/713938 The Powerful Expert Advisor Version Automatin
Trade smarter, not harder: Empower your trading with Harmonacci Patterns This is arguably the most complete harmonic price formation auto-recognition indicator you can find for the MetaTrader Platform. It detects 19 different patterns, takes fibonacci projections as seriously as you do, displays the Potential Reversal Zone (PRZ) and finds suitable stop-loss and take-profit levels. [ Installation Guide | Update Guide | Troubleshooting | FAQ | All Products ] It detects 19 different harmonic pri
MT5 Support and Resistance Indicator Automatic Drawing of Multiple Supports and Resistances with levels.  Supports As follow 1.       Weak Support 2.       Untested Support 3.       Verified Support 4.       Proven Support 5.       Turncoat Support Resistances As follow 1.       Weak Resistance 2.       Untested Resistance 3.       Verified Resistance 4.       Proven Resistance 5.       Turncoat Resistance Best Strategy to use 1.       Identify Trend Direction on Daily Time Frame, Example Gold =
Support & Resistance indicator is a modification of the standard Bill Williams' Fractals indicator. The indicator works on any timeframes. It displays support and resistance levels on the chart and allows setting stop loss and take profit levels (you can check the exact value by putting the mouse cursor over the level). Blue dashed lines are support level. Red dashed lines are resistance levels. If you want, you can change the style and color of these lines. If the price approaches a support lev
Harmonic Patterns are utilized for predicting market turning points with precision. These patterns offer a high win rate and numerous trade opportunities within a single trading day. Our indicator identifies the most prominent Harmonic Patterns based on principles outlined in Harmonic Trading literature. **IMPORTANT NOTES:** - The indicator does not repaint, lag, or redraw. It accurately identifies patterns at the D point, ensuring reliability in pattern detection.    **HOW TO USE:** 1. Drag
Candle Pattern Finder MT5
Pavel Zamoshnikov
4.2 (5)
This indicator searches for candlestick patterns. Its operation principle is based on Candlestick Charting Explained: Timeless Techniques for Trading Stocks and Futures by Gregory L. Morris. If a pattern is detected, the indicator displays a message at a bar closure. If you trade using the MetaTrader 4 terminal, then you can download the full analogue of the " Candle Pattern Finder for MT4 " indicator It recognizes the following patterns: Bullish/Bearish (possible settings in brackets) : Hammer
Premium level is a unique indicator with more than 80% accuracy of correct predictions! This indicator has been tested for more than two months by the best Trading Specialists! The author's indicator you will not find anywhere else! From the screenshots you can see for yourself the accuracy of this tool! 1 is great for trading binary options with an expiration time of 1 candle. 2 works on all currency pairs, stocks, commodities, cryptocurrencies Instructions: As soon as the red arrow app
Naturu
Ivan Stefanov
5 (1)
'Naturu' is a manual indicator that uses nature’s symmetry as its algorithm. Master the market with a simple strategy and hidden wisdom!   This is a manual indicator and contains features that are not supported by the MetaTrader testing environment When you load the indicator, you’ll see two lines—Top and Bottom. Click once on a line to activate it. To move it, simply click on the candlestick where you want it placed. You define a high point and a low point, and the indicator then calculates:
RM Divergence Pro
Mohammadreza Mahdi Mavaddat
RM Divergence Pro is a professional, non-repainting RSI divergence indicator designed for traders who want real structural insight beyond classic divergence tools. It accurately detects Regular Divergence (RD), Hidden Divergence (HD), Inability (IA), and Potential Divergence (P-DVG) using stable swing-based logic. Built for clarity, precision, and clean market structure analysis. -------------------------------------------------- OVERVIEW RM Divergence Pro is an advanced RSI-based divergence
First of all Its worth emphasizing here that this Trading Tool is Non Repainting , Non Redrawing and Non Lagging Indicator , Which makes it ideal for professional trading . Online course, user manual and demo. The Smart Price Action Concepts Indicator is a very powerful tool for both new and experienced traders . It packs more than 20 useful indicators into one , combining advanced trading ideas like Inner Circle Trader Analysis and Smart Money Concepts Trading Strategies . This indicator focus
Overview The Market Perspective Structure Indicator is a comprehensive MetaTrader indicator designed to provide traders with a detailed analysis of market structure across multiple timeframes. It identifies and visualizes key price action elements, including swing highs and lows, Break of Structure (BOS), Change of Character (CHOCH), internal structures, equal highs/lows, premium/discount levels, previous levels from higher timeframes, and trading session zones. With extensive customization opt
Gold EA: Proven Power for 1-Minute Gold Trading Transform your trading with our Gold EA, meticulously crafted for 1-minute charts and delivering over 2000% growth in 5 years from just $100-$1000 . No Martingale, No AI Gimmicks : Pure, time-tested strategies with robust money management, stop loss, and take profit for reliable performance across multiple charts. Flexible Trading Modes : Choose Fixed Balance for safe profits, Mark IV for bold growth, or %Balance for high rewards—combine Mark IV an
Monthly Levels Pro
N'da Lemissa Kouame
ENGLISH – Monthly Levels Pro v1.0 The Ultimate Monthly Market Levels Indicator Master key market zones at a glance. Monthly Levels Pro helps you analyze long-term trends and spot essential support and resistance levels by automatically displaying the High, Low, Open, and Close of a monthly candle. Why Choose Monthly Levels Pro? Instant Analysis – See monthly levels immediately without checking candles manually. Smarter Trading – Spot reversal or breakout zones at a glance. Clear Visuals –
Buyers of this product also purchase
SynaptixQuant Dominance Matrix
Devie Arevalo Montemayor
5 (1)
SynaptixQuant Dominance Matrix: Institutional-Grade Market State Extraction Engineered for traders who require a data-driven view of market behaviour beyond surface-level indicators. The Synaptix Quant (SQ) Dominance Matrix is not a conventional currency strength display. Behind its intentionally streamlined interface runs a sophisticated analytical architecture designed to quantify market conditions with precision. Every output is generated through layered signal processing built to identify d
How many times have you bought a trading indicator with great back-tests, live account performance proof with fantastic numbers and stats all over the place but after using it, you end up blowing your account? You shouldn't trust a signal by itself, you need to know why it appeared in the first place, and that's what RelicusRoad Pro does best! User Manual + Strategies + Training Videos + Private Group with VIP Access + Mobile Version Available A New Way To Look At The Market RelicusRoad is the
AriX
Temirlan Kdyrkhan
1 (4)
AriX Indicator for MT5 A powerful trend-following and signal-evaluation tool AriX is a custom MT5 indicator that combines Moving Averages and ATR-based risk/reward logic to generate clear buy/sell signals. It visualizes dynamic SL/TP levels, evaluates past trade outcomes, and displays win/loss statistics in a clean on-chart panel. Key features include: Buy/Sell signals based on MA crossovers ATR-based SL/TP1/TP2/TP3 levels with visual lines and labels Signal outcome tracking with real-time stat
ARICoins
Temirlan Kdyrkhan
ARICoin is a powerful trading companion designed to generate high-probability entry signals with dynamic TP/SL/DP levels based on volatility. Built-in performance tracking shows win/loss stats, PP1/PP2 hits, and success rates all updated live. Key Features: Buy/Sell signals with adaptive volatility bands Real-time TP/SL/DP levels based on ATR Built-in MA Filter with optional ATR/StdDev volatility Performance stats panel (Success, Profit/Loss, PP1/PP2) Alerts via popup, sound, push, or email Cust
This indicator uses support and resistance, volume and some special formula to calculate the volume to filter the candles. If the volume reaches a specific value, And at the same time, Candle breaks the support/resistance line, There would be a signal and we can enter the market. Signals appear when the current candle closes. then you can enter the trade when a new candle appears. Please don't forget to follow your money management plan. MT4 Version Support/Resistance Breakout MT4 :   https:/
Super Signal – Skyblade Edition Professional No-Repaint / No-Lag Trend Signal System with Exceptional Win Rate | For MT4 / MT5 Core Features: Super Signal – Skyblade Edition is a smart signal system designed specifically for trend trading. It applies a multi-layered confirmation mechanism to detect only strong, directional moves supported by real momentum. This system does   not attempt to predict tops or bottoms . It only triggers signals when all three of the following conditions are met: Clea
TrendMaestro5
Stefano Frisetti
note: this indicator is for METATRADER4, if you want the version for METATRADER5 this is the link:  https://www.mql5.com/it/market/product/108106 TRENDMAESTRO ver 2.5 TRENDMAESTRO recognizes a new TREND from the start, he never makes mistakes. The certainty of identifying a new TREND is priceless. DESCRIPTION TRENDMAESTRO identifies a new TREND in the bud, this indicator examines the volatility, volumes and momentum to identify the moment in which there is an explosion of one or more of these da
The " Dynamic Scalper System MT5 " indicator is designed for the scalping method of trading within trend waves. Tested on major currency pairs and gold, compatibility with other trading instruments is possible. Provides signals for short-term opening of positions along the trend with additional price movement support. The principle of the indicator. Large arrows determine the trend direction. An algorithm for generating signals for scalping in the form of small arrows operates within trend wav
##   ONLY GOLD ##   Тiльки Золото ## **Mercaria Professional Trading Zones - Complete Guide** ## **Mercaria Professional Trading Zones - Повний посібник** ### **How Mercaria Zones Work / Як працюють зони Mercaria** **English:** Mercaria Zones is an advanced trading indicator that identifies high-probability support and resistance areas using ZigZag extremes combined with mathematical zone calculations. The indicator works on multiple timeframes simultaneously, providing a comprehensive view
Get the FREE AUX Indicator and EA Support Direct Download — Click Here [ D.I.C.E ] The DICE Indicator Divergence in Chaos Environment is a specialized MT5 tool built for traders who apply Elliott Wave Theory within the framework of Trading Chaos techniques. It identifies hidden and regular divergences in price action, synchronized with the chaotic market environment described by Bill Williams. Key Features Elliott Wave–Aligned Divergence: Detects bullish and bearish divergences in harmony with
+++++++++++++++++++++++++++++++++++++++++++++++++++++++++++++++++++++++++++++++++++++++++++++++++ +++ Link to EURUSD Only Free Version -->  https://www.mql5.com/en/market/product/156904?source=Unknown +++++++++++++++++++++++++++++++++++++++++++++++++++++++++++++++++++++++++++++++++++++++++++++++++ Hallo Trader, This is a traditional GANN & FIBONACCI strategy based on detection of an impulsive move in the opposite direction. This is called a Breakout. At the moment of Breakout, the indicator draw
Frontier Pivots
Nestor Jose Mendez Boza
FRONTIER PIVOTS - Geometric Levels Indicator This indicator plots support and resistance levels/ranges on the chart using mathematical calculations. It helps traders identify potential price reaction zones based on geometric patterns. Main Features: Automatically calculates and displays key price levels Plots both support and resistance lines Uses daily price data for level calculation Clean visual presentation with different colors for different level types No repainting - levels remain static
Introduction to X3 Chart Pattern Scanner X3 Cherart Pattern Scanner is the non-repainting and non-lagging indicator detecting X3 chart patterns including Harmonic pattern, Elliott Wave pattern, X3 patterns, and Japanese Candlestick patterns. Historical patterns match with signal patterns. Hence, you can readily develop the solid trading strategy in your chart. More importantly, this superb pattern scanner can detect the optimal pattern of its kind. In addition, you can switch on and off individu
Pantera Indicator
Temirlan Kdyrkhan
5 (1)
A tool for on-chart strategy backtesting and performance analysis. A utility for developing, debugging, and testing custom trading ideas and indicator functions. An indicator designed to quickly test trading concepts and visualize the effectiveness of different input parameters. An all-in-one sandbox for testing everything from simple crossovers to complex, multi-condition trading systems.
Get the FREE AUX Indicator, EA Support & Manual Guide please visit - https://www.mql5.com/en/blogs/post/763955 Spot the Trend. Read the Pattern. Time the Entry. 3 Steps in Under 30 Seconds! Trade effortlessly — no analysis required, Your smart assistant is ready to simplify your workflow No more chart overload. Trade with confidence using smart bias detection. Compatible with all currencies, crypto, stocks, metals, indices, and any timeframe. Just click and execute — it’s that simple. Deal for
Elliot Waves Analyzer Pro
Viktor Weidenthal
2.67 (3)
Elliot Waves Analyzer Pro calculates Elliot Waves to Help Identify Trend direction and Entry Levels. Mainly for Swing Trading Strategies. Usually one would open a Position in trend direction for Wave 3 or a Correction for Wave C . This Indicator draws Target Levels for the current and next wave. Most important Rules for Elliot Wave Analysis are verified by the Indicator.  The Pro version analyzes Multiple Timeframes and shows the Subwaves and Target-Levels.   For an Overview  " Elliot Waves Anal
Weis Wave with Alert MT5
Trade The Volume Waves Single Member P.C.
4.94 (17)
Rental/Lifetime Package Options and Privileges  Rent Monthly Six Months   Yearly/Lifetime Weis Wave with Speed with Alert+Speed Index x x x Manual  x x x Quick Set up Video x x x Blog x x x Lifetime Updates x x x Setup and Training Material x x Discord Access Channel "The SI traders"          x Rectangle Break Alert Tool      x How to trade with it:    http://www.tradethevolumewaves.com   ** If you purchase please contact me to setup your  : Training Room and  complete manual access.  Wei
The iChannels
BeeXXI Corporation
5 (2)
Ultra-fast recognition of parabolic channels (as well as linear, horizontal and wavy channels) throughout the depth of history, creating a hierarchy of channels. Required setting: Max bars in chart: Unlimited This indicator is designed primarily for algorithmic trading, but can also be used for manual trading.  This indicator will have a very active evolution in the near future and detailed descriptions on how to apply to create robots
TREND HARMONY MT5 – Multi Timeframe Trend and Phase and Pullback Level Visualizer indicator for Metatrader5 The TREND HARMONY indicator automates deep trend analysis and generates visualizations for you. Take control of your trades by eliminating uncertainty! Revolutionize your trading experience with precision and insight through the TREND HARMONY Multi Timeframe indicator – your ultimate MT5 trend visualization indicator. [  Features and Manual   | MT4 version |   All Products   ] Are you tir
[ MT4 Version ]  [ Kill Zones ]  [ SMT Divergences ] How to trade using Order Blocks:  Click here User Interface Performance:  During testing in the strategy tester, the UI may experience lag. Rest assured, this issue is specific to the testing environment and does not affect the indicator's performance in live trading. Elevate your trading strategy with the  Order Blocks ICT Multi TF  indicator, a cutting-edge tool designed to enhance your trading decisions through advanced order block analysis
Key level wedge pro MT5
Presley Annais Tatenda Meck
Its our anniversary! To give back enjoy this 60% discount for the next week (original price $239) We have combined all of our beloved indicators the likes of: Key level order block ,   Key level supply and demand ,   Key level liquidity grab   and   Key level wedge   into one single indicator and dashboard. Whats new Dashboard : There is an easy access dashboard for all your needs. Multi-timeframe button : There is now a multi-timeframe option for Order Blocks and Supply and demand zones, maki
WVAP Scalping
Domantas Juodenis
VWAP Scalping Pro – Advanced VWAP & Market Profile System Professional-Grade VWAP + Market Profile Technology for Precision Trading VWAP Scalping Pro is an advanced analytical tool that integrates Volume-Weighted Average Price (VWAP) analysis with professional Market Profile visualization. It provides traders with institutional-style insights into price structure, volume distribution, and session dynamics — ideal for scalping, intraday, and swing trading strategies. Key Features Triple VWAP St
Hello I Want to introduce The Forex Buy Sell Arrow Premium MT5 i recently release this premium indicator! its 1000% Non Repaint Indicator, It Work Perfectly Well,, i tested it day by day, Just mind blowing Result,  Including Powerful trend Algorithm! How It Work? well, it work market trend formula, when trend Bullish Or when trend Bearish,  Recommend Timeframe M30, H1 it work all timeframe, and all currency pair, 100% non repaint, How to take signal From Forex Buy Sell Arrow Premium Ind
Chanlun
Xiaonong Yu
The ChanLun or Chan theory is one of the most popular trading theories in China. But it seems like that it has little influence in western countries. Actually, the Chan Theory is based on a sophisticated mathematical model. The basic idea ChanLun is to simplify the bar chart by its model. With the help of ChanLun, a trader can analyze and predict the trend of future goods, stocks. In ChanLun, there are several basic elements called fractals, strokes, line segments and pivots . A trader should pa
Big Player Range
Thalles Nascimento De Carvalho
5 (3)
BigPlayerRange — Best Indicator for Micro Index and Micro Dollar | MT5 Unlock the power of BigPlayerRange , widely recognized as the best institutional indicator for the micro index and micro dollar on MetaTrader 5. This powerful tool highlights strategic zones of institutional activity, providing ultra-precise market structure insights. How It Works: BigPlayerRange draws two horizontal zones based on institutional volume action: Green Zone — Where institutional buyers defend the price.
Support Resistance Catcher Indicator Features and Explanation Overview: The Support Resistance Catcher is a custom MT5 indicator designed to identify and visualize supply (resistance) and demand (support) zones based on candlestick price action. It detects zones where price has reversed after rallies or drops, using wick rejections and clustering. The indicator draws horizontal rectangles for active and historical zones, with customizable colors, labels, and alerts. Key Features: 1. Zone Det
Enigma 112
issam rahhal sabour
Enigma 112 Indicator - User Manual Enigma 112 Indicator Complete User Manual - Ultimate Trading Solution Introduction The Enigma 112 is a comprehensive multi-timeframe trading indicator that combines advanced technical analysis concepts including Tesla 3-6-9 Gates, Huddleston Theory, PO3 Dealing Ranges, and sophisticated risk management systems. Tesla 3-6-9 Gates Based on Nikola Tesla's vortex mathematics for precise support and resistance levels Huddleston Theory Volume-based market
VTrende Pro
Andrii Diachenko
5 (1)
VTrende Pro - MTF indicator for trend trading with a display panel for MT5 *** Videos can be translated into any language using subtitles (video language - Russian) Although the signals of the VTrende Pro indicator can be used as signals of a full-fledged trading system, it is recommended to use them in conjunction with the Bill Williams TS. VTrende Pro is an extended version of the VTrende indicator. Difference between Pro version and VTrende: - Time zones - Signal V - signal 1-2 waves -    S
Market makers' tool. The indicator analyzes volume from every point and calculates exhaustion market levels for that volume. ( This is a manual indicator and contains features that may not supported by the MetaTrader current testing environment ) Meravith main lines: - Bullish volume exhaustion line - serves as a target. - Bearish volume exhaustion line - serve as a target. - A line indicating the market trend. It changes color depending on whether the market is bullish or bearish and serves
SYSTEM INTRODUCTION:   The Binary Options Conqueror System Is Specifically Designed For Binary Options Trading. Unlike Other Systems And Indicators That Were Adopted From Other Trading Environments For Binary Options. Little Wonder Why Many Of Such Systems Fail To Make Money . Many End Up Loosing Money For Their Users.     Forward Testing Of The System Has Shown Remarkable Results . The Results Of Forward Testing On Live Trading Account Is Consistent With The Results Obtained By Back Testing .
More from author
Canal H Pro
N'da Lemissa Kouame
English – Canal H Pro Name: Canal H Pro – Support, Resistance & Breakout Short Description: Premium indicator with three dynamic lines (high, low, median) . Perfect for Breakout, Range, and trend following. Full Description: Red (High) → dynamic resistance Blue (Low) → dynamic support Yellow (Median) → balance and trend filter Automatic BUY/SELL signals on chart Adjustable period and colors Works on all strategies and timeframes Canal H Pro – spot key zones and take positions fast.
NuageTrend Pro
N'da Lemissa Kouame
Nuage Trend Pro – Trend Tracking & Kijun Signals Nuage Trend Pro is an advanced indicator for MetaTrader 5 , designed to quickly identify strong market trends and pinpoint optimal entry points through Kijun crossovers. Transform your charts into clear visual maps to trade with accuracy and confidence . Key Features Automatic Kijun Cross Detection : Instantly highlights key moments when price crosses the base line. Dynamic Trend Cloud : Your chart comes alive with intuitive colors – green f
Weekly Levels Pro
N'da Lemissa Kouame
Description – Weekly Levels Pro Weekly Levels Pro – Key Weekly Levels is a simple yet powerful indicator for MetaTrader 5, designed to automatically display the four most important trading levels of each week: Weekly High → natural resistance level Weekly Low → natural support level Weekly Open → trend reference point Weekly Close → bullish or bearish strength indicator Key Features: Automatically updates at the start of each new week Clear and easy-to-read display directly on the char
Pin Bar Pro v1
N'da Lemissa Kouame
Pin Bar Pro v1.0 – MQL5 Indicator Description: Pin Bar Pro is a professional MetaTrader 5 indicator that automatically detects Pin Bars , a key candlestick pattern for anticipating market reversals. Signals are displayed as custom arrows directly on the chart: Blue arrow → Buy signal (bullish Pin Bar) Red arrow → Sell signal (bearish Pin Bar) Features: Automatic detection of Pin Bars Customizable visual arrows ( Arrow_Up_Code , Arrow_Down_Code ) Adjustable vertical offset ( Arrow_Offset_Pts ) W
Monthly Levels Pro
N'da Lemissa Kouame
ENGLISH – Monthly Levels Pro v1.0 The Ultimate Monthly Market Levels Indicator Master key market zones at a glance. Monthly Levels Pro helps you analyze long-term trends and spot essential support and resistance levels by automatically displaying the High, Low, Open, and Close of a monthly candle. Why Choose Monthly Levels Pro? Instant Analysis – See monthly levels immediately without checking candles manually. Smarter Trading – Spot reversal or breakout zones at a glance. Clear Visuals –
Indicator Monthly Levels + Pin Bar Pro Description The Monthly Levels + Pin Bar Pro indicator combines the power of monthly key levels (High, Low, Open, Close) with automatic detection of Price Action reversal patterns (Pin Bars) . Designed for technical and institutional traders, it helps anticipate market reaction zones and generates clear visual signals directly on the chart. Main Features Automatic monthly levels : High, Low, Open, Close. Pin Bar detection (bullish & bearish) in r
Yearly Levels Pro
N'da Lemissa Kouame
1️⃣ English – Yearly Levels Pro v1.0 Version: 1.0 Developer: KOUAME N'DA LEMISSA Platform: MetaTrader 5 (MT5) Type: Technical Indicator / Annual Price Levels Description: Yearly Levels Pro v1.0, developed by KOUAME N'DA LEMISSA, is a powerful indicator to quickly identify annual key price levels. It automatically calculates the Open, High, Low, and Close prices of a specific year and displays them on the chart with colored horizontal lines. Key Features: High (Red), Low (Blue), Open (Green), Cl
English Version Quarterly Levels Pro v1.0 – Commercial Notice Product Name: Quarterly Levels Pro v1.0 Developer: KOUAME N'DA LEMISSA Version: 1.0 Description: Quarterly Levels Pro , developed by KOUAME N'DA LEMISSA , is a professional indicator for MetaTrader 5 that automatically displays High, Low, Open, and Close levels of a quarterly period. It allows traders to clearly visualize key support and resistance zones on the chart, facilitating medium-term trading decisions. Main Features: Aut
English (Anglais) Description Multi-Timeframe Levels Pro v1.0 automatically plots key Daily, Monthly, Quarterly, and Yearly levels (High, Low, Open, Close) directly on your chart. These levels are essential for identifying strong supports, resistances, and breakout zones. Key Features Automatic display of Daily / Monthly / Quarterly / Yearly levels Clear and color-coded High, Low, Open, Close Customizable Shift to analyze past periods Works on all markets: Forex, Indices, Commodities, Stocks, Cr
Marubozu Pro MT5
N'da Lemissa Kouame
Commercial Description – Marubozu Pro (MT5) Description Marubozu Pro is a professional indicator for MetaTrader 5 that automatically detects Marubozu candles (bullish and bearish) directly on your chart. It helps traders identify strong market momentum where buyers or sellers take full control, by displaying clear visual arrows for buy and sell signals. This tool is designed to be simple, effective, and fast , perfect for manual trading or as a filter in automated strategies. Key Features
ETE Detector – Head & Shoulders Indicator Turn your charts into clear and actionable trading opportunities! About the Indicator The ETE Detector automatically identifies Head & Shoulders (H&S) and Inverse Head & Shoulders (IH&S) patterns — classic trend reversal formations. No more spending hours searching manually: your analysis becomes fast, accurate, and visual . What You Get Automatic detection of trend reversal patterns Colored arrows : green for buys (Inverse H&S), red for sell
ABCD Lemissa + Monthly Levels + PinBar + Marubozu Indicator Description This indicator combines multiple powerful tools to provide a complete market overview: ABCD Lemissa – Automatically detects ABCD structures with points A, B, C, and D , support/resistance zones, and buy/sell arrows. Monthly Levels – Displays High, Low, Open, Close levels of monthly candles for identifying key zones. PinBar & Marubozu – Detects PinBar candles (reversal signals) and Marubozu candles (strong trend candles) w
Order Block Pro MT5
N'da Lemissa Kouame
Order Block Pro (MQL5) – Version 1.0 Author: KOUAME N'DA LEMISSA Platform: MetaTrader 5 Description: Order Block Pro is an advanced indicator designed to automatically detect bullish and bearish Order Blocks on your chart. By analyzing consolidation candles followed by strong impulsive candles, this tool highlights key areas where price movements are likely to accelerate. This indicator is perfect for traders who want to: Identify precise entry and exit points. Detect dynamic support and resist
ETE Detector v4.0 (Head & Shoulders) Author: KOUAME N’DA LEMISSA Version: 4.0 Platform: MetaTrader 5 Indicator Type: Chart / Visual Trading Signals Overview The ETE Detector v4.0 is a technical indicator designed to automatically detect classic and inverse Head & Shoulders patterns (H&S) on MT5 charts. These patterns are widely used to anticipate trend reversals. With this tool, traders can: Detect sell signals (classic H&S) and buy signals (inverse H&S) with accuracy. Easily visualize patterns
Avis commercial – ETE DETECTOR POWER v5.0 (Head & Shoulders Pro) Détection automatique des motifs tête et épaules ETE DETECTOR POWER v5.0 est un outil professionnel conçu pour les traders qui souhaitent anticiper les retournements majeurs du marché en utilisant l'un des modèles graphiques les plus puissants : le Head & Shoulders (H&S) et sa variation inverse. Grâce à son système de gestion d'objets optimisé (MaxObjects) , l'indicateur reste fluide et lisible, même sur des graphiques chargés
Dynamique mensuelle des plages hautes et basses v1.0 Auteur : KOUAME N'DA LEMISSA Description : L' indicateur dynamique mensuel de fourchette haute et basse affiche les niveaux mensuels clés sur votre graphique grâce à des fonctionnalités avancées de suivi dynamique. Il permet aux traders de visualiser facilement les zones de support et de résistance mensuelles, ainsi que les zones où le prix tend à dépasser ou à tester ces niveaux, offrant ainsi des opportunités de trading précises. P
Monthly High & Low Dynamic Range + Liquidity Zones v1.2 Author: KOUAME N'DA LEMISSA Description: Transform your market analysis with this powerful indicator that combines: Key Monthly Levels: High, Low, Open, and Close to identify the most important support and resistance zones. Dynamic High/Low Range: Automatically tracks extreme price movements to detect significant market shifts. Liquidity Zones: Visual rectangles showing areas where liquidity is concentrated (Buy/Sell). The thickness and c
Nom du produit :   Booster Trading Pro Auteur :   KOUAME N'DA LEMISSA Plateforme :   MetaTrader 5 Type :   Indicateur technique multifonction Description Transformez votre analyse de marché avec   Booster Trading Pro   , l'indicateur tout-en-un qui combine : Niveaux mensuels clés :   haut, bas, ouverture et clôture pour identifier rapidement les zones de support et de résistance. Plage dynamique haute et basse :   suivez les mouvements de prix extrêmes au-dessus ou en dessous des niveaux me
StructureBlocksAuto + MensuelOU La puissance de la structure rencontre la précision mensuelle Description Fusion StructureBlocksAuto + MonthlyOR est un indicateur tout-en-un avancé combinant la détection de la structure du marché (swings automatiques, plus hauts/plus bas et blocs de structure) avec le système Monthly Open Range (MOR) . Il offre une combinaison professionnelle d'analyse de la structure institutionnelle et de niveaux clés mensuels pour vous aider à détecter les zones de tradi
Channel Ultima
N'da Lemissa Kouame
Channel Ultima – Indicateur Multi-Canal Dynamique Description courte Channel Ultima est un indicateur avancé qui trace automatiquement trois canaux dynamiques du marché. Il offre une lecture claire des zones de support, de résistance et d'équilibre , idéale pour les traders techniques et structurels. Présentation détaillée Channel Ultima détecte et affiche trois canaux indépendants associés sur les pivots majeurs et mineurs du marché. Chaque canal représente une zone de pression sur le p
Carte de liquidité institutionnelle Pro Voyez ce que voient les institutions — avant tout le monde Aperçu Institutional Liquidity Map Pro est un indicateur professionnel conçu pour cartographier les zones de liquidité institutionnelle à l'aide des niveaux mensuels les plus hauts et les plus bas . Il détecte automatiquement les zones de stop-hunt , les zones de retournement potentiel et les zones d'accumulation/distribution institutionnelles . L'indicateur suit dynamiquement jusqu'à trois ni
Filter:
No reviews
Reply to review