Fusion StructureBlocksAuto MonthlyOR

StructureBlocksAuto + MensuelOU

La puissance de la structure rencontre la précision mensuelle

📌 Description

Fusion StructureBlocksAuto + MonthlyOR est un indicateur tout-en-un avancé combinant la détection de la structure du marché (swings automatiques, plus hauts/plus bas et blocs de structure) avec le système Monthly Open Range (MOR) .
Il offre une combinaison professionnelle d'analyse de la structure institutionnelle et de niveaux clés mensuels pour vous aider à détecter les zones de trading à forte probabilité et les changements de momentum en temps réel.

Cet outil vous permet de :

  • Identifier automatiquement les zones de support/résistance (blocs de structure)

  • Visualisez la direction des tendances grâce aux connexions swing automatiques

  • Afficher les niveaux mensuels d'ouverture, de haut, de bas et de clôture

  • Détecter les niveaux de rupture de l'Open Range mensuel (zones de volatilité)

  • Combinez la structure du marché et le contexte mensuel pour une confirmation plus forte

🧩 Principales caractéristiques

✅ Détection automatique des zones de structure de support et de résistance
✅ Dessin dynamique des niveaux mensuels d'ouverture, de haut, de bas et de clôture
Génération de lignes de tendance entre les principaux points de swing
✅ Zones visuelles Open Range High & Low pour un suivi précoce de la dynamique
✅ Rendu fluide avec des zones semi-transparentes
✅ Optimisé pour aucun décalage et un recalcul minimal
✅ Fonctionne sur n'importe quelle période et instrument (Forex, Indices, Crypto, Métaux)

⚙️ Entrées personnalisables

🔹 Section Open Range mensuelle :

  • Ref_Timeframe → Période de référence (par défaut : MN1)

  • Ref_Shift → Décalage mensuel de la barre (0 = mois en cours)

🔹 Section StructureBlocksAuto :

  • LookbackBars → Nombre de barres analysées

  • SupportColor / ResistanceColor → Couleurs de zone

  • TrendUpColor / TrendDownColor → Couleurs de tendance

  • ZoneBorderWidth → Épaisseur de la bordure du rectangle

  • ZoneLengthBars → Longueur visuelle de la zone

  • Transparency → Niveau de transparence de la zone

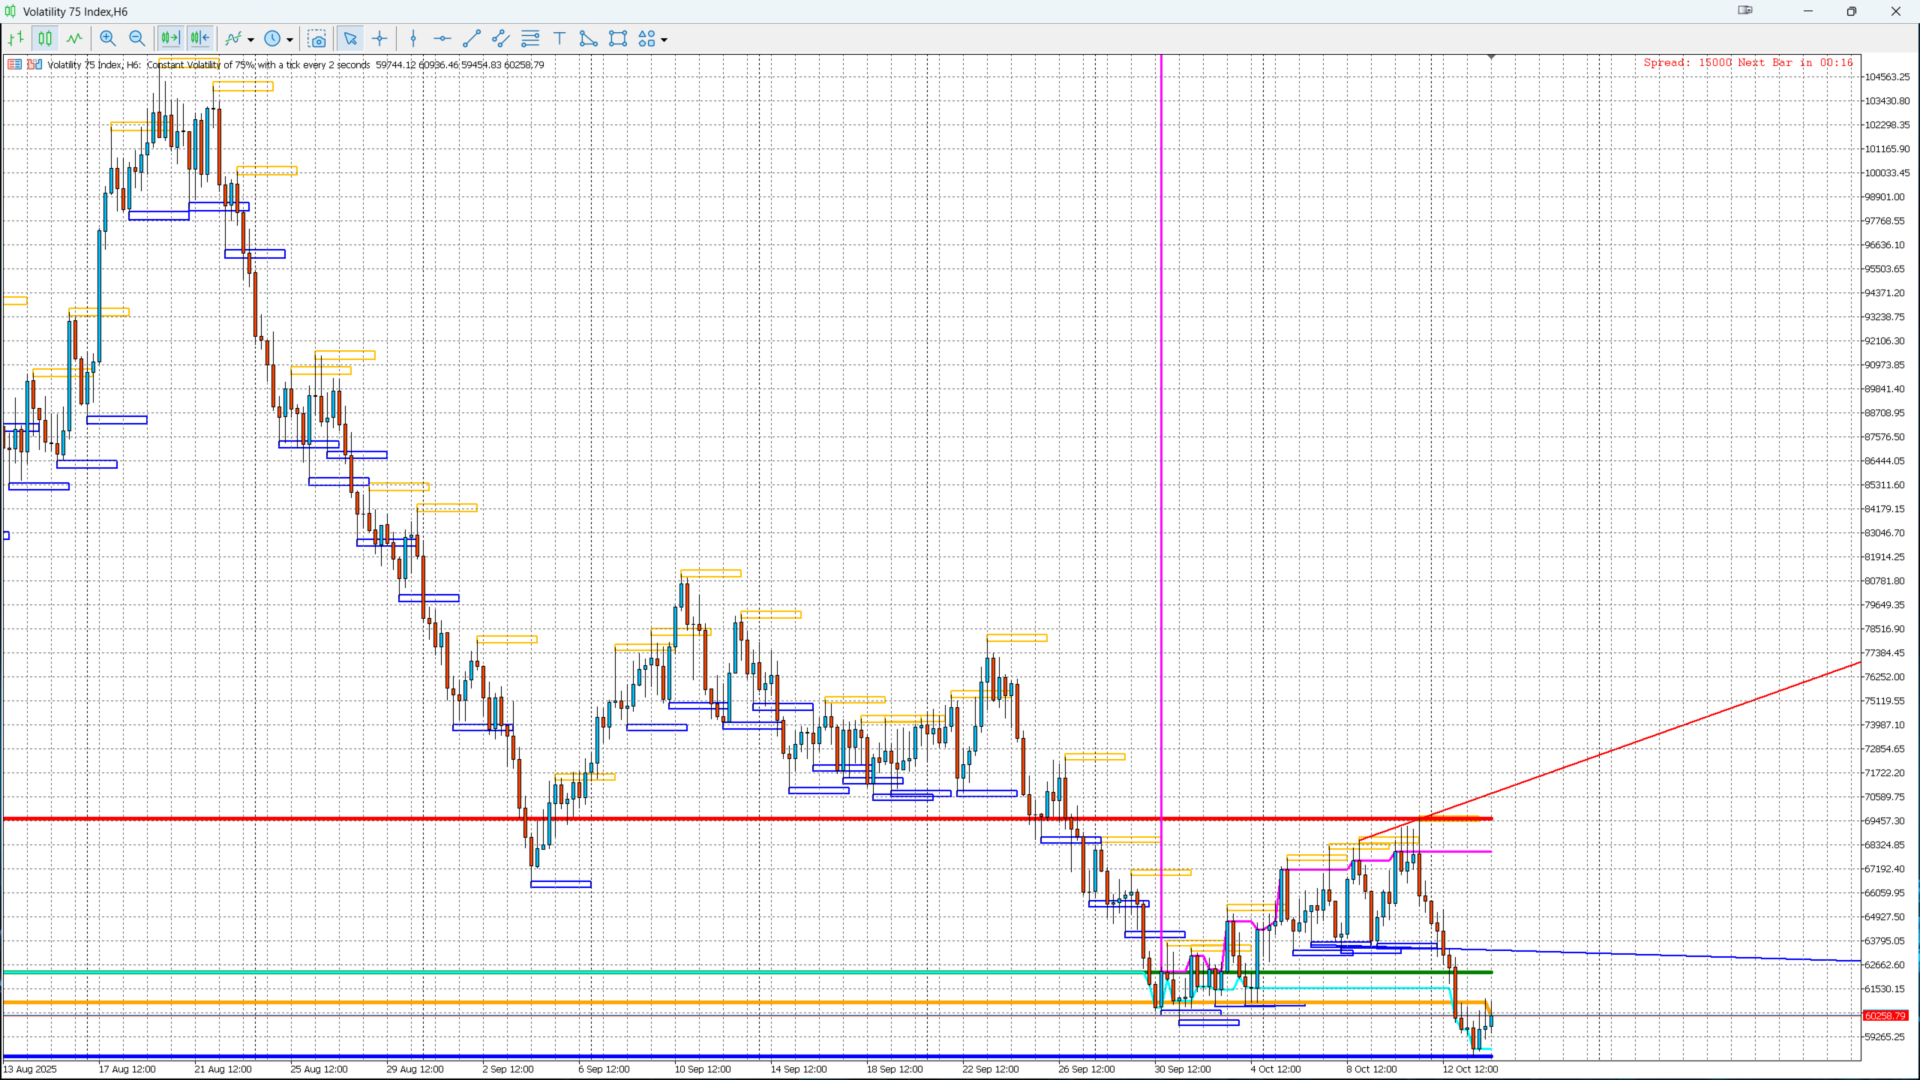
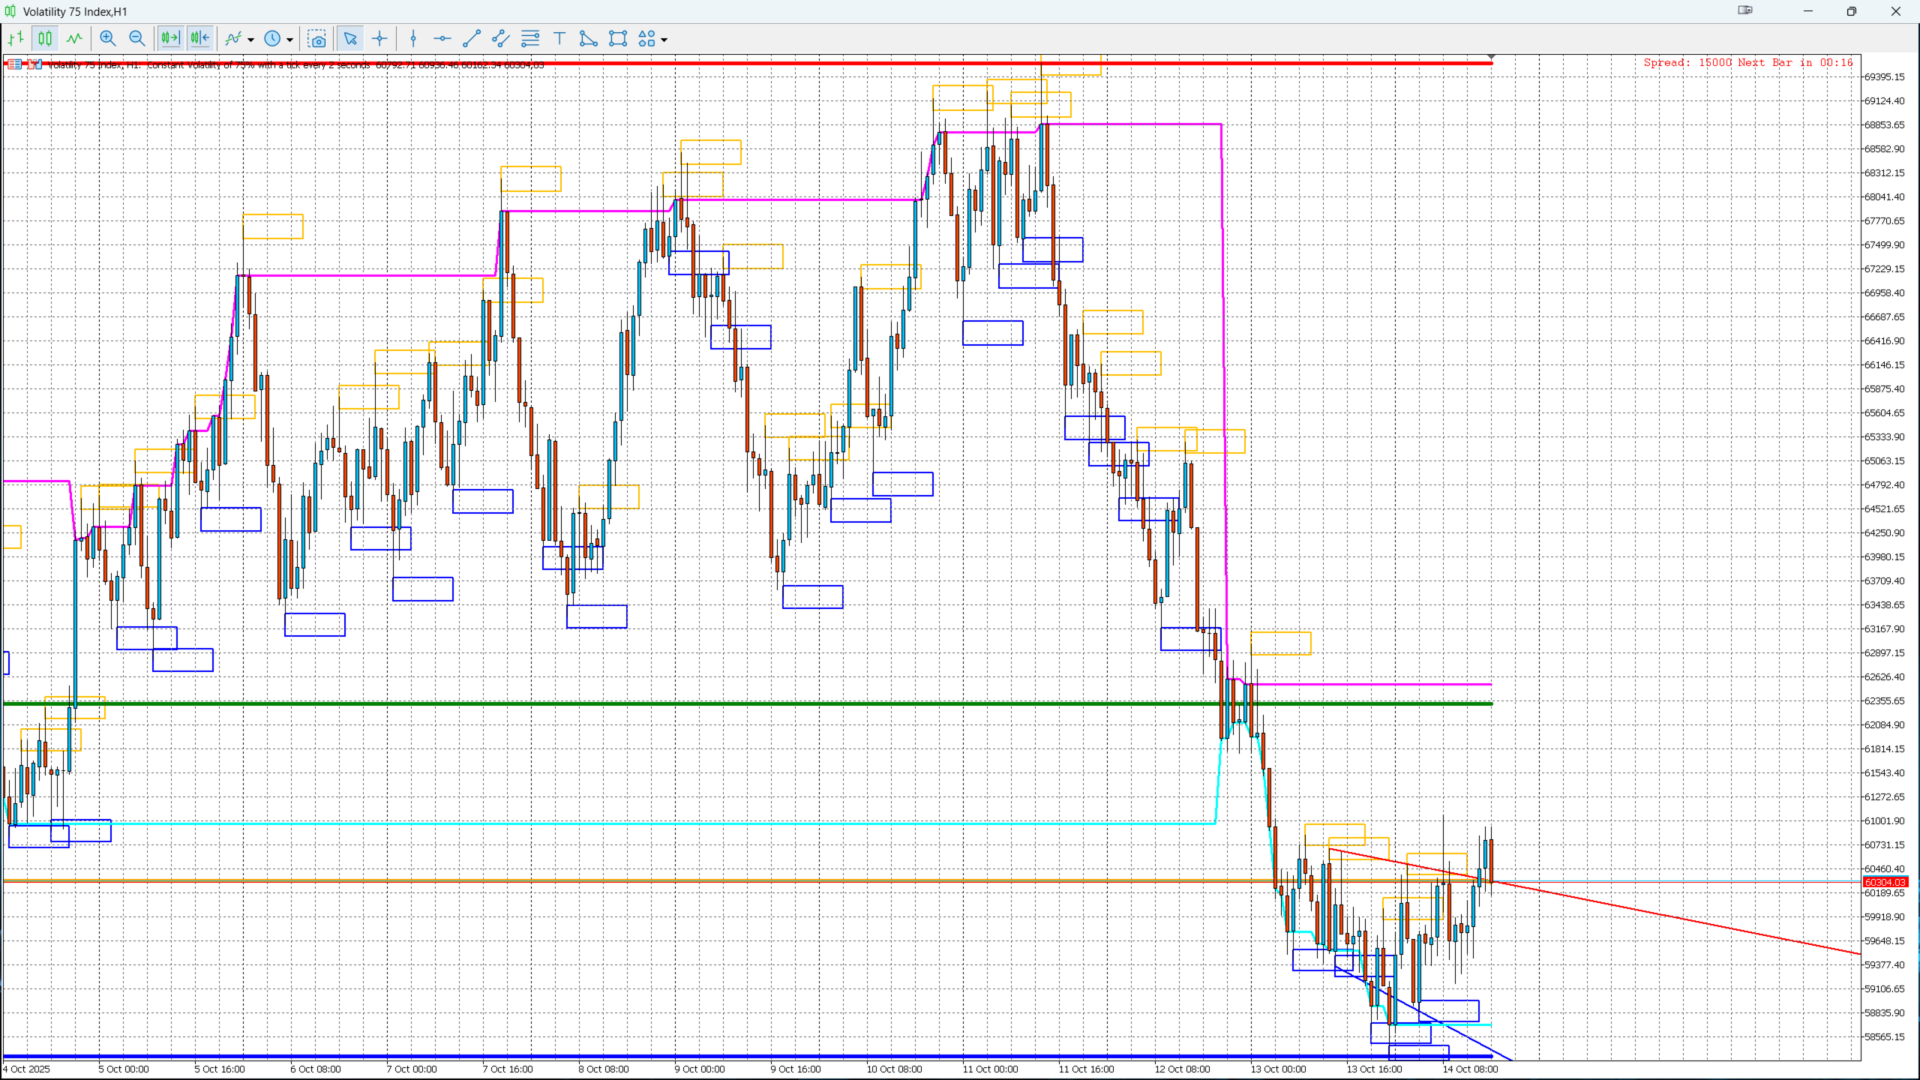
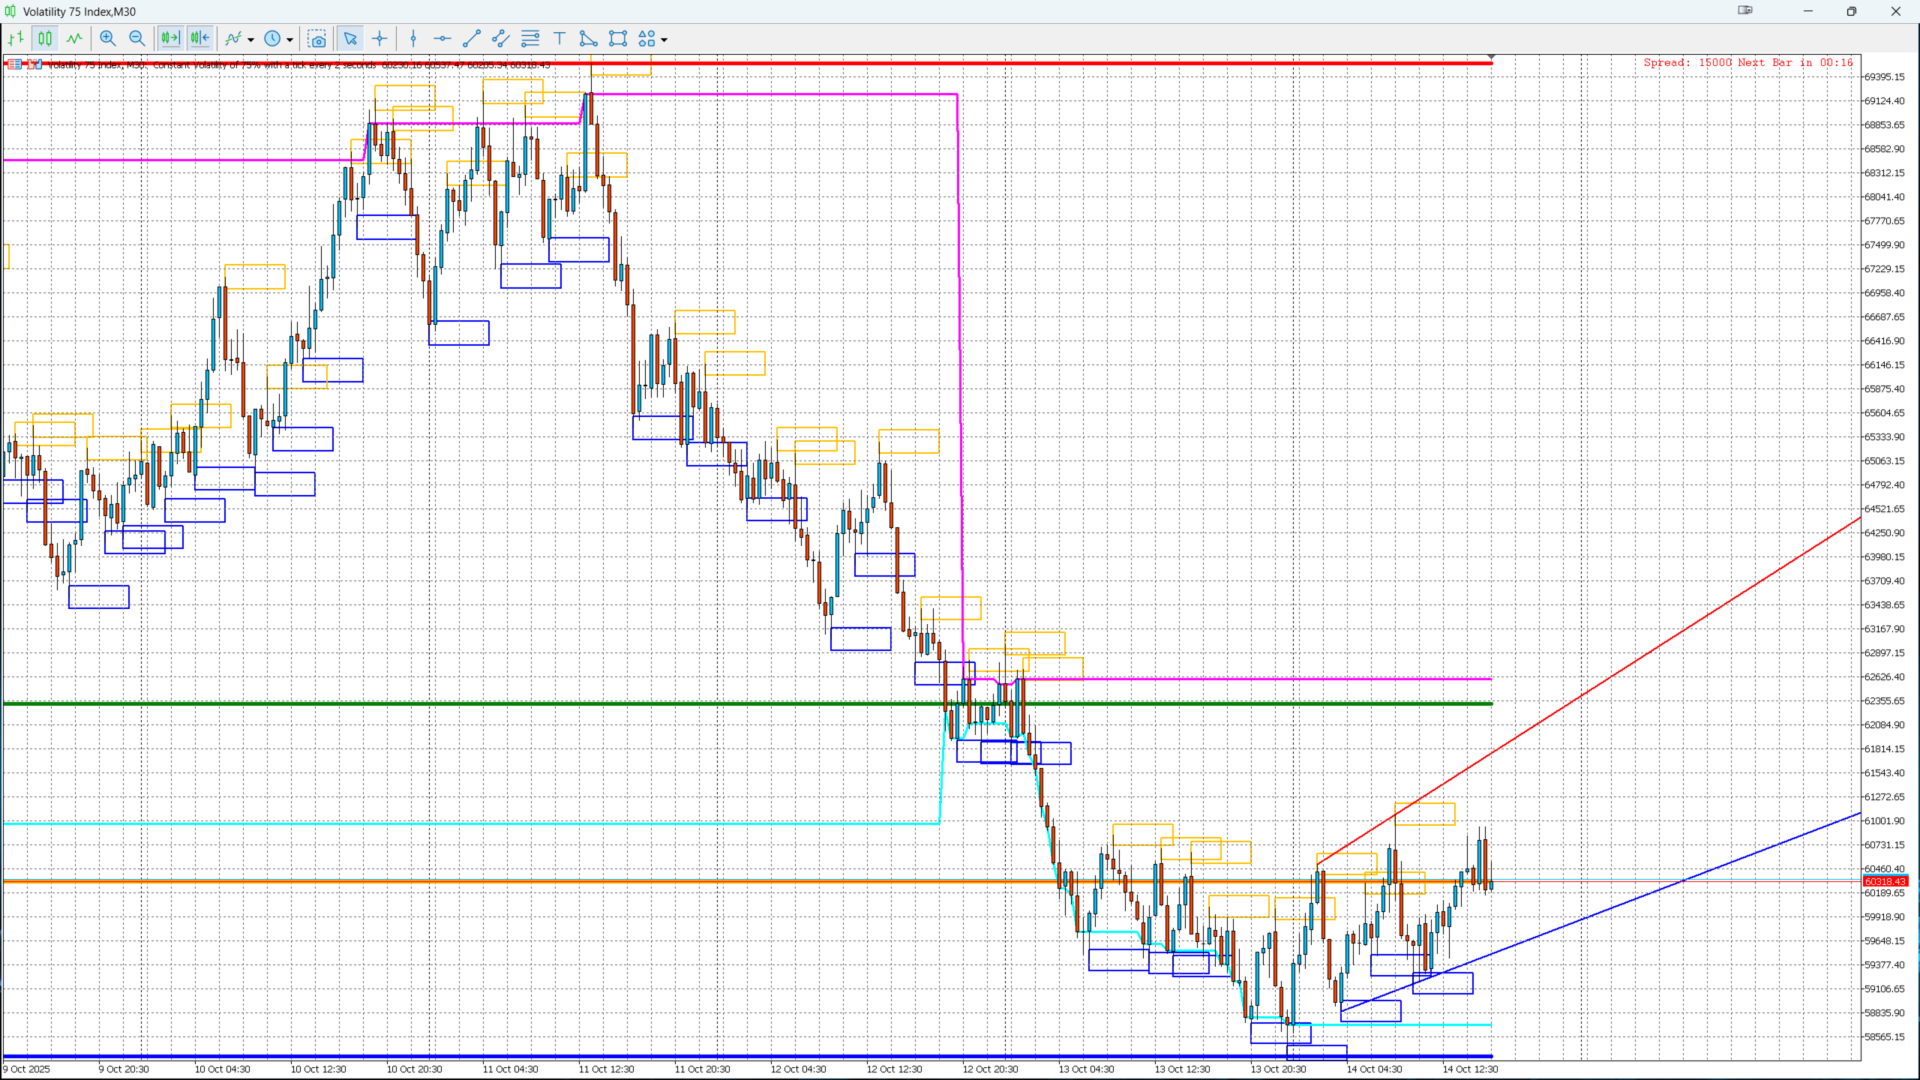
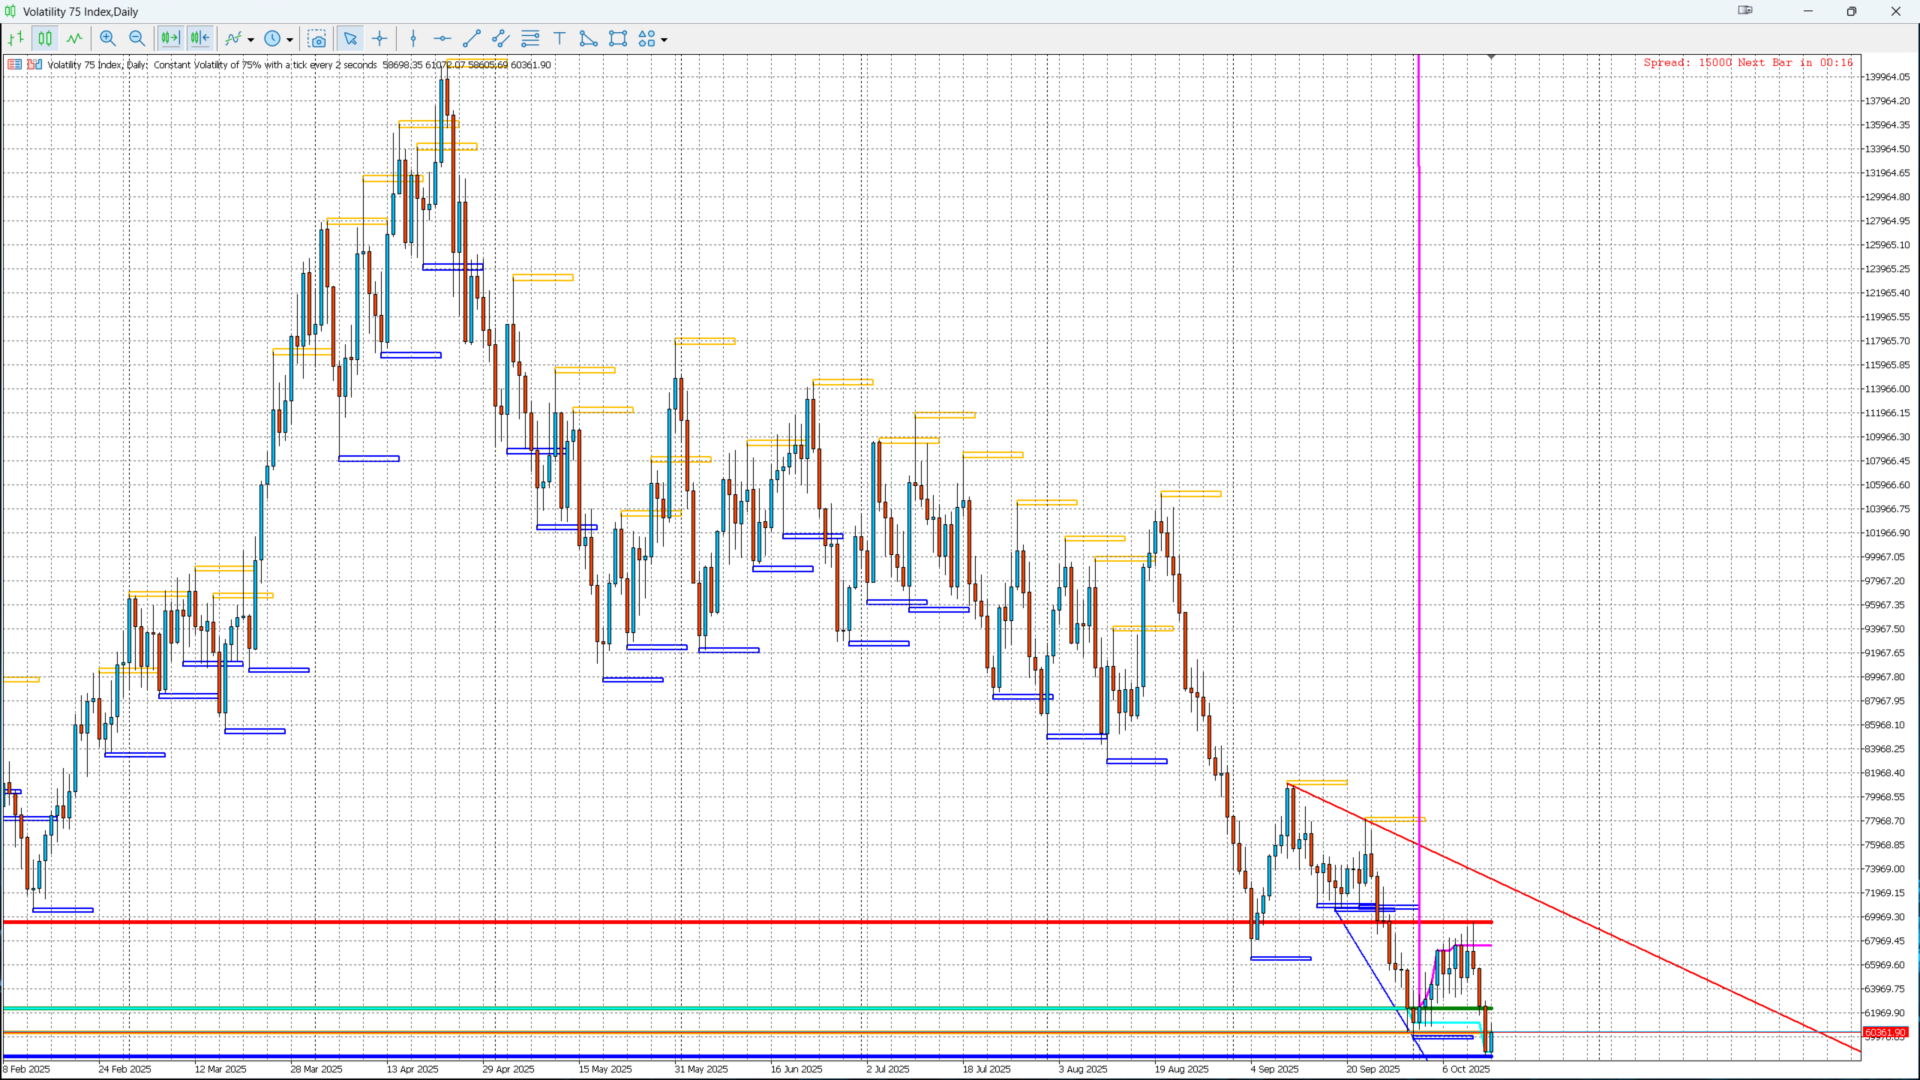
📊 Interprétation visuelle

🟥 Rectangles rouges → Zones de support (Swing Low détecté)
🟦 Rectangles bleus → Zones de résistance (Swing High détecté)
🟩 Ligne verte → Ouverture mensuelle
🟠 Ligne orange → Clôture mensuelle
🔴 Ligne rouge → Plus haut mensuel
🔵 Ligne bleue → Plus bas mensuel
🟣 Lignes magenta/cyan → Plus haut et plus bas de la plage d'ouverture mensuelle

💡 Conseils de trading

  • Combinez cet indicateur avec Price Action ou Ichimoku pour confirmation.

  • Soyez attentif aux cassures de l'Open Range mensuel : elles signalent souvent une forte dynamique.

  • Utilisez les zones de structure comme niveaux de prise de bénéfices ou d’accumulation/distribution .

  • Ideal for Swing Trading and Institutional Market Analysis.

🧭 Compatibility

  • ✅ MetaTrader 5 (MT5)

  • ✅ Works on all symbols: Forex, Indices, Crypto, Commodities

  • ✅ Works on all timeframes

  • ✅ Fully visual and user-friendly interface

👤 Author

KOUAME N’da LEMISSA
📅 Version: 1.1


Recommended products
Breakout Boxes with Volume Pressure This indicator automates the identification of key consolidation zones (Supply and Demand) based on Market Pivots and Volatility (ATR). Unlike standard support/resistance tools, this indicator provides a unique   Volume Pressure Analysis   inside every box, giving you insight into the battle between Buyers and Sellers before a breakout occurs. Key Features Automated Supply & Demand Zones:   Automatically detects significant Pivot Highs and Lows to draw dyna
Delta Profile Volume
Teresinha Moraes Correia
Technical Description of the Indicator – Delta Profile for MetaTrader 5 The Delta Profile is an indicator developed for MetaTrader 5 focused on detailed analysis of volume flow within a defined range of candles. It organizes and displays information about the imbalance of positive volumes (associated with upward movements) and negative volumes (associated with downward movements) at different price levels. The result is a clear view of the chart points where the highest concentration of trades o
Adjustable Consecutive Fractals  looks for 2 or more fractals in one direction and sends out a on screen alert, sound alert and push notification, for strong reversal points . Adjustable Consecutive Fractals, shows the fractals on chart along with a color changing text for buy and sell signals when one or more fractals appear on one side of price. Adjustable Consecutive Fractals is based Bill Williams Fractals . The standard Bill Williams fractals are set at a non adjustable 5 bars, BUT withe th
Weis Wave Scouter
Jean Carlos Martins Roso
Discover the power of advanced volume analysis with Weis Wave Scouter, a revolutionary indicator for MetaTrader 5 that combines the proven principles of the Wyckoff method and Volume Spread Analysis (VSA). Designed for traders seeking precision and depth in their operations, this indicator offers a tactical reading of the market through cumulative volume wave analysis, helping to identify key points of trend reversals and continuations. Weis Wave Scouter features a clear visual interface with co
KT Liquidity Sweep Filter MT5
KEENBASE SOFTWARE SOLUTIONS
The KT Liquidity Sweep Filter identifies and highlights critical liquidity sweep zones. It combines these zones with clear price-action rejections and an adaptive trend filter to generate precise buy and sell signals aligned with the market trend. It differentiates between major and minor liquidity sweep zones, marking major areas with big arrows and minor ones with smaller arrows for easy identification. Big Arrows: Indicate strong reversal signals originating from major liquidity sweep zones.
The new update makes this indicator a complete tool for studying, analyzing and operating probabilistic patterns. It includes: On-chart Multi-asset percentage monitor. Configurable martingales. Twenty-one pre-configured patterns, including Mhi patterns and C3. An advanced pattern editor to store up to 5 custom patterns. Backtest mode to test results with loss reports. Trend filter. Hit operational filter. Martingale Cycles option. Various types of strategies and alerts. Confluence between patter
Was: $249  Now: $99   Market Profile defines a number of day types that can help the trader to determine market behaviour. A key feature is the Value Area, representing the range of price action where 70% of trading took place. Understanding the Value Area can give traders valuable insight into market direction and establish the higher odds trade. It is an excellent addition to any system you may be using. Inspired by Jim Dalton’s book “Mind Over Markets”, this indicator is designed to suit the
WAPV Weis Wave Chart Forex
Eduardo Da Costa Custodio Santos
The Weis Wave Chart Forex for MT5 is a Price and Volume indicator. The Price and Volume reading was widely disseminated through Richard Demille Wyckoff based on the three laws created by him: Supply and Demand, Cause and Effect and Effort vs. Result. In 1900 R.Wyckoff already used the wave chart in his analyses. Many years later, around 1990, David Weis Automated R. Wyckoff's wave chart and today we bring you the evolution of David Weis' wave chart. It shows the amount of Volume and the amount o
STRICTLY FOR BOOM INDEX ONLY!!!!! Here I bring the Maximum Trend Arrows OT1.0 MT5 indicator. This indicator is made up of a combination of different trend indicators for entries and exits, for entries an orange arrow will paint on the chart below the current market and a red flag for closing of trades and it produces buy arrows only. When the orange arrow appears, it will appear along with it's sound to notify you. The 1H timeframe is recommended, don't use it anywhere else than on the 1H timefr
CvdDeltaVolumes
Parasbhai N Patel
Delta + CVD & CVD Candles Order-flow indicator combining Delta (Ask–Bid), Cumulative Volume Delta (CVD), and a unique CVD-based synthetic candle system. Shows buy/sell pressure, volume aggressiveness, and momentum shifts with optional Delta histogram, CVD line, and CVD+Delta combined candles. Useful for scalping, intraday trading, divergence detection, and understanding buyer/seller dominance. Overview The Delta + CVD & CVD Candles Indicator combines multiple order-flow tools into one clean
Do you use volume in your reading of the market? Certainly many traders use it, and do not imagine operating without it. The Color Histogram Volume Set indicator allows the user to choose the value that he considers interesting to monitor. When you pass this you will have visual confirmation and if you want you will also have the audible alert that is given by the indicator. Of course, there are other ways to try to find a high volume, such as assessing whether the volume is above av
+++++++++++++++++++++++++++++++++++++++++++++++++++++++++++++++++++++++++++++++++++++++++++++++++ +++ Link to EURUSD Only Free Version -->  https://www.mql5.com/en/market/product/156904?source=Unknown +++++++++++++++++++++++++++++++++++++++++++++++++++++++++++++++++++++++++++++++++++++++++++++++++ Hallo Trader, This is a traditional GANN & FIBONACCI strategy based on detection of an impulsive move in the opposite direction. This is called a Breakout. At the moment of Breakout, the indicator draw
Hello My Dear Friend, im introduce about Binary Option Premium V8 it work, all currency pair 1 minute time frame, 1-5 minute expire 100% non repaint, no delay signal Alright. This indicator works on MT5 and is very easy to use. When you receive a signal from it, you wait for that candle with the signal to close and you enter your trade at the beginning of the next new candle. A red arrow means sell and a green arrow means buy. for easy identification of trade signal. Are you okay with that?  W
Hurst buy and sell
Victor Alfonso Molina Botello
Hurst Buy and Sell This innovative indicator, inspired by xAI Grok intelligence, uses the Hurst exponent to identify the nature of the market and generate buy/sell signals. The EA for this indicator (Hurst Razer PRO EA MT5) is now available, you can see it by clicking here!  https://www.mql5.com/es/market/product/153441?source=Site+Profile+Seller  If you want more signals from the indicator, change the minimum number of bars between consecutive signals. The lower the value, the more signals it
FREE
Value Chart Candlesticks
Flavio Javier Jarabeck
4.69 (13)
The idea of a Value Chart indicator was presented in the very good book I read back in 2020 , " Dynamic Trading Indicators: Winning with Value Charts and Price Action Profile ", from the authors Mark Helweg and David Stendahl. The idea is simple and the result is pure genius: Present candlestick Price analysis in a detrended way! HOW TO READ THIS INDICATOR Look for Overbought and Oversold levels. Of course, you will need to test the settings a lot to find the "correct" one for your approach. It
FREE
ZigZagHHLL
Maksim Neimerik
A simple Zig Zag indicator with added visualization of Higher High, Lower High, Higher Low, Lower Low. This indicator will be very helpful when working with support/resistance levels. The ZigZag indicator is a fundamental tool that will significantly help you navigate complex situations in the financial markets. By providing a clear visual representation of price movements and trends, it simplifies the analysis process and improves decision-making capabilities. Its role in identifying trends and
Anchored VWAP with Alert MT5
Trade The Volume Waves Single Member P.C.
5 (1)
What is the Volume Weighted Average Price (VWAP)? The volume weighted average price (VWAP) is a trading benchmark used by traders that gives the average price an instrument has traded at throughout the day, based on both volume and price.  It is important because it provides traders with insight into both the trend and value of the instrument. What is the Difference between VWAP and AVWAP? While VWAP is having as starting point the beggining of the day,week,month etc. in the AVWAP you can pla
MercariaPattern1-2-3 відстежує рух ціни, знаходить трьоххвильові структури 1-2-3 та підсвічує момент, коли сценарій підтверджується пробоєм ключового рівня. MercariaPattern1-2-3 tracks price movement, detects three-leg 1-2-3 structures and highlights the moment when the scenario is confirmed by a key level breakout. Індикатор збирає локальні свінги в компактну фігуру 0–1–2–3 , чекає підтвердженого пробою та будує стрілку входу з готовими рівнями SL/TP. The indicator combines local swings into a
Your Trend Friend
Luigi Nunes Labigalini
5 (1)
The trend is your friend! Look at the color of the indicator and trade on that direction. It does not  repaint. After each candle is closed, that's the color of the trend. You can focus on shorter faster trends or major trends, just test what's most suitable for the symbol and timeframe you trade. Simply change the "Length" parameter and the indicator will automatically adapt. You can also change the color, thickness and style of the lines. Download and give it a try! There are big movements w
ACB Breakout Arrows MT5
KEENBASE SOFTWARE SOLUTIONS
5 (1)
The ACB Breakout Arrows indicator provides a crucial entry signal in the market by detecting a special breakout pattern. The indicator constantly scans the chart for a settling momentum in one direction and provide the accurate entry signal right before the major move. Get multi-symbol and multi-timeframe scanner from here - Scanner for ACB Breakout Arrows MT 5 Key features Stoploss   and Take Profit levels are provided by the indicator. Comes with a MTF Scanner dashboard which tracks the brea
SMC Liquidity
Alex Amuyunzu Raymond
SMC LIQUIDITY Advanced Institutional-Grade Smart Money and Liquidity Analysis Suite for MT5 SMC LIQUIDITY is a comprehensive institutional toolkit engineered for traders who require precise liquidity mapping, market structure intelligence, smart money concepts, and order flow awareness in a single integrated interface. It is designed for professional workflow, multi-timeframe clarity, and seamless execution in fast-moving conditions. This indicator combines several institutional methodologies in
This indicator has been developed to identify and display these trends quickly and easily, allowing you to see instantly, those currency pairs which are trending, and those which are not – and in all timeframes, with just one click. The 28 currency pairs are displayed as a fan as they sweep from strong to weak and back again, and this is why we call it the ‘currency array’. All 28 pairs are arrayed before you, giving an instant visual description of those pairs that are trending strongly, those
Precision Arrows
Nervada Emeule Adams
Precision Arrows – Smart Entry Signals with Built-In TP and SL Precision Arrows is a powerful trading indicator designed for traders who demand accuracy, clarity, and reliability. It identifies high-probability buy and sell signals with automatically generated Take Profit and Stop Loss levels, helping you trade with discipline and consistency across Forex, Indices, Crypto, and Synthetic Indices . The indicator combines precise signal detection, intelligent filtering, and a multi-timeframe dashbo
Contact me for instruction, any questions! - Lifetime update free - Non-repaint - I just sell my products in Elif Kaya Profile, any other websites are stolen old versions, So no any new updates or support. Introduction Breakout Trend Scanner indicator works based on the Elliott Wave in technical analysis describes price movements in the financial market that are related to changes in trader sentiment and psychology and finds end of movement and breakout trend. The Elliott Wave pattern that is f
Daily & Composite Volume Profile   This is a professional-grade market profile tool designed for MetaTrader 5. It utilizes a   Dual-Profile System   to visualize supply, demand, and liquidity concentrations. Key Features Left Side: Daily Session Profiles Automatically identifies the start and end of every trading day. Generates a unique Volume Profile for each individual day. Allows you to see how value migrated from yesterday to today (e.g., Is today's volume higher or lower than yesterday?).
HLC bar MT5 Wyckoff
Eduardo Da Costa Custodio Santos
The indicator "HLC_bar_MT5 Wyckoff" for MT5 has been created to facilitate analysis at trade time. The HLC Bar was used by Richard Wyckoff and is currently widely used in "VSA" operations. Wyckoff found that using High, Low, and Close made the graph much cleaner and easier to analyze. The Indicator "HLC_bar_MT5 Wyckoff" allows: # Change the bar width; # Leave the bar the same color; # And highlight the bar that opened and closed at the same price. Colors and width is easily modified in settings
Owl Smart Levels MT5
Sergey Ermolov
4.03 (32)
MT4 version  |   FAQ The Owl Smart Levels Indicator is a complete trading system within the one indicator that includes such popular market analysis tools as Bill Williams' advanced fractals , Valable ZigZag which builds the correct wave structure of the market, and Fibonacci levels which mark the exact levels of entry into the market and places to take profits. Detailed description of the strategy Instructions for working with the indicator Advisor-assistant in trading Owl Helper Private User
Visual Heatmap Book Analyzer
Alexandre Moraes De Souza Lima
Visual Heatmap Book Analyser This indicator monitors the market liquidity and generates colors based on order patterns, quantities, and renewal activities in the book. This allows you to visualize the order flow and identify areas of high and low liquidity and activity. The indicator uses machine learning techniques to analyze the order behavior in the book, enabling it to detect patterns and trends in orders, allowing you to make informed decisions about your trading operations. The color pale
Range Directional Force Indicator – Designed for You to Optimize! The Range Directional Force Indicator is a cutting-edge tool designed to empower traders by visualizing market dynamics and directional strength. Built to offer insights into market trends and reversals, this indicator is an invaluable asset for traders seeking precision in their strategies. However, it is important to note that this indicator is not optimized, leaving room for you to tailor it to your unique trading preferences.
The SMC Venom Model BPR indicator is a professional tool for traders working within the Smart Money (SMC) concept. It automatically identifies two key patterns on the price chart: FVG   (Fair Value Gap) is a combination of three candles, in which there is a gap between the first and third candles. It forms a zone between levels where there is no volume support, which often leads to a price correction. BPR   (Balanced Price Range) is a combination of two FVG patterns that form a “bridge” - a zon
Buyers of this product also purchase
SynaptixQuant Dominance Matrix
Devie Arevalo Montemayor
5 (1)
SynaptixQuant Dominance Matrix: Institutional-Grade Market State Extraction Engineered for traders who require a data-driven view of market behaviour beyond surface-level indicators. The Synaptix Quant (SQ) Dominance Matrix is not a conventional currency strength display. Behind its intentionally streamlined interface runs a sophisticated analytical architecture designed to quantify market conditions with precision. Every output is generated through layered signal processing built to identify d
How many times have you bought a trading indicator with great back-tests, live account performance proof with fantastic numbers and stats all over the place but after using it, you end up blowing your account? You shouldn't trust a signal by itself, you need to know why it appeared in the first place, and that's what RelicusRoad Pro does best! User Manual + Strategies + Training Videos + Private Group with VIP Access + Mobile Version Available A New Way To Look At The Market RelicusRoad is the
AriX
Temirlan Kdyrkhan
1 (4)
AriX Indicator for MT5 A powerful trend-following and signal-evaluation tool AriX is a custom MT5 indicator that combines Moving Averages and ATR-based risk/reward logic to generate clear buy/sell signals. It visualizes dynamic SL/TP levels, evaluates past trade outcomes, and displays win/loss statistics in a clean on-chart panel. Key features include: Buy/Sell signals based on MA crossovers ATR-based SL/TP1/TP2/TP3 levels with visual lines and labels Signal outcome tracking with real-time stat
ARICoins
Temirlan Kdyrkhan
ARICoin is a powerful trading companion designed to generate high-probability entry signals with dynamic TP/SL/DP levels based on volatility. Built-in performance tracking shows win/loss stats, PP1/PP2 hits, and success rates all updated live. Key Features: Buy/Sell signals with adaptive volatility bands Real-time TP/SL/DP levels based on ATR Built-in MA Filter with optional ATR/StdDev volatility Performance stats panel (Success, Profit/Loss, PP1/PP2) Alerts via popup, sound, push, or email Cust
This indicator uses support and resistance, volume and some special formula to calculate the volume to filter the candles. If the volume reaches a specific value, And at the same time, Candle breaks the support/resistance line, There would be a signal and we can enter the market. Signals appear when the current candle closes. then you can enter the trade when a new candle appears. Please don't forget to follow your money management plan. MT4 Version Support/Resistance Breakout MT4 :   https:/
Super Signal – Skyblade Edition Professional No-Repaint / No-Lag Trend Signal System with Exceptional Win Rate | For MT4 / MT5 Core Features: Super Signal – Skyblade Edition is a smart signal system designed specifically for trend trading. It applies a multi-layered confirmation mechanism to detect only strong, directional moves supported by real momentum. This system does   not attempt to predict tops or bottoms . It only triggers signals when all three of the following conditions are met: Clea
TrendMaestro5
Stefano Frisetti
note: this indicator is for METATRADER4, if you want the version for METATRADER5 this is the link:  https://www.mql5.com/it/market/product/108106 TRENDMAESTRO ver 2.5 TRENDMAESTRO recognizes a new TREND from the start, he never makes mistakes. The certainty of identifying a new TREND is priceless. DESCRIPTION TRENDMAESTRO identifies a new TREND in the bud, this indicator examines the volatility, volumes and momentum to identify the moment in which there is an explosion of one or more of these da
The " Dynamic Scalper System MT5 " indicator is designed for the scalping method of trading within trend waves. Tested on major currency pairs and gold, compatibility with other trading instruments is possible. Provides signals for short-term opening of positions along the trend with additional price movement support. The principle of the indicator. Large arrows determine the trend direction. An algorithm for generating signals for scalping in the form of small arrows operates within trend wav
##   ONLY GOLD ##   Тiльки Золото ## **Mercaria Professional Trading Zones - Complete Guide** ## **Mercaria Professional Trading Zones - Повний посібник** ### **How Mercaria Zones Work / Як працюють зони Mercaria** **English:** Mercaria Zones is an advanced trading indicator that identifies high-probability support and resistance areas using ZigZag extremes combined with mathematical zone calculations. The indicator works on multiple timeframes simultaneously, providing a comprehensive view
Get the FREE AUX Indicator and EA Support Direct Download — Click Here [ D.I.C.E ] The DICE Indicator Divergence in Chaos Environment is a specialized MT5 tool built for traders who apply Elliott Wave Theory within the framework of Trading Chaos techniques. It identifies hidden and regular divergences in price action, synchronized with the chaotic market environment described by Bill Williams. Key Features Elliott Wave–Aligned Divergence: Detects bullish and bearish divergences in harmony with
Frontier Pivots
Nestor Jose Mendez Boza
FRONTIER PIVOTS - Geometric Levels Indicator This indicator plots support and resistance levels/ranges on the chart using mathematical calculations. It helps traders identify potential price reaction zones based on geometric patterns. Main Features: Automatically calculates and displays key price levels Plots both support and resistance lines Uses daily price data for level calculation Clean visual presentation with different colors for different level types No repainting - levels remain static
Introduction to X3 Chart Pattern Scanner X3 Cherart Pattern Scanner is the non-repainting and non-lagging indicator detecting X3 chart patterns including Harmonic pattern, Elliott Wave pattern, X3 patterns, and Japanese Candlestick patterns. Historical patterns match with signal patterns. Hence, you can readily develop the solid trading strategy in your chart. More importantly, this superb pattern scanner can detect the optimal pattern of its kind. In addition, you can switch on and off individu
Pantera Indicator
Temirlan Kdyrkhan
5 (1)
A tool for on-chart strategy backtesting and performance analysis. A utility for developing, debugging, and testing custom trading ideas and indicator functions. An indicator designed to quickly test trading concepts and visualize the effectiveness of different input parameters. An all-in-one sandbox for testing everything from simple crossovers to complex, multi-condition trading systems.
Get the FREE AUX Indicator, EA Support & Manual Guide please visit - https://www.mql5.com/en/blogs/post/763955 Spot the Trend. Read the Pattern. Time the Entry. 3 Steps in Under 30 Seconds! Trade effortlessly — no analysis required, Your smart assistant is ready to simplify your workflow No more chart overload. Trade with confidence using smart bias detection. Compatible with all currencies, crypto, stocks, metals, indices, and any timeframe. Just click and execute — it’s that simple. Deal for
Elliot Waves Analyzer Pro
Viktor Weidenthal
2.67 (3)
Elliot Waves Analyzer Pro calculates Elliot Waves to Help Identify Trend direction and Entry Levels. Mainly for Swing Trading Strategies. Usually one would open a Position in trend direction for Wave 3 or a Correction for Wave C . This Indicator draws Target Levels for the current and next wave. Most important Rules for Elliot Wave Analysis are verified by the Indicator.  The Pro version analyzes Multiple Timeframes and shows the Subwaves and Target-Levels.   For an Overview  " Elliot Waves Anal
Weis Wave with Alert MT5
Trade The Volume Waves Single Member P.C.
4.94 (17)
Rental/Lifetime Package Options and Privileges  Rent Monthly Six Months   Yearly/Lifetime Weis Wave with Speed with Alert+Speed Index x x x Manual  x x x Quick Set up Video x x x Blog x x x Lifetime Updates x x x Setup and Training Material x x Discord Access Channel "The SI traders"          x Rectangle Break Alert Tool      x How to trade with it:    http://www.tradethevolumewaves.com   ** If you purchase please contact me to setup your  : Training Room and  complete manual access.  Wei
The iChannels
BeeXXI Corporation
5 (2)
Ultra-fast recognition of parabolic channels (as well as linear, horizontal and wavy channels) throughout the depth of history, creating a hierarchy of channels. Required setting: Max bars in chart: Unlimited This indicator is designed primarily for algorithmic trading, but can also be used for manual trading.  This indicator will have a very active evolution in the near future and detailed descriptions on how to apply to create robots
TREND HARMONY MT5 – Multi Timeframe Trend and Phase and Pullback Level Visualizer indicator for Metatrader5 The TREND HARMONY indicator automates deep trend analysis and generates visualizations for you. Take control of your trades by eliminating uncertainty! Revolutionize your trading experience with precision and insight through the TREND HARMONY Multi Timeframe indicator – your ultimate MT5 trend visualization indicator. [  Features and Manual   | MT4 version |   All Products   ] Are you tir
[ MT4 Version ]  [ Kill Zones ]  [ SMT Divergences ] How to trade using Order Blocks:  Click here User Interface Performance:  During testing in the strategy tester, the UI may experience lag. Rest assured, this issue is specific to the testing environment and does not affect the indicator's performance in live trading. Elevate your trading strategy with the  Order Blocks ICT Multi TF  indicator, a cutting-edge tool designed to enhance your trading decisions through advanced order block analysis
Key level wedge pro MT5
Presley Annais Tatenda Meck
Its our anniversary! To give back enjoy this 60% discount for the next week (original price $239) We have combined all of our beloved indicators the likes of: Key level order block ,   Key level supply and demand ,   Key level liquidity grab   and   Key level wedge   into one single indicator and dashboard. Whats new Dashboard : There is an easy access dashboard for all your needs. Multi-timeframe button : There is now a multi-timeframe option for Order Blocks and Supply and demand zones, maki
WVAP Scalping
Domantas Juodenis
VWAP Scalping Pro – Advanced VWAP & Market Profile System Professional-Grade VWAP + Market Profile Technology for Precision Trading VWAP Scalping Pro is an advanced analytical tool that integrates Volume-Weighted Average Price (VWAP) analysis with professional Market Profile visualization. It provides traders with institutional-style insights into price structure, volume distribution, and session dynamics — ideal for scalping, intraday, and swing trading strategies. Key Features Triple VWAP St
Hello I Want to introduce The Forex Buy Sell Arrow Premium MT5 i recently release this premium indicator! its 1000% Non Repaint Indicator, It Work Perfectly Well,, i tested it day by day, Just mind blowing Result,  Including Powerful trend Algorithm! How It Work? well, it work market trend formula, when trend Bullish Or when trend Bearish,  Recommend Timeframe M30, H1 it work all timeframe, and all currency pair, 100% non repaint, How to take signal From Forex Buy Sell Arrow Premium Ind
Chanlun
Xiaonong Yu
The ChanLun or Chan theory is one of the most popular trading theories in China. But it seems like that it has little influence in western countries. Actually, the Chan Theory is based on a sophisticated mathematical model. The basic idea ChanLun is to simplify the bar chart by its model. With the help of ChanLun, a trader can analyze and predict the trend of future goods, stocks. In ChanLun, there are several basic elements called fractals, strokes, line segments and pivots . A trader should pa
Big Player Range
Thalles Nascimento De Carvalho
5 (3)
BigPlayerRange — Best Indicator for Micro Index and Micro Dollar | MT5 Unlock the power of BigPlayerRange , widely recognized as the best institutional indicator for the micro index and micro dollar on MetaTrader 5. This powerful tool highlights strategic zones of institutional activity, providing ultra-precise market structure insights. How It Works: BigPlayerRange draws two horizontal zones based on institutional volume action: Green Zone — Where institutional buyers defend the price.
Support Resistance Catcher Indicator Features and Explanation Overview: The Support Resistance Catcher is a custom MT5 indicator designed to identify and visualize supply (resistance) and demand (support) zones based on candlestick price action. It detects zones where price has reversed after rallies or drops, using wick rejections and clustering. The indicator draws horizontal rectangles for active and historical zones, with customizable colors, labels, and alerts. Key Features: 1. Zone Det
Enigma 112
issam rahhal sabour
Enigma 112 Indicator - User Manual Enigma 112 Indicator Complete User Manual - Ultimate Trading Solution Introduction The Enigma 112 is a comprehensive multi-timeframe trading indicator that combines advanced technical analysis concepts including Tesla 3-6-9 Gates, Huddleston Theory, PO3 Dealing Ranges, and sophisticated risk management systems. Tesla 3-6-9 Gates Based on Nikola Tesla's vortex mathematics for precise support and resistance levels Huddleston Theory Volume-based market
VTrende Pro
Andrii Diachenko
5 (1)
VTrende Pro - MTF indicator for trend trading with a display panel for MT5 *** Videos can be translated into any language using subtitles (video language - Russian) Although the signals of the VTrende Pro indicator can be used as signals of a full-fledged trading system, it is recommended to use them in conjunction with the Bill Williams TS. VTrende Pro is an extended version of the VTrende indicator. Difference between Pro version and VTrende: - Time zones - Signal V - signal 1-2 waves -    S
Market makers' tool. The indicator analyzes volume from every point and calculates exhaustion market levels for that volume. ( This is a manual indicator and contains features that may not supported by the MetaTrader current testing environment ) Meravith main lines: - Bullish volume exhaustion line - serves as a target. - Bearish volume exhaustion line - serve as a target. - A line indicating the market trend. It changes color depending on whether the market is bullish or bearish and serves
SYSTEM INTRODUCTION:   The Binary Options Conqueror System Is Specifically Designed For Binary Options Trading. Unlike Other Systems And Indicators That Were Adopted From Other Trading Environments For Binary Options. Little Wonder Why Many Of Such Systems Fail To Make Money . Many End Up Loosing Money For Their Users.     Forward Testing Of The System Has Shown Remarkable Results . The Results Of Forward Testing On Live Trading Account Is Consistent With The Results Obtained By Back Testing .
ChartMaster Heikin Ashi with Pivot Indicator for MT5 Take your trading to the next level with ChartMaster Heikin Ashi with Pivot Indicator , a powerful tool that combines the clarity of Heikin Ashi candles with advanced pivot-point analysis. This indicator is designed for traders who want to identify market trends, reversals, and key support/resistance zones with precision. Key Features: Heikin Ashi Visualization – Smooths out market noise for cleaner trend identification. Automatic Pivot
More from author
Canal H Pro
N'da Lemissa Kouame
English – Canal H Pro Name: Canal H Pro – Support, Resistance & Breakout Short Description: Premium indicator with three dynamic lines (high, low, median) . Perfect for Breakout, Range, and trend following. Full Description: Red (High) → dynamic resistance Blue (Low) → dynamic support Yellow (Median) → balance and trend filter Automatic BUY/SELL signals on chart Adjustable period and colors Works on all strategies and timeframes Canal H Pro – spot key zones and take positions fast.
NuageTrend Pro
N'da Lemissa Kouame
Nuage Trend Pro – Trend Tracking & Kijun Signals Nuage Trend Pro is an advanced indicator for MetaTrader 5 , designed to quickly identify strong market trends and pinpoint optimal entry points through Kijun crossovers. Transform your charts into clear visual maps to trade with accuracy and confidence . Key Features Automatic Kijun Cross Detection : Instantly highlights key moments when price crosses the base line. Dynamic Trend Cloud : Your chart comes alive with intuitive colors – green f
Weekly Levels Pro
N'da Lemissa Kouame
Description – Weekly Levels Pro Weekly Levels Pro – Key Weekly Levels is a simple yet powerful indicator for MetaTrader 5, designed to automatically display the four most important trading levels of each week: Weekly High → natural resistance level Weekly Low → natural support level Weekly Open → trend reference point Weekly Close → bullish or bearish strength indicator Key Features: Automatically updates at the start of each new week Clear and easy-to-read display directly on the char
Pin Bar Pro v1
N'da Lemissa Kouame
Pin Bar Pro v1.0 – MQL5 Indicator Description: Pin Bar Pro is a professional MetaTrader 5 indicator that automatically detects Pin Bars , a key candlestick pattern for anticipating market reversals. Signals are displayed as custom arrows directly on the chart: Blue arrow → Buy signal (bullish Pin Bar) Red arrow → Sell signal (bearish Pin Bar) Features: Automatic detection of Pin Bars Customizable visual arrows ( Arrow_Up_Code , Arrow_Down_Code ) Adjustable vertical offset ( Arrow_Offset_Pts ) W
Monthly Levels Pro
N'da Lemissa Kouame
ENGLISH – Monthly Levels Pro v1.0 The Ultimate Monthly Market Levels Indicator Master key market zones at a glance. Monthly Levels Pro helps you analyze long-term trends and spot essential support and resistance levels by automatically displaying the High, Low, Open, and Close of a monthly candle. Why Choose Monthly Levels Pro? Instant Analysis – See monthly levels immediately without checking candles manually. Smarter Trading – Spot reversal or breakout zones at a glance. Clear Visuals –
Indicator Monthly Levels + Pin Bar Pro Description The Monthly Levels + Pin Bar Pro indicator combines the power of monthly key levels (High, Low, Open, Close) with automatic detection of Price Action reversal patterns (Pin Bars) . Designed for technical and institutional traders, it helps anticipate market reaction zones and generates clear visual signals directly on the chart. Main Features Automatic monthly levels : High, Low, Open, Close. Pin Bar detection (bullish & bearish) in r
Yearly Levels Pro
N'da Lemissa Kouame
1️⃣ English – Yearly Levels Pro v1.0 Version: 1.0 Developer: KOUAME N'DA LEMISSA Platform: MetaTrader 5 (MT5) Type: Technical Indicator / Annual Price Levels Description: Yearly Levels Pro v1.0, developed by KOUAME N'DA LEMISSA, is a powerful indicator to quickly identify annual key price levels. It automatically calculates the Open, High, Low, and Close prices of a specific year and displays them on the chart with colored horizontal lines. Key Features: High (Red), Low (Blue), Open (Green), Cl
English Version Quarterly Levels Pro v1.0 – Commercial Notice Product Name: Quarterly Levels Pro v1.0 Developer: KOUAME N'DA LEMISSA Version: 1.0 Description: Quarterly Levels Pro , developed by KOUAME N'DA LEMISSA , is a professional indicator for MetaTrader 5 that automatically displays High, Low, Open, and Close levels of a quarterly period. It allows traders to clearly visualize key support and resistance zones on the chart, facilitating medium-term trading decisions. Main Features: Aut
English (Anglais) Description Multi-Timeframe Levels Pro v1.0 automatically plots key Daily, Monthly, Quarterly, and Yearly levels (High, Low, Open, Close) directly on your chart. These levels are essential for identifying strong supports, resistances, and breakout zones. Key Features Automatic display of Daily / Monthly / Quarterly / Yearly levels Clear and color-coded High, Low, Open, Close Customizable Shift to analyze past periods Works on all markets: Forex, Indices, Commodities, Stocks, Cr
Marubozu Pro MT5
N'da Lemissa Kouame
Commercial Description – Marubozu Pro (MT5) Description Marubozu Pro is a professional indicator for MetaTrader 5 that automatically detects Marubozu candles (bullish and bearish) directly on your chart. It helps traders identify strong market momentum where buyers or sellers take full control, by displaying clear visual arrows for buy and sell signals. This tool is designed to be simple, effective, and fast , perfect for manual trading or as a filter in automated strategies. Key Features
ETE Detector – Head & Shoulders Indicator Turn your charts into clear and actionable trading opportunities! About the Indicator The ETE Detector automatically identifies Head & Shoulders (H&S) and Inverse Head & Shoulders (IH&S) patterns — classic trend reversal formations. No more spending hours searching manually: your analysis becomes fast, accurate, and visual . What You Get Automatic detection of trend reversal patterns Colored arrows : green for buys (Inverse H&S), red for sell
Fusion Monthly Levels + PinBar + Marubozu Description This unique indicator merges three powerful technical analysis tools into one: Monthly Levels (High, Low, Open, Close) – to identify key support and resistance zones. PinBar Detection – a reliable reversal candlestick pattern signaling price rejections. Marubozu Detection – strong trending candles that indicate directional momentum. Thanks to this fusion, you get a visual, comprehensive, and responsive tool to anticipate market moves.
ABCD Lemissa + Monthly Levels + PinBar + Marubozu Indicator Description This indicator combines multiple powerful tools to provide a complete market overview: ABCD Lemissa – Automatically detects ABCD structures with points A, B, C, and D , support/resistance zones, and buy/sell arrows. Monthly Levels – Displays High, Low, Open, Close levels of monthly candles for identifying key zones. PinBar & Marubozu – Detects PinBar candles (reversal signals) and Marubozu candles (strong trend candles) w
Order Block Pro MT5
N'da Lemissa Kouame
Order Block Pro (MQL5) – Version 1.0 Author: KOUAME N'DA LEMISSA Platform: MetaTrader 5 Description: Order Block Pro is an advanced indicator designed to automatically detect bullish and bearish Order Blocks on your chart. By analyzing consolidation candles followed by strong impulsive candles, this tool highlights key areas where price movements are likely to accelerate. This indicator is perfect for traders who want to: Identify precise entry and exit points. Detect dynamic support and resist
ETE Detector v4.0 (Head & Shoulders) Author: KOUAME N’DA LEMISSA Version: 4.0 Platform: MetaTrader 5 Indicator Type: Chart / Visual Trading Signals Overview The ETE Detector v4.0 is a technical indicator designed to automatically detect classic and inverse Head & Shoulders patterns (H&S) on MT5 charts. These patterns are widely used to anticipate trend reversals. With this tool, traders can: Detect sell signals (classic H&S) and buy signals (inverse H&S) with accuracy. Easily visualize patterns
Avis commercial – ETE DETECTOR POWER v5.0 (Head & Shoulders Pro) Détection automatique des motifs tête et épaules ETE DETECTOR POWER v5.0 est un outil professionnel conçu pour les traders qui souhaitent anticiper les retournements majeurs du marché en utilisant l'un des modèles graphiques les plus puissants : le Head & Shoulders (H&S) et sa variation inverse. Grâce à son système de gestion d'objets optimisé (MaxObjects) , l'indicateur reste fluide et lisible, même sur des graphiques chargés
Dynamique mensuelle des plages hautes et basses v1.0 Auteur : KOUAME N'DA LEMISSA Description : L' indicateur dynamique mensuel de fourchette haute et basse affiche les niveaux mensuels clés sur votre graphique grâce à des fonctionnalités avancées de suivi dynamique. Il permet aux traders de visualiser facilement les zones de support et de résistance mensuelles, ainsi que les zones où le prix tend à dépasser ou à tester ces niveaux, offrant ainsi des opportunités de trading précises. P
Monthly High & Low Dynamic Range + Liquidity Zones v1.2 Author: KOUAME N'DA LEMISSA Description: Transform your market analysis with this powerful indicator that combines: Key Monthly Levels: High, Low, Open, and Close to identify the most important support and resistance zones. Dynamic High/Low Range: Automatically tracks extreme price movements to detect significant market shifts. Liquidity Zones: Visual rectangles showing areas where liquidity is concentrated (Buy/Sell). The thickness and c
Nom du produit :   Booster Trading Pro Auteur :   KOUAME N'DA LEMISSA Plateforme :   MetaTrader 5 Type :   Indicateur technique multifonction Description Transformez votre analyse de marché avec   Booster Trading Pro   , l'indicateur tout-en-un qui combine : Niveaux mensuels clés :   haut, bas, ouverture et clôture pour identifier rapidement les zones de support et de résistance. Plage dynamique haute et basse :   suivez les mouvements de prix extrêmes au-dessus ou en dessous des niveaux me
Channel Ultima
N'da Lemissa Kouame
Channel Ultima – Indicateur Multi-Canal Dynamique Description courte Channel Ultima est un indicateur avancé qui trace automatiquement trois canaux dynamiques du marché. Il offre une lecture claire des zones de support, de résistance et d'équilibre , idéale pour les traders techniques et structurels. Présentation détaillée Channel Ultima détecte et affiche trois canaux indépendants associés sur les pivots majeurs et mineurs du marché. Chaque canal représente une zone de pression sur le p
Carte de liquidité institutionnelle Pro Voyez ce que voient les institutions — avant tout le monde Aperçu Institutional Liquidity Map Pro est un indicateur professionnel conçu pour cartographier les zones de liquidité institutionnelle à l'aide des niveaux mensuels les plus hauts et les plus bas . Il détecte automatiquement les zones de stop-hunt , les zones de retournement potentiel et les zones d'accumulation/distribution institutionnelles . L'indicateur suit dynamiquement jusqu'à trois ni
Filter:
No reviews
Reply to review