Weekly Levels Pro

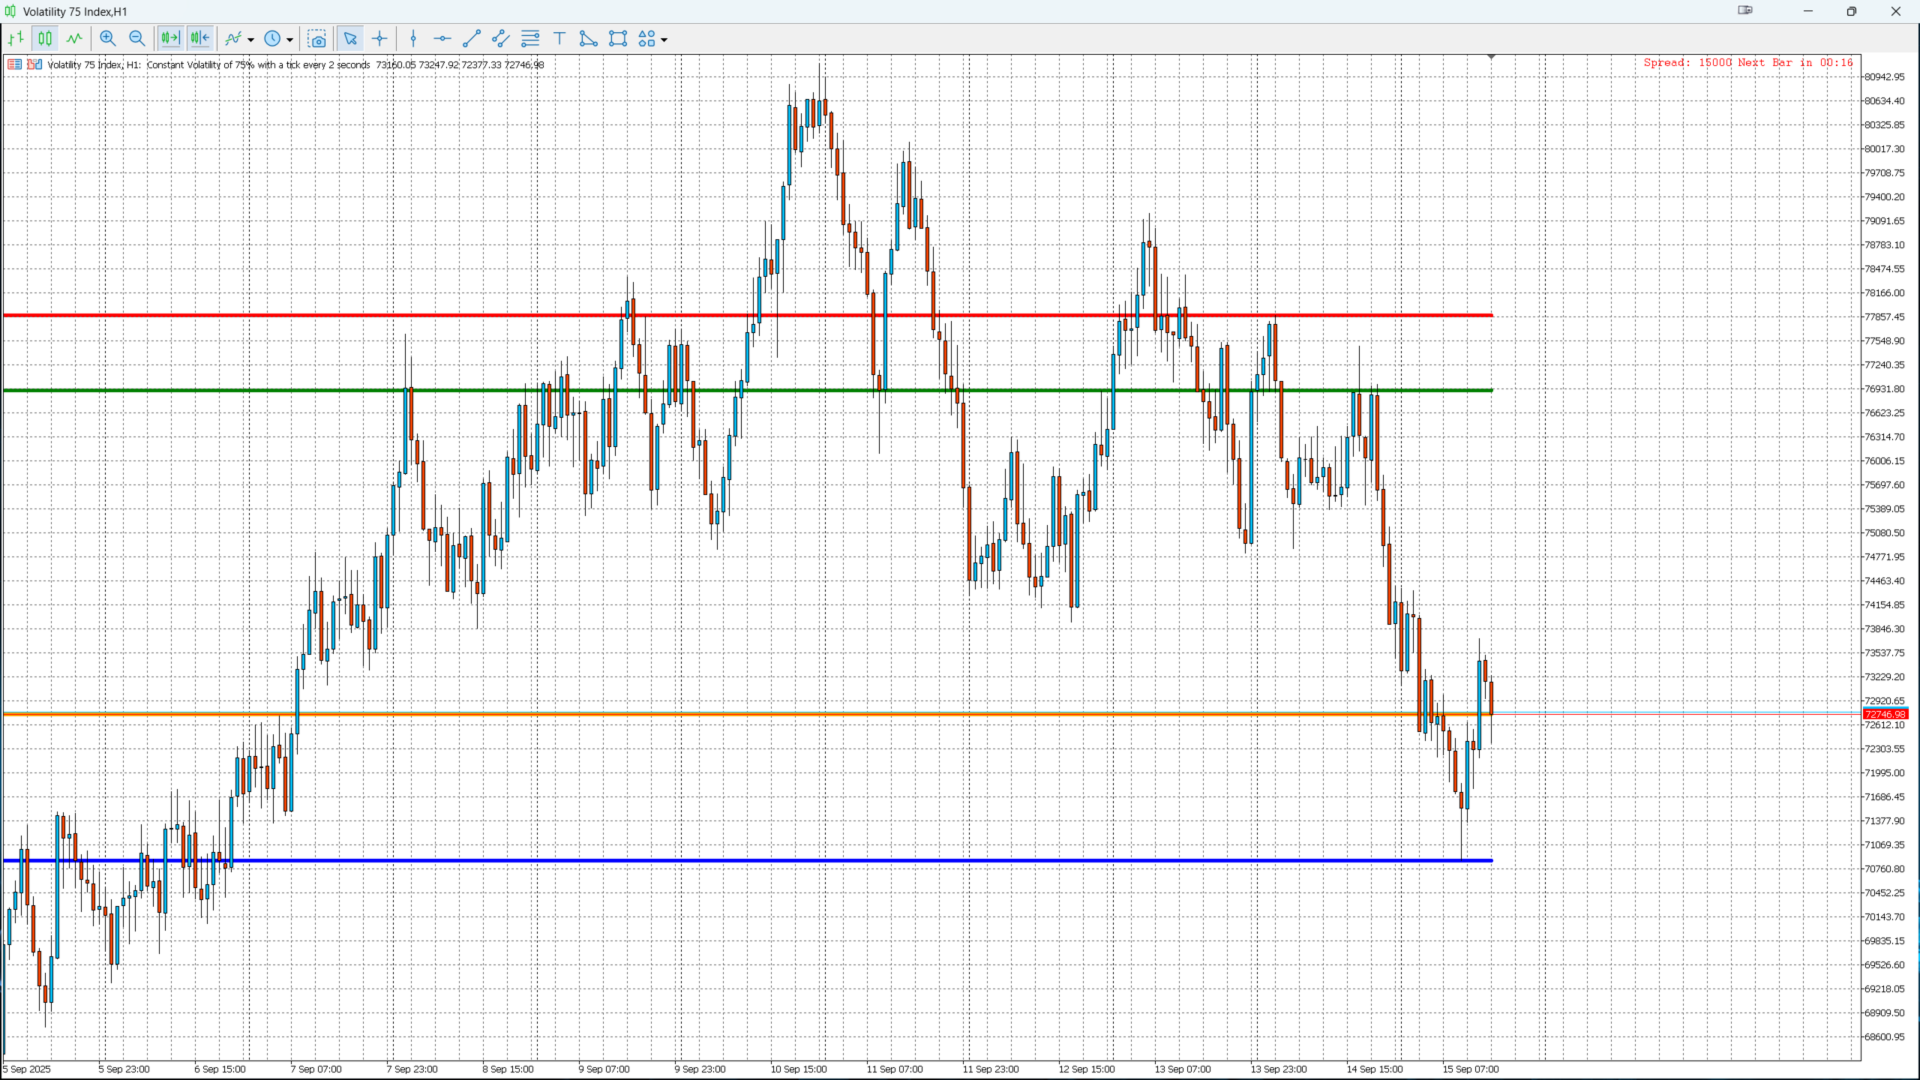
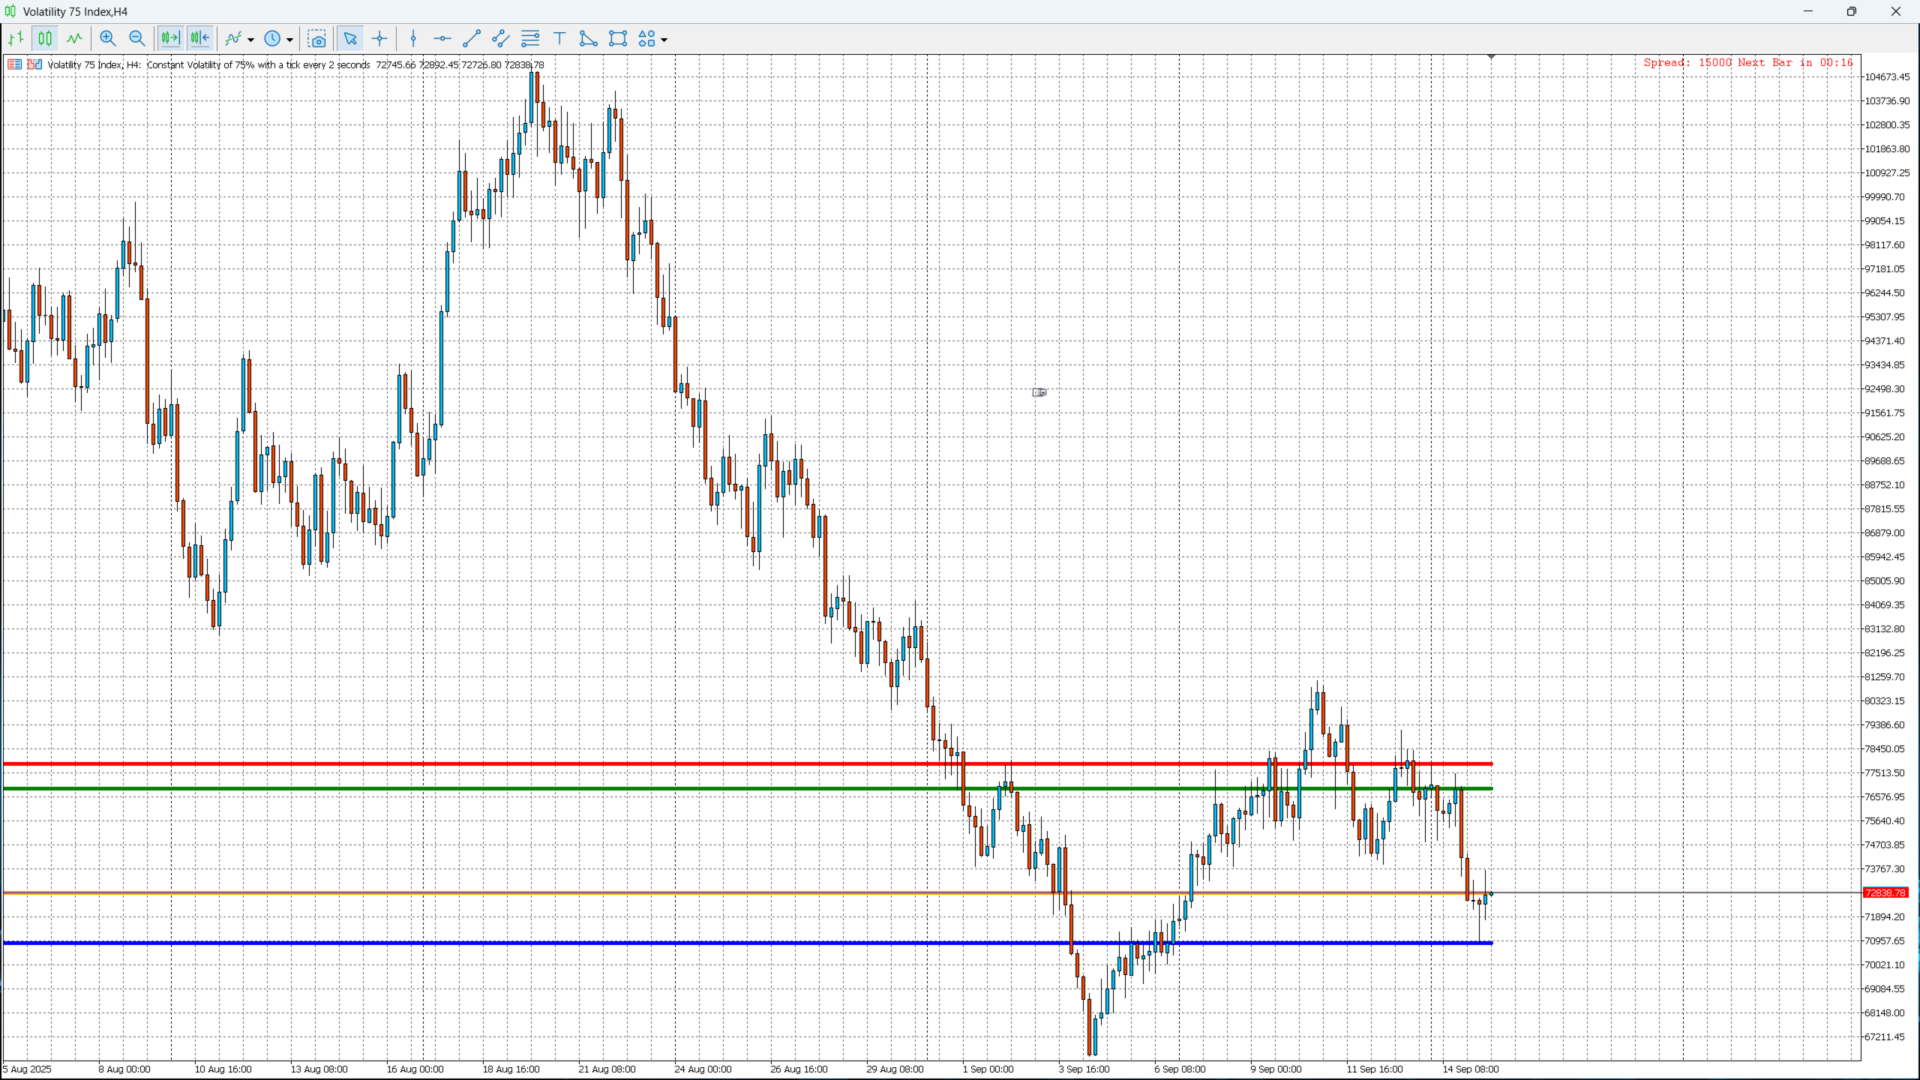
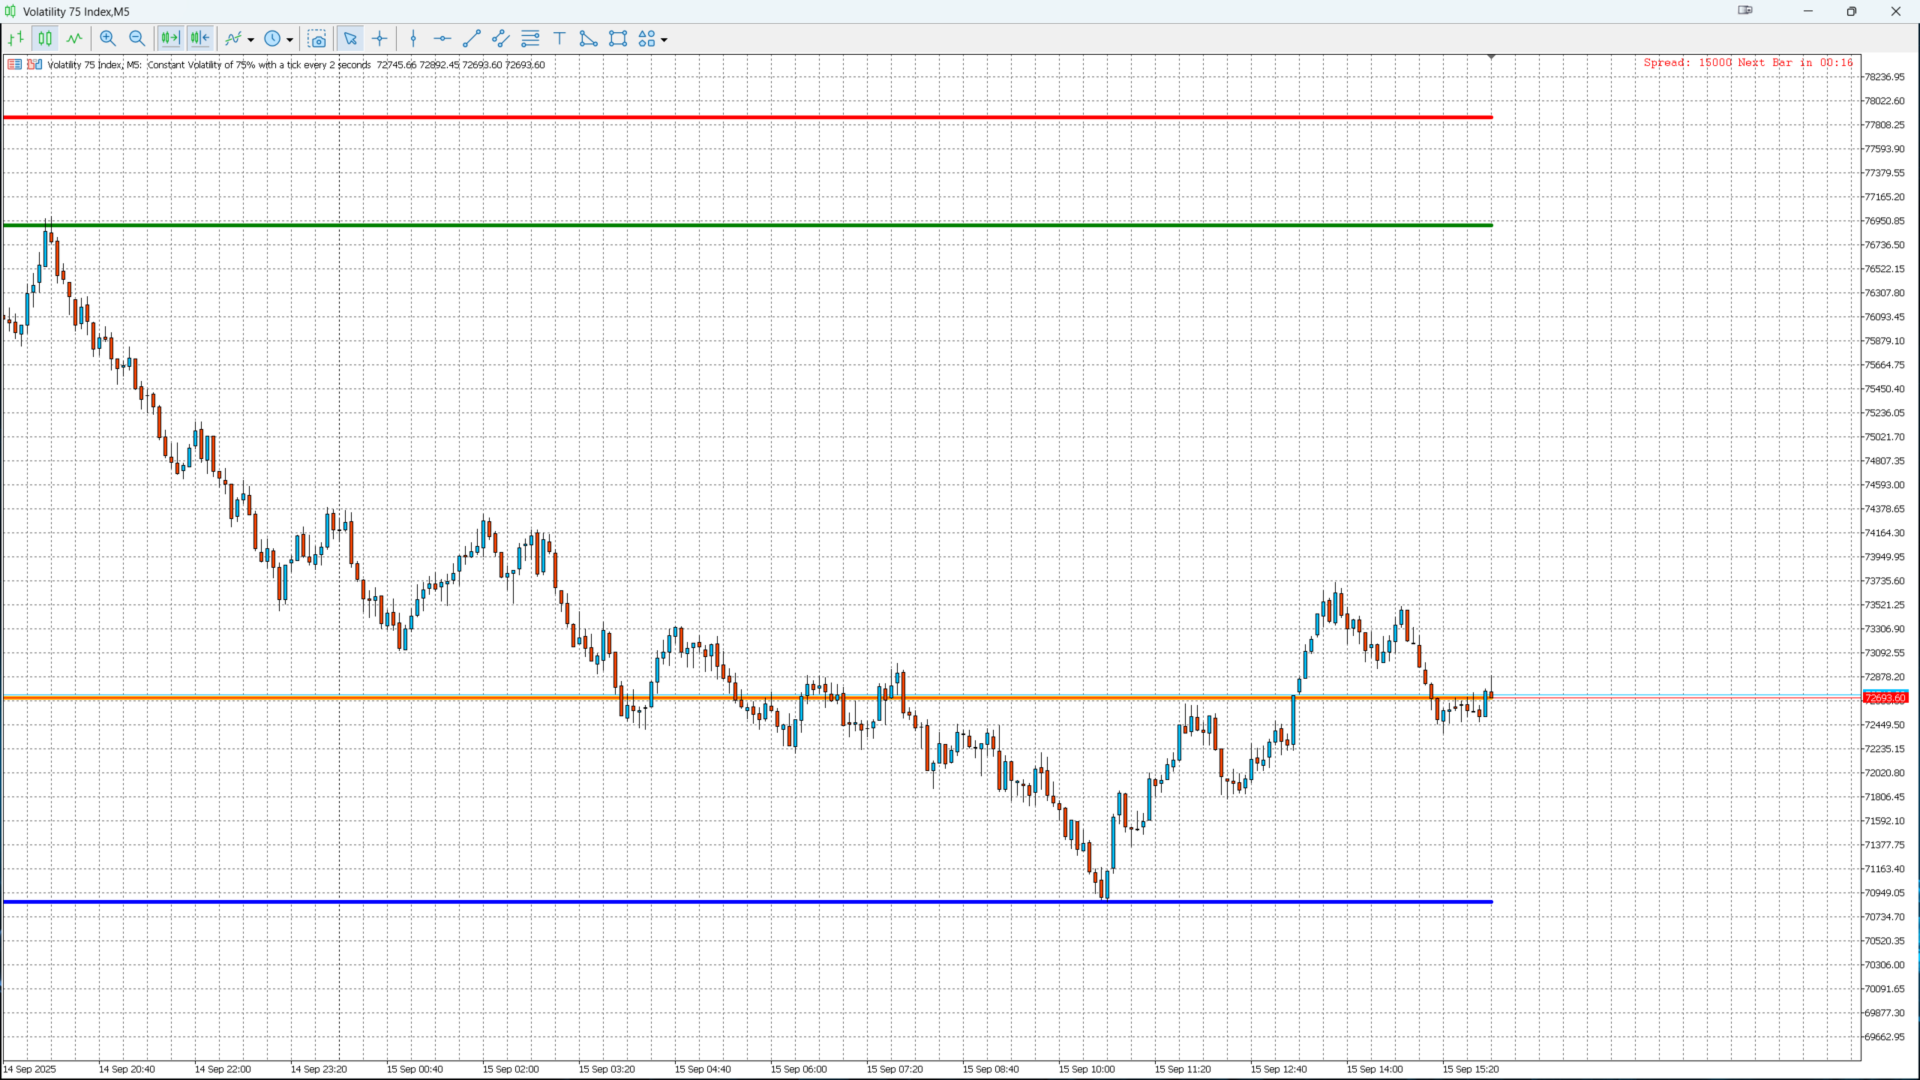
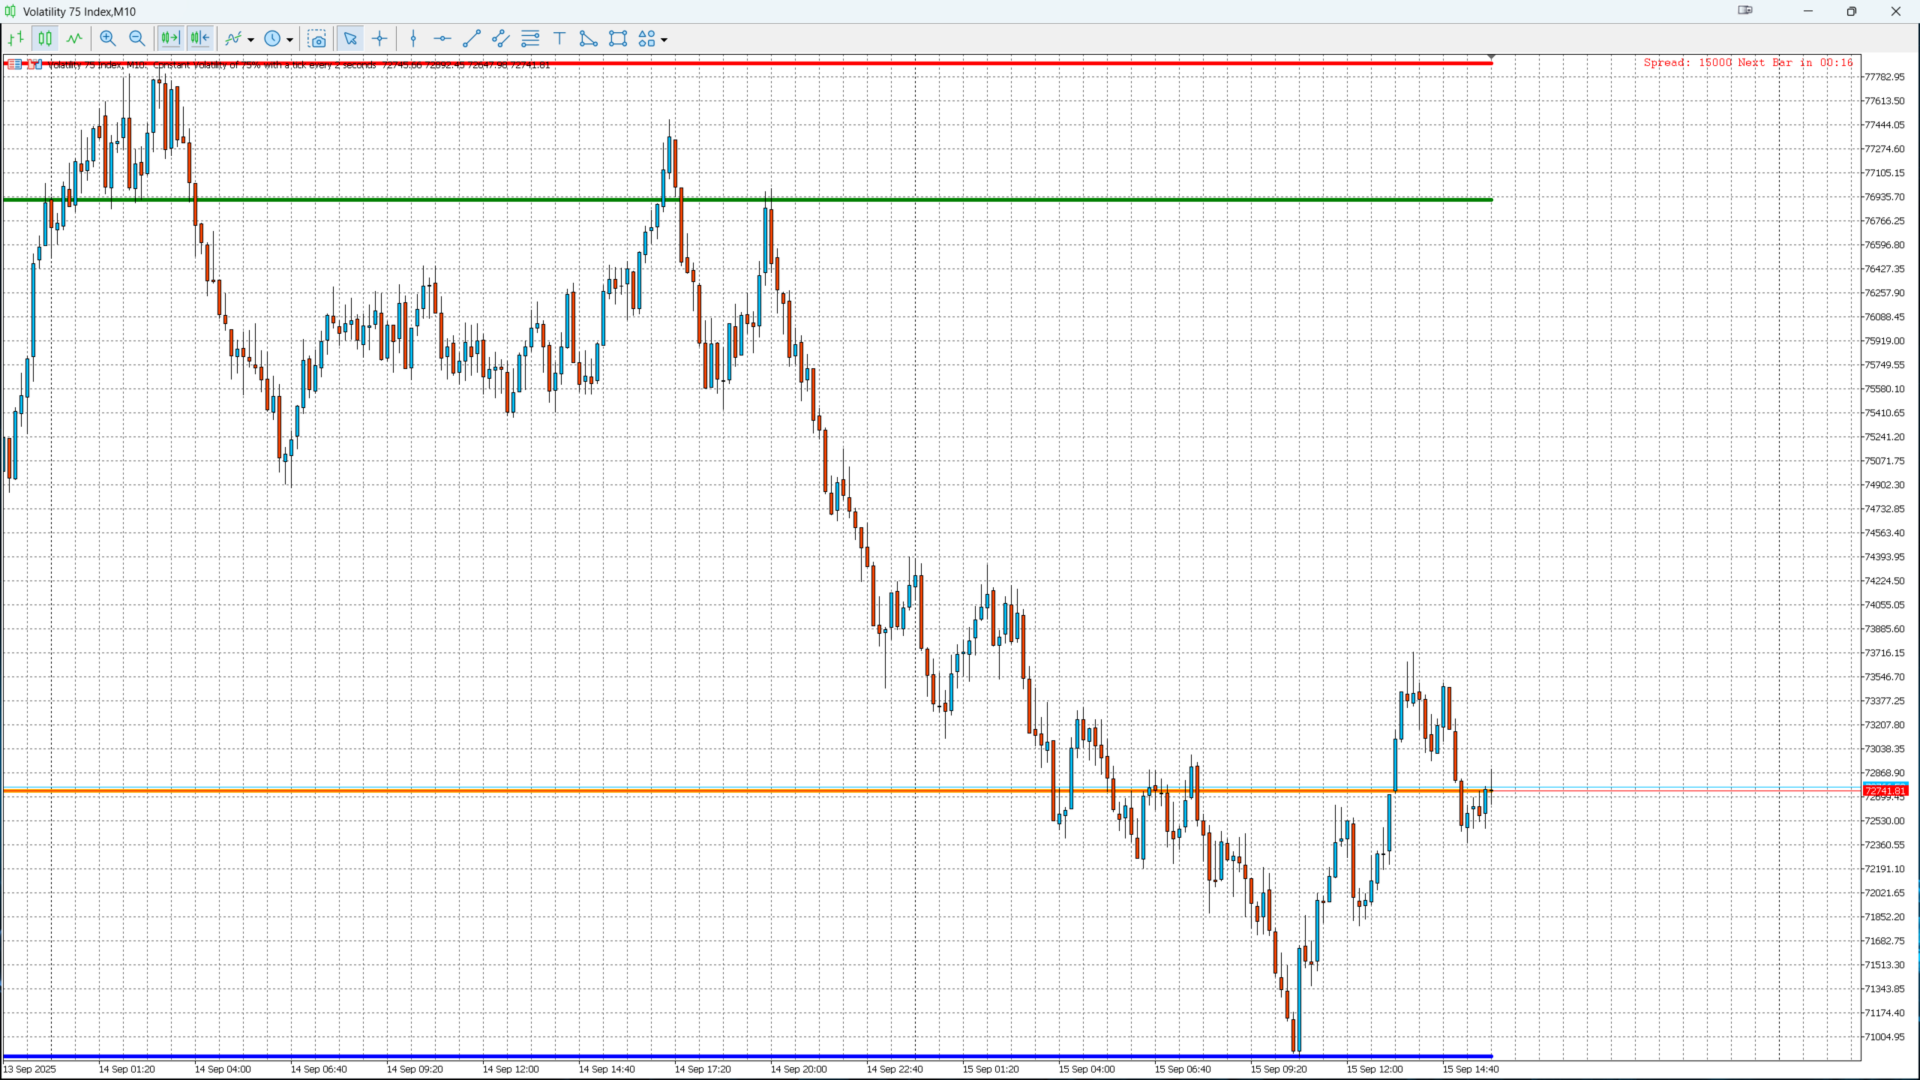
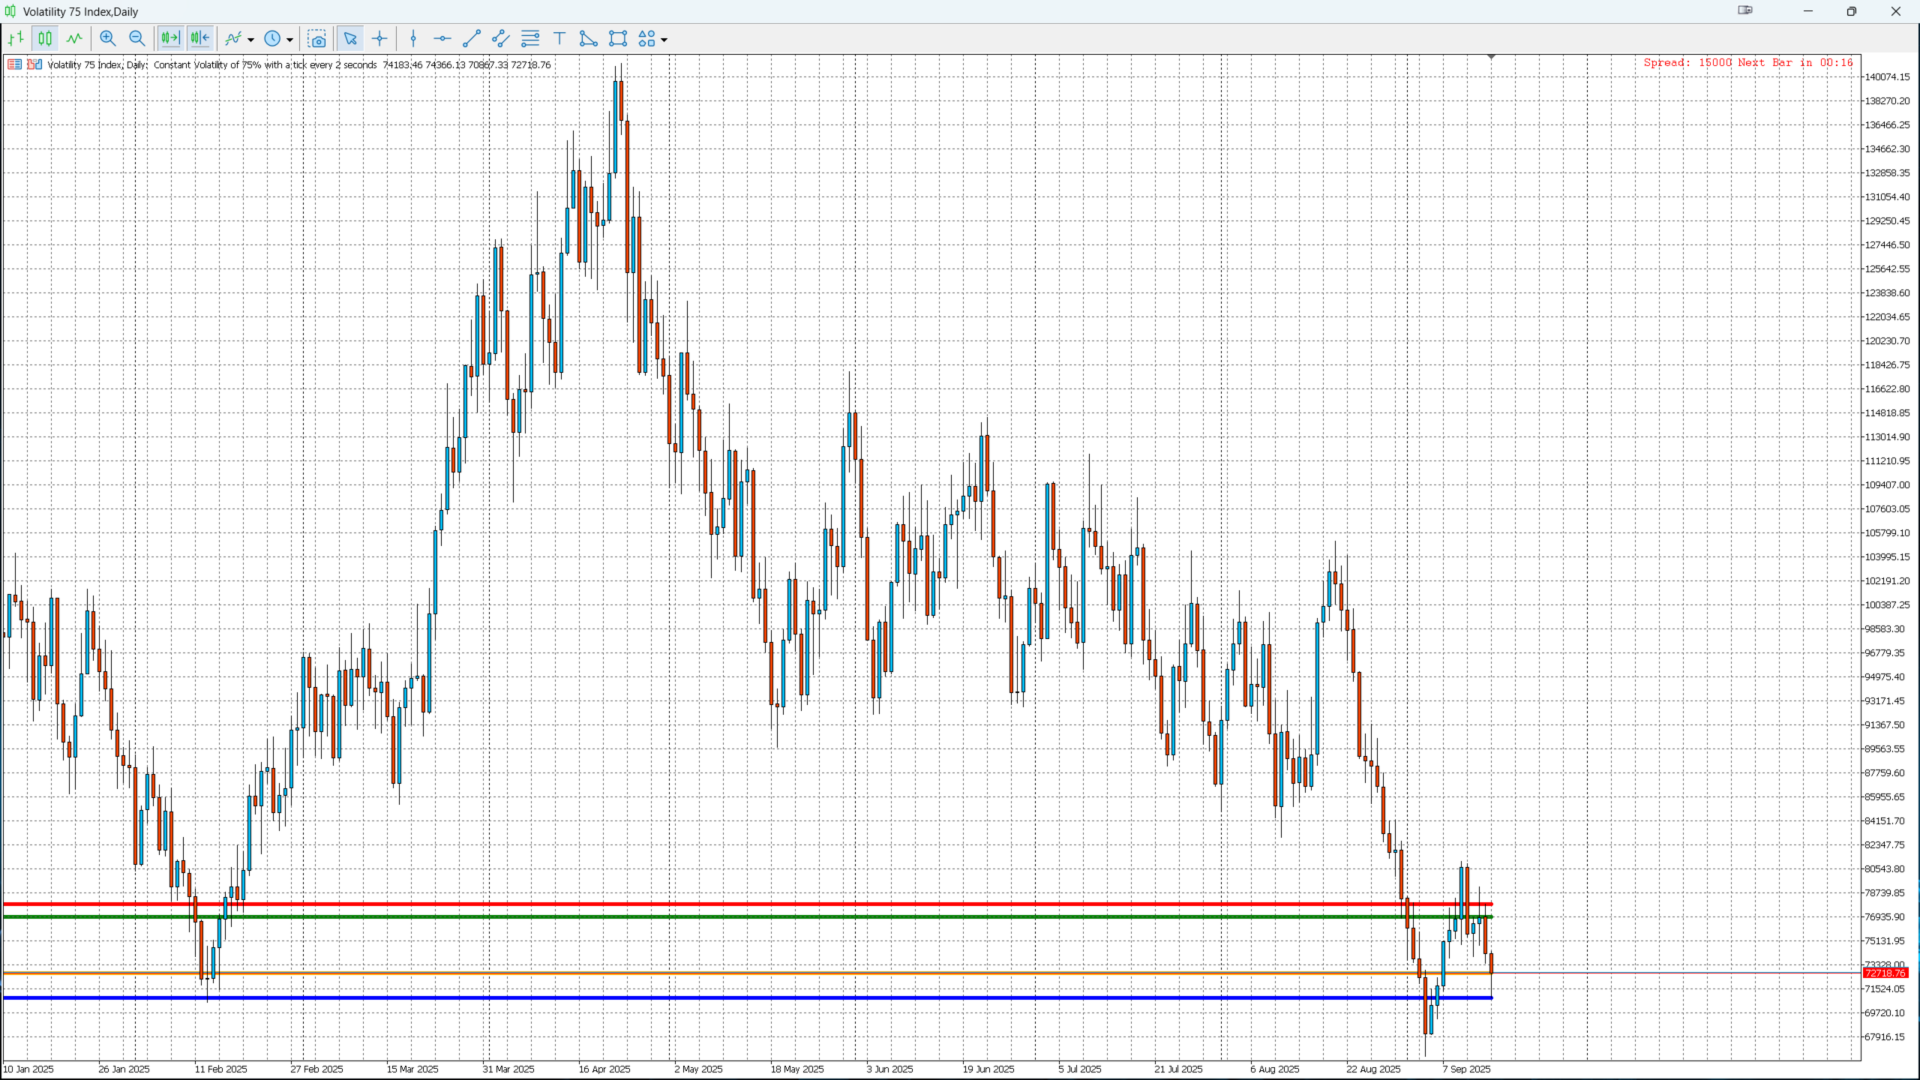
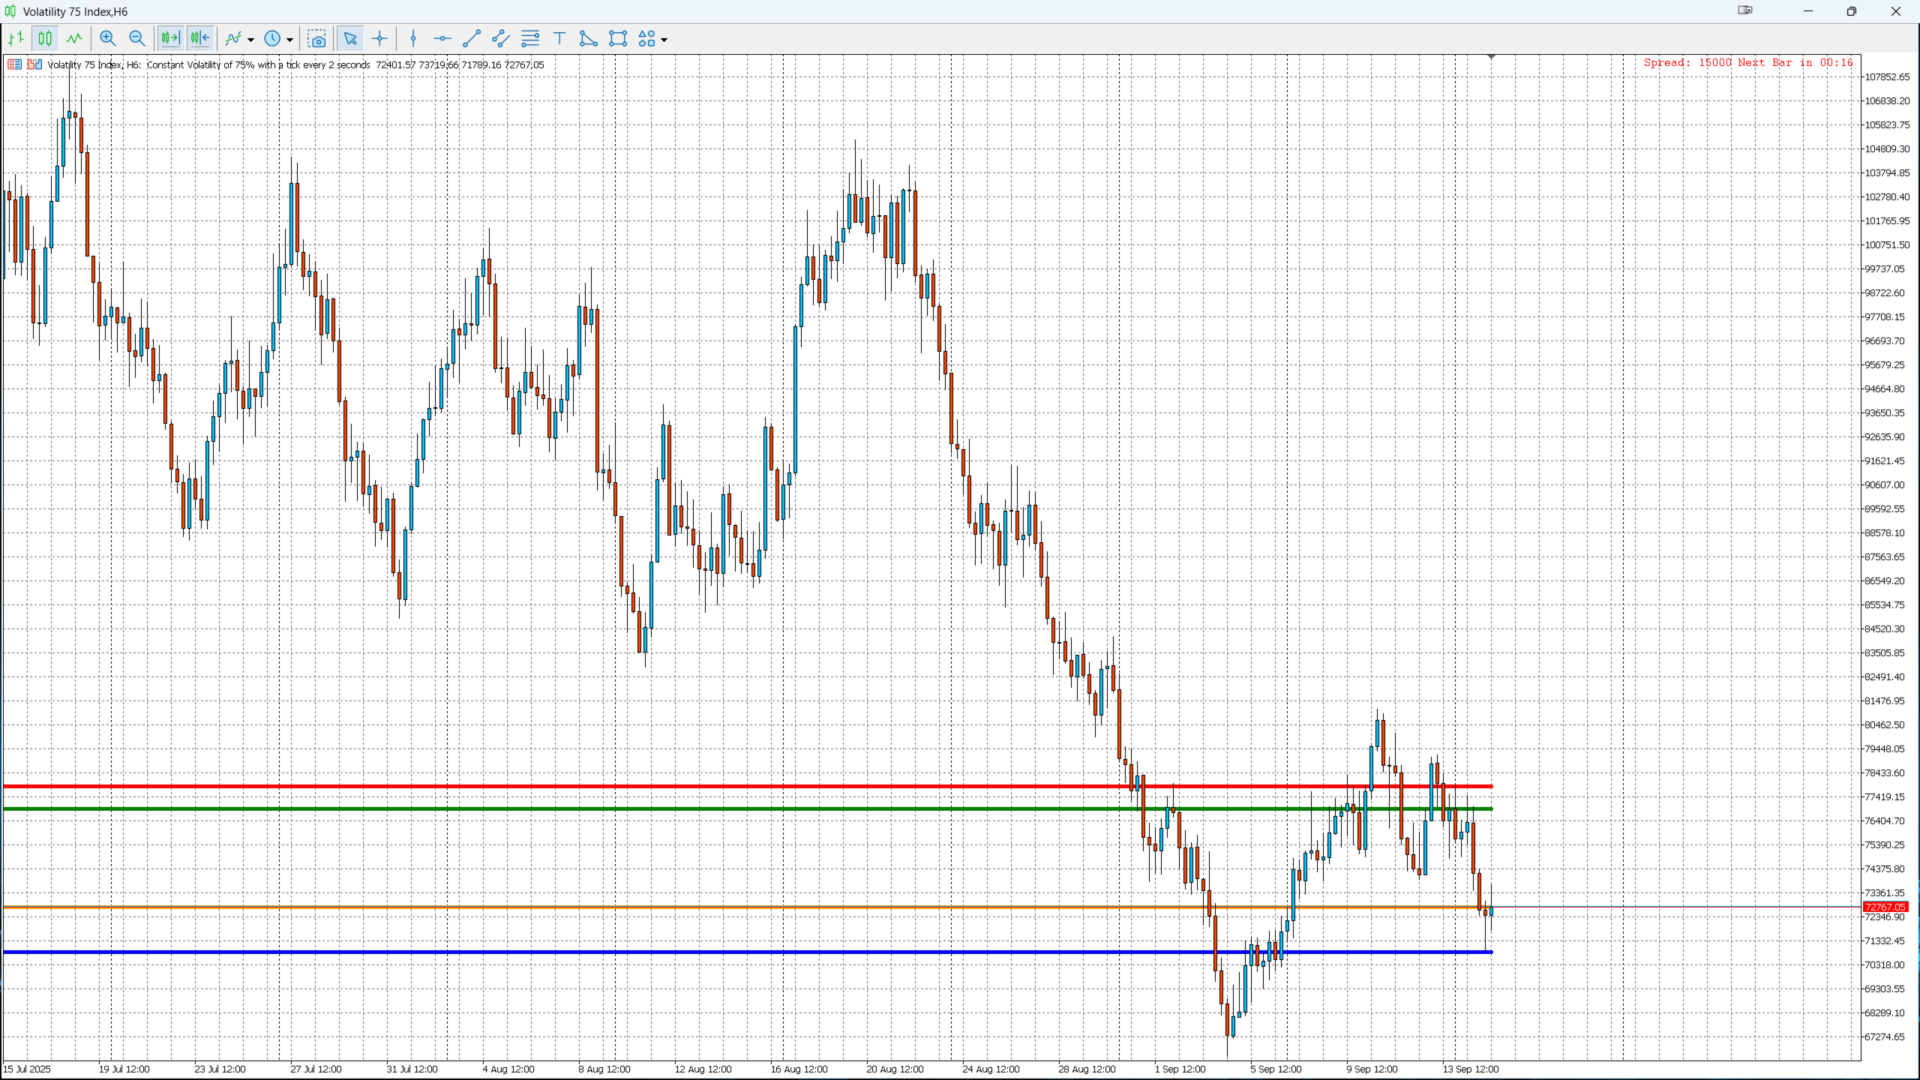
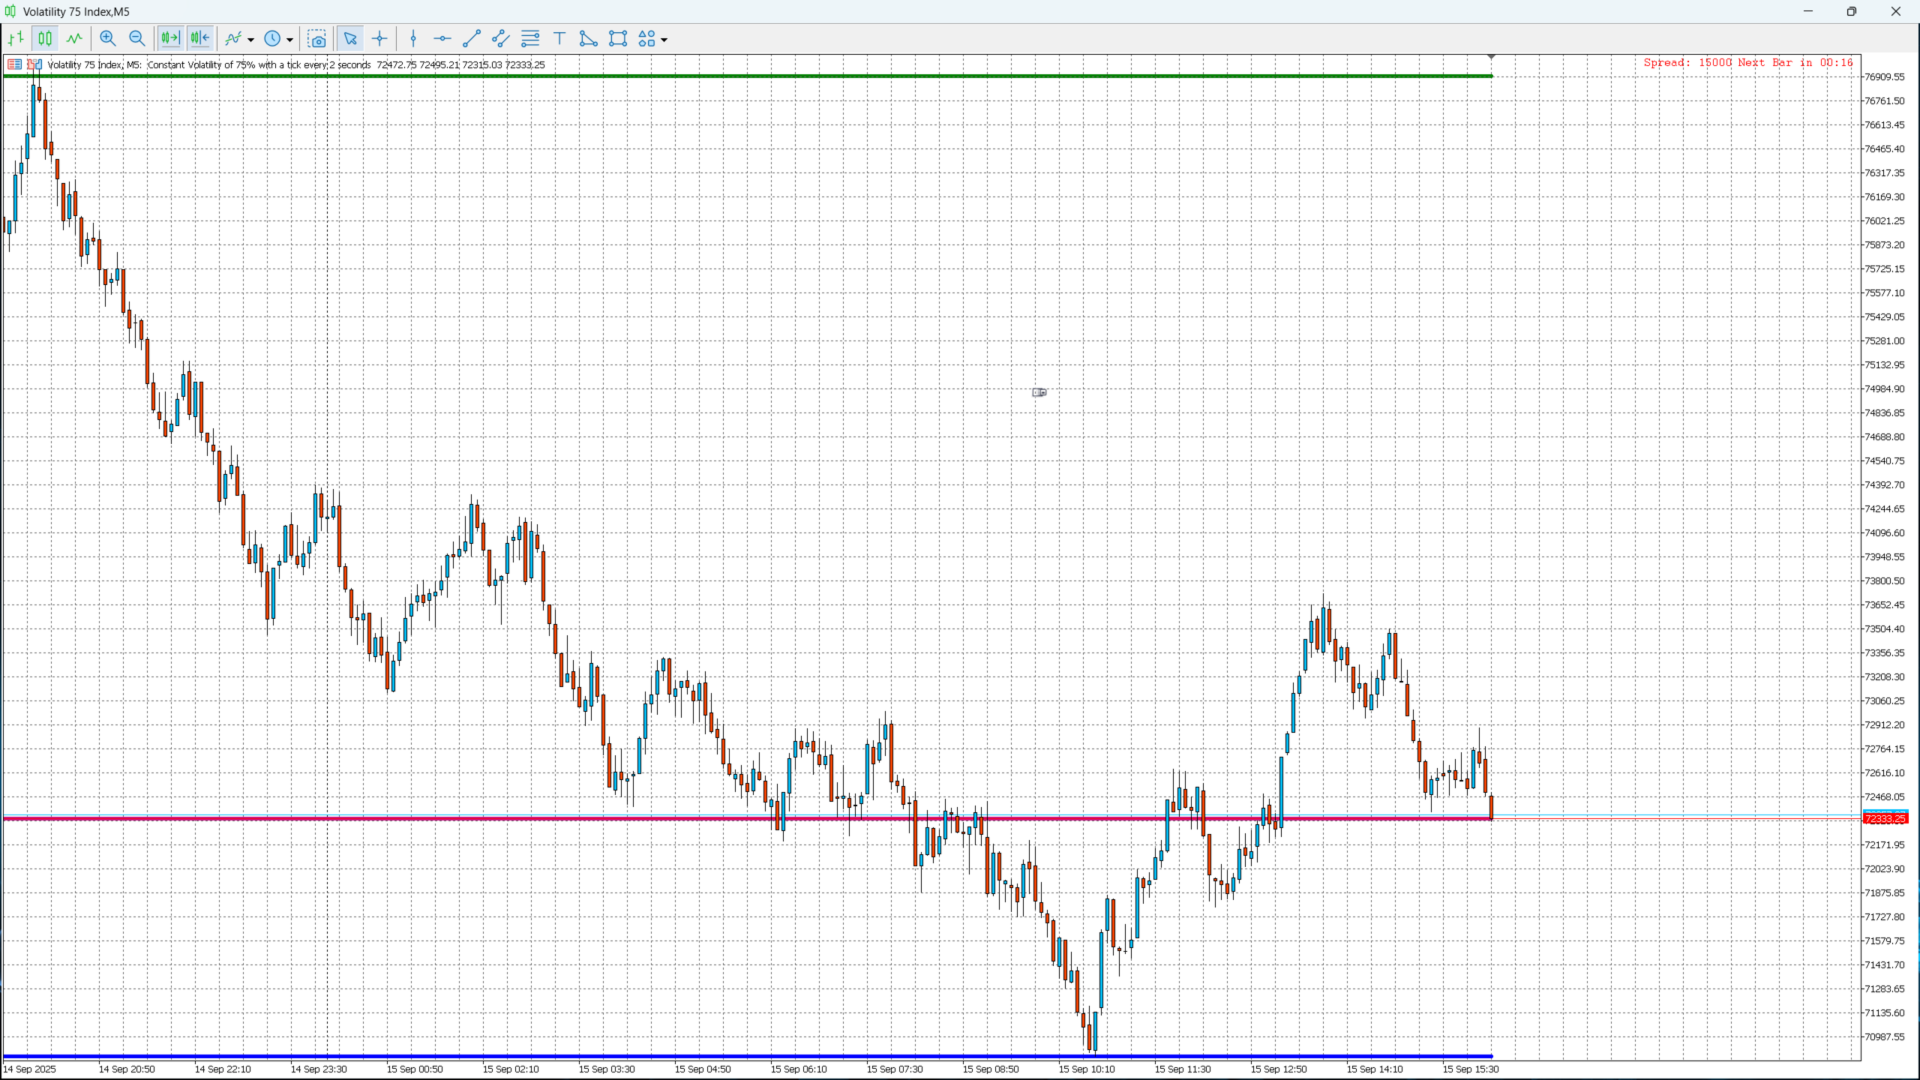
📘 Description – Weekly Levels Pro

Weekly Levels Pro – Key Weekly Levels is a simple yet powerful indicator for MetaTrader 5, designed to automatically display the four most important trading levels of each week:

  • Weekly High → natural resistance level

  • Weekly Low → natural support level

  • Weekly Open → trend reference point

  • Weekly Close → bullish or bearish strength indicator

🔹 Key Features:

✔ Automatically updates at the start of each new week
✔ Clear and easy-to-read display directly on the chart
✔ Helps identify major support and resistance levels quickly
✔ Works on all Forex pairs, indices, commodities, and cryptocurrencies
✔ Optimized parameters – no complex settings required

🔹 Why use Weekly Levels Pro?

Weekly levels are widely used by professional and institutional traders to identify:

  • Breakout and reversal zones

  • Strategic entry and exit points

  • Trend continuation or correction signals

Whether you are a scalper, day trader, or swing trader, this indicator will become an essential tool in your trading strategy.


Recommended products
Auto Fib Retracements
Ross Adam Langlands Nelson
4.2 (5)
Automatic Fibonacci Retracement Line Indicator. This indicator takes the current trend and if possible draws Fibonacci retracement lines from the swing until the current price. The Fibonacci levels used are: 0%, 23.6%, 38.2%, 50%, 61.8%, 76.4%, 100%. This indicator works for all charts over all timeframes. The Fibonacci levels are also recorded in buffers for use by other trading bots. Any comments, concerns or additional feature requirements are welcome and will be addressed promptly. 
FREE
Free automatic Fibonacci is an indicator that automatically plots a Fibonacci retracement based on the number of bars you select on the BarsToScan setting in the indicator. The Fibonacci is automatically updated in real time as new highest and lowest values appears amongst the selected bars. You can select which level values to be displayed in the indicator settings. You can also select the color of the levels thus enabling the trader to be able to attach the indicator several times with differe
FREE
Fvg Edge
Ahmad Meftah Abdulsalam Alawwami
5 (1)
FVG Smart Zones – Free Edition Fair Value Gap Detection Indicator for MetaTrader 5 (MT5) Are you looking for a real trading tool – not just another random indicator? FVG Smart Zones – Free Edition gives you professional market insight by automatically detecting Fair Value Gaps (FVGs) and highlighting high-probability trading zones directly on your chart. Built for traders following: Smart Money Concepts (SMC) ICT Trading Concepts Price Action Supply & Demand Analysis Institutiona
FREE
Welcome price: 35  $ Pattern Head and Shoulders is ideal for traders seeking reliable pattern recognition, including both bullish and bearish Head and Shoulders formations, with integrated Fibonacci levels, neckline break detection, and early prediction techniques. A powerful MT5 tool for those who value technical analysis, and precision in identifying chart structures and trend reversals. Dual Detection Methods Method 1 – Classic Pattern Detection Detects standard Head and Shoulders pattern
The SMC Venom Model BPR indicator is a professional tool for traders working within the Smart Money (SMC) concept. It automatically identifies two key patterns on the price chart: FVG   (Fair Value Gap) is a combination of three candles, in which there is a gap between the first and third candles. It forms a zone between levels where there is no volume support, which often leads to a price correction. BPR   (Balanced Price Range) is a combination of two FVG patterns that form a “bridge” - a zon
Premium level is a unique indicator with more than 80% accuracy of correct predictions! This indicator has been tested for more than two months by the best Trading Specialists! The author's indicator you will not find anywhere else! From the screenshots you can see for yourself the accuracy of this tool! 1 is great for trading binary options with an expiration time of 1 candle. 2 works on all currency pairs, stocks, commodities, cryptocurrencies Instructions: As soon as the red arrow app
Indicator Monthly Levels + Pin Bar Pro Description The Monthly Levels + Pin Bar Pro indicator combines the power of monthly key levels (High, Low, Open, Close) with automatic detection of Price Action reversal patterns (Pin Bars) . Designed for technical and institutional traders, it helps anticipate market reaction zones and generates clear visual signals directly on the chart. Main Features Automatic monthly levels : High, Low, Open, Close. Pin Bar detection (bullish & bearish) in r
Somewhere over the rainbow It is a system that tries to operate the market from the exhaustion of the trend with a correction algorithm that tries to cut losses at the cost of increasing the margin This system makes all the adjustments automatically, analyzing the pair and the market to decide which is the most efficient step to reach your destination. Somewhere over the rainbow is a multiple trade and multi lot system(The maximum batch can be up to 5 times the initial batch distributed in mult
Check out my TRADE PLANNER MT5 – strongly recommended to anticipate account scenarios before risking any money. This is a multi-symbol, multi-timeframe, table-based indicator for MetaTrader 5 that identifies 46 types of candlestick formations. Each formation has its own image for easier recognition. The indicator includes popular patterns such as Engulfing, Hammer, Three Line Strike, Piercing, and Doji-like candles. You can check the full list of patterns in the screenshots below. Also you can
AUTO FIBONACCI MULTI-TIMEFRAME TOOLKIT Technical analysis tool that automatically draws Fibonacci levels for 4H, Daily, Weekly, and Monthly sessions. AUTOMATIC FIBONACCI RETRACEMENTS (7 CLASSIC LEVELS): - 0.0% (Previous session Low - support level) - 23.6% (Fibonacci Golden Ratio - early entry level) - 38.2% (Strong retracement level) - 50.0% (Key pivot level highlighted in YELLOW - market equilibrium) - 61.8% (Main Golden Ratio - critical decision level) - 78.6% (Deep retracement level) - 100.0
Market Trend Indicator Analog Copyright 2025, Jose María Molina Sánchez molinatrader67@gmail.com | Version 1.00 Introduction The Market Trend Indicator Analog is an advanced indicator designed to measure the strength and direction of market trends in real time. Unlike traditional oscillators, this indicator uses an adaptive filtering system that dynamically responds to market conditions, providing a precise analog representation between -100 and +100. Its design allows traders to ide
The indicator builds current quotes, which can be compared with historical ones and on this basis make a price movement forecast. The indicator has a text field for quick navigation to the desired date. Options: Symbol - selection of the symbol that the indicator will display; SymbolPeriod - selection of the period from which the indicator will take data; IndicatorColor - indicator color; Inverse - true reverses quotes, false - original view; Next are the settings of the text field, in w
Fibonacci Auto
Makarii Gubaydullin
Automatically plots Fibo levels, based on the High & Low prices from the specified time frame Multiple bars   may be united: e.g. you can get a Fibo based on the 10-days Highs and Lows My   #1   Utility : 66+ features, including this indicator  |   Contact me  for any questions  |    MT4 version Helps to see potential reversal levels; Patterns formed at the Fibo levels tend to be stronger; Significantly   reduces   the   time   spent   on   manual  plotting ; Settings: Timeframe to calculate the
Eabotpro Signals v3.0 A professional MetaTrader 5 indicator designed to deliver high-precision trading signals with real-time notifications, trade management tools, and a clean interface. "Recommended Base time frame is 4H Fibo From input . and trade time frame 1 mint , and 5 mint " Key Features: High-Accuracy Signals : Optimized for precision and consistency across different market conditions. Smart Trade Panel : Displays entry price, targets, stop levels, performance stats, and profit trackin
Overview Harmonic Patterns MT5 is a technical analysis indicator designed for the MetaTrader 5 platform. It identifies and displays harmonic price patterns, such as Butterfly, Cypher, Crab, Bat, Shark, and Gartley, in both bullish and bearish directions. The indicator calculates key price levels, including entry, stop loss, and three take-profit levels, to assist traders in analyzing market movements. Visual elements and customizable alerts enhance usability on the chart. Features Detects six ha
Harmonic Pattern Suite Pro Introduction Harmonic Pattern Suite Pro is an indicator designed to identify and display harmonic structures on the chart based on X-A-B-C-D sequences. Its purpose is to present pattern formations that meet geometric and proportional criteria, providing a clear visual representation directly on the chart. The indicator automates the detection process, removing the need for manual measurement of ratios and allowing the user to review the structural configuration withou
FREE
# DRAWDOWN INDICATOR V4.0 - The Essential Tool to Master Your Trading ## Transform Your Trading with a Complete Real-Time Performance Overview In the demanding world of Forex and CFD trading, **knowing your real-time performance** isn't a luxury—it's an **absolute necessity**. The **Drawdown Indicator V4.0** is much more than a simple indicator: it's your **professional dashboard** that gives you a clear, precise, and instant view of your trading account status. --- ## Why This Indicator
Reversal Pattern AI — an absolute breakthrough in the world of indicator development, combining artificial intelligence algorithms, multi-level market analysis, and classical methods of technical analysis. It not only detects reversal patterns but also evaluates market inefficiencies, generating highly accurate trading signals. Thanks to a hybrid model that uses price action analysis, Volumes, Volatility, VWAP, and Volume AVG %, the indicator easily adapts to any market conditions.              
Product Name: Anchor auto TP and SL Trade Manager Pro MT5 The ultimate manual assistant. Turns trades into auto-grids with Hedging, Zero-Loss Breakeven & Spread Detection. Your manual trade will be managed automatically. Anchor Auto TP and SL Trade Manager MT5 Pro is the advanced edition of our popular trade assistant. It transforms simple manual trades into sophisticated, professional-grade recovery grids. Unlike the free version, this PRO edition fully supports Hedging (simultaneous Buy & Sell
This indicator is a   technical tool based on harmonic approximations   of solar and lunar cycles. It   does not use exact astronomical positions. This indicator uses   mathematical waves to approximate daily solar and monthly lunar cycles   for trading purposes. It captures general market rhythms influenced by day/night and moon phases, but it   does not track exact astronomical positions . Do your analysis and study on back test before purchase.  The   Advanced Astrological Indicator   is a m
The indicator automatically plots and tracks buy and sell Fibo levels at any symbol and timeframe. FiboPlus displays: Fibo levels of the probable upward or downward price movements. entry points are shown using "up arrow", "down arrow" icons. The data is doubled on SELL and BUY buttons. rectangle area limited by levels 0-100. Trading is performed from one level to another (no trend). Features price movement forecast, market entry points, stop loss and take profit for orders. ready-made trading
Master head and shoulders patterns for better trading decisions A head and shoulders pattern is a chart formation that resembles a baseline with three peaks, the outside two are close in height and the middle is highest. It predicts a bullish-to-bearish trend reversal and is believed to be one of the most reliable trend reversal patterns. It is one of several top patterns that signal, with varying degrees of accuracy, that a trend is nearing its end.  [ Installation Guide | Update Guide | Troub
Sonic R Pro Enhanced EA - Version 2025 $249 Only for the First 5 Buyers! Live Signal Check the live performance of Sonic R Pro Enhanced: Live Sonic R Trading Strategy Sonic R Pro Enhanced is an upgraded version of the traditional Sonic R strategy, automating trades based on the Dragon Band (EMA 34 and EMA 89) and incorporating advanced algorithms to maximize performance. Timeframes: M15, M30 Supported Pairs: XAUUSD, BTCUSD, AUDJPY, USDJPY Trading Style: Swing Trading - Pullback & Counter-
BOS Recovey Zone EA
Mohamad Saad Samsudin
The   BOS Recovery Zone EA   is a sophisticated automated trading system that combines Break of Structure (BOS) strategy with robust dual-mode recovery management. Designed for serious traders who demand reliability and advanced risk management, this EA offers unparalleled flexibility with both Netting and Hedging modes to adapt to any broker environment.
FREE
Mine Farm
Maryna Kauzova
Mine Farm is one of the most classic and time-tested scalping strategies based on the breakdown of strong price levels. Mine Farm is the author's modification of the system for determining entry and exit points into the market... Mine Farm - is the combination of great potential with reliability and safety. Why Mine Farm?! - each order has a short dynamic Stop Loss - the advisor does not use any risky methods (averaging, martingale, grid, locking, etc.) - the advisor tries to get the most
FusionPro EA
Bram Van De Vooren
FusionPro v1.1 Beta - Multi-Strategy News-Aware EA ️ CONSERVATIVE Multi-Pair Trading System with Advanced Risk Protection LIMITED BETA RELEASE - $299 (Price increases +$100 after every 10 sales - Secure your copy now!) ️ SAFETY-FIRST TRADING APPROACH Conservative Risk Management - Maximum 0.1%-2.0% risk per pair, never risky martingale News Event Protection - Automatically blocks trades during high-impact volatile events Smart Position Limits - Maximum open trades cap prevents o
Stratos Pali mt5
Michela Russo
4.5 (8)
Stratos Pali Indicator is a revolutionary tool designed to enhance your trading strategy by accurately identifying market trends. This sophisticated indicator uses a unique algorithm to generate a complete histogram, which records when the trend is Long or Short. When a trend reversal occurs, an arrow appears, indicating the new direction of the trend. Important Information Revealed Leave a review and contact me via mql5 message to receive My Top 5 set files for Stratos Pali at no cost ! Down
Moving Average Surfer
Rowan Stephan Buys
Moving Average Surfer – Precision Trend Capture for MT5 Ride the waves of the market with Moving Average Surfer , designed for traders who demand precision, efficiency, and automated risk management. This EA seamlessly combines the directional insight of fast and slow moving averages with advanced market filters to identify high-probability trading opportunities. Key Features: Dual Moving Average Analysis: Leverages fast and slow MA signals to gauge market direction, enhancing trade accuracy. In
Auto Optimized RSI   is a smart and easy-to-use arrow indicator designed for precision trading. It automatically finds the most effective RSI Buy and Sell levels for your selected symbol and timeframe using real historical data simulations. The indicator can be used as a standalone system or as part of your existing trading strategy. It is especially useful for intraday trading. Unlike traditional RSI indicators that rely on fixed 70/30 levels,   Auto Optimized RSI   dynamically adjusts its lev
##   ONLY GOLD ##   Тiльки Золото ## **Mercaria Professional Trading Zones - Complete Guide** ## **Mercaria Professional Trading Zones - Повний посібник** ### **How Mercaria Zones Work / Як працюють зони Mercaria** **English:** Mercaria Zones is an advanced trading indicator that identifies high-probability support and resistance areas using ZigZag extremes combined with mathematical zone calculations. The indicator works on multiple timeframes simultaneously, providing a comprehensive view
Buyers of this product also purchase
AriX
Temirlan Kdyrkhan
1 (4)
AriX Indicator for MT5 A powerful trend-following and signal-evaluation tool AriX is a custom MT5 indicator that combines Moving Averages and ATR-based risk/reward logic to generate clear buy/sell signals. It visualizes dynamic SL/TP levels, evaluates past trade outcomes, and displays win/loss statistics in a clean on-chart panel. Key features include: Buy/Sell signals based on MA crossovers ATR-based SL/TP1/TP2/TP3 levels with visual lines and labels Signal outcome tracking with real-time stat
ARICoins
Temirlan Kdyrkhan
ARICoin is a powerful trading companion designed to generate high-probability entry signals with dynamic TP/SL/DP levels based on volatility. Built-in performance tracking shows win/loss stats, PP1/PP2 hits, and success rates all updated live. Key Features: Buy/Sell signals with adaptive volatility bands Real-time TP/SL/DP levels based on ATR Built-in MA Filter with optional ATR/StdDev volatility Performance stats panel (Success, Profit/Loss, PP1/PP2) Alerts via popup, sound, push, or email Cust
TrendMaestro5
Stefano Frisetti
note: this indicator is for METATRADER4, if you want the version for METATRADER5 this is the link:  https://www.mql5.com/it/market/product/108106 TRENDMAESTRO ver 2.5 TRENDMAESTRO recognizes a new TREND from the start, he never makes mistakes. The certainty of identifying a new TREND is priceless. DESCRIPTION TRENDMAESTRO identifies a new TREND in the bud, this indicator examines the volatility, volumes and momentum to identify the moment in which there is an explosion of one or more of these da
The " Dynamic Scalper System MT5 " indicator is designed for the scalping method of trading within trend waves. Tested on major currency pairs and gold, compatibility with other trading instruments is possible. Provides signals for short-term opening of positions along the trend with additional price movement support. The principle of the indicator. Large arrows determine the trend direction. An algorithm for generating signals for scalping in the form of small arrows operates within trend wav
Get the FREE AUX Indicator and EA Support Direct Download — Click Here [ D.I.C.E ] The DICE Indicator Divergence in Chaos Environment is a specialized MT5 tool built for traders who apply Elliott Wave Theory within the framework of Trading Chaos techniques. It identifies hidden and regular divergences in price action, synchronized with the chaotic market environment described by Bill Williams. Key Features Elliott Wave–Aligned Divergence: Detects bullish and bearish divergences in harmony with
+++++++++++++++++++++++++++++++++++++++++++++++++++++++++++++++++++++++++++++++++++++++++++++++++ +++ Link to EURUSD Only Free Version -->  https://www.mql5.com/en/market/product/156904?source=Unknown +++++++++++++++++++++++++++++++++++++++++++++++++++++++++++++++++++++++++++++++++++++++++++++++++ Hallo Trader, This is a traditional GANN & FIBONACCI strategy based on detection of an impulsive move in the opposite direction. This is called a Breakout. At the moment of Breakout, the indicator draw
Frontier Pivots
Nestor Jose Mendez Boza
FRONTIER PIVOTS - Geometric Levels Indicator This indicator plots support and resistance levels/ranges on the chart using mathematical calculations. It helps traders identify potential price reaction zones based on geometric patterns. Main Features: Automatically calculates and displays key price levels Plots both support and resistance lines Uses daily price data for level calculation Clean visual presentation with different colors for different level types No repainting - levels remain static
Pantera Indicator
Temirlan Kdyrkhan
5 (1)
A tool for on-chart strategy backtesting and performance analysis. A utility for developing, debugging, and testing custom trading ideas and indicator functions. An indicator designed to quickly test trading concepts and visualize the effectiveness of different input parameters. An all-in-one sandbox for testing everything from simple crossovers to complex, multi-condition trading systems.
Weis Wave with Alert MT5
Trade The Volume Waves Single Member P.C.
4.94 (17)
Rental/Lifetime Package Options and Privileges  Rent Monthly Six Months   Yearly/Lifetime Weis Wave with Speed with Alert+Speed Index x x x Manual  x x x Quick Set up Video x x x Blog x x x Lifetime Updates x x x Setup and Training Material x x Discord Access Channel "The SI traders"          x Rectangle Break Alert Tool      x How to trade with it:    http://www.tradethevolumewaves.com   ** If you purchase please contact me to setup your  : Training Room and  complete manual access.  Wei
Hello I Want to introduce The Forex Buy Sell Arrow Premium MT5 i recently release this premium indicator! its 1000% Non Repaint Indicator, It Work Perfectly Well,, i tested it day by day, Just mind blowing Result,  Including Powerful trend Algorithm! How It Work? well, it work market trend formula, when trend Bullish Or when trend Bearish,  Recommend Timeframe M30, H1 it work all timeframe, and all currency pair, 100% non repaint, How to take signal From Forex Buy Sell Arrow Premium Ind
Big Player Range
Thalles Nascimento De Carvalho
5 (3)
BigPlayerRange — Best Indicator for Micro Index and Micro Dollar | MT5 Unlock the power of BigPlayerRange , widely recognized as the best institutional indicator for the micro index and micro dollar on MetaTrader 5. This powerful tool highlights strategic zones of institutional activity, providing ultra-precise market structure insights. How It Works: BigPlayerRange draws two horizontal zones based on institutional volume action: Green Zone — Where institutional buyers defend the price.
Enigma 112
issam rahhal sabour
Enigma 112 Indicator - User Manual Enigma 112 Indicator Complete User Manual - Ultimate Trading Solution Introduction The Enigma 112 is a comprehensive multi-timeframe trading indicator that combines advanced technical analysis concepts including Tesla 3-6-9 Gates, Huddleston Theory, PO3 Dealing Ranges, and sophisticated risk management systems. Tesla 3-6-9 Gates Based on Nikola Tesla's vortex mathematics for precise support and resistance levels Huddleston Theory Volume-based market
VTrende Pro
Andrii Diachenko
5 (1)
VTrende Pro - MTF indicator for trend trading with a display panel for MT5 *** Videos can be translated into any language using subtitles (video language - Russian) Although the signals of the VTrende Pro indicator can be used as signals of a full-fledged trading system, it is recommended to use them in conjunction with the Bill Williams TS. VTrende Pro is an extended version of the VTrende indicator. Difference between Pro version and VTrende: - Time zones - Signal V - signal 1-2 waves -    S
Market makers' tool. The indicator analyzes volume from every point and calculates exhaustion market levels for that volume. ( This is a manual indicator and contains features that may not supported by the MetaTrader current testing environment ) Meravith main lines: - Bullish volume exhaustion line - serves as a target. - Bearish volume exhaustion line - serve as a target. - A line indicating the market trend. It changes color depending on whether the market is bullish or bearish and serves
ChartMaster Heikin Ashi with Pivot Indicator for MT5 Take your trading to the next level with ChartMaster Heikin Ashi with Pivot Indicator , a powerful tool that combines the clarity of Heikin Ashi candles with advanced pivot-point analysis. This indicator is designed for traders who want to identify market trends, reversals, and key support/resistance zones with precision. Key Features: Heikin Ashi Visualization – Smooths out market noise for cleaner trend identification. Automatic Pivot
The Second-Level Tick Candlestick Generator is a professional-grade MT5 indicator tool specifically designed for high-frequency trading and short-term scalping. It can convert raw tick data into highly customizable second-level candlestick charts in real-time, helping traders accurately capture micro-market fluctuations and optimize entry and exit timing. This tool provides clear chart displays, allowing you to more intuitively identify price action patterns and improve trading decision efficien
XCalper TFO
Aecio de Feo Flora Neto
This oscillator was developed exclusively by xCalper in 2015 based on moving averages calculations to indicate and try predicting oversold and overbought levels. The fast line (white, by default) oscillates basically between values -0.5 (oversold) and +0.5 (overbought). Whenever this line crosses upward value -0.5, it means an oversold price level. When it crosses downward value +0.5, it means an overbought price level. When fast line crosses value 0.0 and returns, it is a strong pull-back indic
The Expert Advisor and the video are attached in the Discussion tab . The robot applies only one order and strictly follows the signals to evaluate the indicator efficiency. Pan PrizMA CD Phase is an option based on the Pan PrizMA indicator. Details (in Russian). Averaging by a quadric-quartic polynomial increases the smoothness of lines, adds momentum and rhythm. Extrapolation by the sinusoid function near a constant allows adjusting the delay or lead of signals. The value of the phase - wave s
Классификатор силы тренда. Показания на истории не меняет. Изменяется классификация только незакрытого бара. По идее подобен полной системе ASCTrend, сигнальный модуль которой, точнее его аппроксимация в несколько "урезанном" виде, есть в свободном доступе, а также в терминале как сигнальный индикатор SilverTrend . Точной копией системы ASCTrend не является. Работает на всех инструментах и всех временных диапазонах. Индикатор использует несколько некоррелируемых между собой алгоритмов для класси
FFx Universal Strength Meter PRO is more than a basic strength meter. Instead of limiting the calculation to price, it can be based on any of the 19 integrated strength modes + 9 timeframes. With the FFx USM, you are able to define any period for any combination of timeframes. For example, you can set the dashboard for the last 10 candles for M15-H1-H4… Full flexibility! Very easy to interpret... It gives a great idea about which currency is weak and which is strong, so you can find the best pai
The FFx Universal MTF alerter shows on a single chart all the timeframes (M1 to Monthly) with their own status for the chosen indicator. 9 indicators mode (MACD-RSI-Stochastic-MA-ADX-Ichimoku-Candles-CCI-PSAR). Each can be applied multiple times on the same chart with different settings. Very easy to interpret. Confirm your BUY entries when most of the timeframes are showing green color. And confirm your SELL entries when most of the timeframes are showing red color. 2 Alert Options : input to s
The FFx Watcher PRO is a dashboard displaying on a single chart the current direction of up to 15 standard indicators and up to 21 timeframes. It has 2 different modes: Watcher mode: Multi Indicators User is able to select up to 15 indicators to be displayed User is able to select up to 21 timeframes to be displayed Watcher mode: Multi Pairs User is able to select any number of pairs/symbols User is able to select up to 21 timeframes to be displayed This mode uses one of the standard indicators
FFx Patterns Alerter gives trade suggestions with Entry, Target 1, Target 2 and StopLoss .... for any of the selected patterns (PinBar, Engulfing, InsideBar, OutsideBar) Below are the different options available: Multiple instances can be applied on the same chart to monitor different patterns Entry suggestion - pips to be added over the break for the entry 3 different options to calculate the SL - by pips, by ATR multiplier or at the pattern High/Low 3 different options to calculate the 2 TPs -
MetaTrader 4 version available here : https://www.mql5.com/en/market/product/24881 FFx Basket Scanner is a global tool scanning all pairs and all timeframes over up to five indicators among the 16 available. You will clearly see which currencies to avoid trading and which ones to focus on. Once a currency goes into an extreme zone (e.g. 20/80%), you can trade the whole basket with great confidence. Another way to use it is to look at two currencies (weak vs strong) to find the best single pairs
Currency Index Watcher is a simple and user-friendly tool for whoever wish to trade Forex using currencies indexes. Currency Index Watcher is configurable and usable directly from the panel. Indexes of 8 custom currencies EUR, USD, GBP, JPY, CHF, AUD, CAD, NZD (default) Any 3-chars symbol from your market watch could be used (BTC = bitcoin, RUB = ruble, CNH = yuan etc ...) : double click the symbol label  Ability to select which currencies and made-of pairs will be analyzed : check/uncheck wante
MetaTrader 4 version available here: https://www.mql5.com/en/market/product/25793 FFx Pivot SR Suite PRO is a complete suite for support and resistance levels. Support and Resistance are the most used levels in all kinds of trading. Can be used to find reversal trend, to set targets and stop, etc. The indicator is fully flexible directly from the chart 4 periods to choose for the calculation: 4Hours, Daily, Weekly and Monthly 4 formulas to choose for the calculation: Classic, Camarilla, Fibonac
Forex Relative Performance indicator This indicator calculates the relative strength of major currencies against the US dollar. The basic idea behind this indicator is "to buy strong currency and to sell weak currency". This indicator allows you to quickly identify the best forex pair to trade according to your trading style (Intraday, Scalping, Swing, or Long Term)
Pendiente de Precio
Cesar Juan Flores Navarro
Indicador en base a la pendiente de la linea de precio, dibuja una línea de color cuando sube a base de los precios que previamente has sido procesados o linealizados, y cuando baja la pendiente la linea linealizada toma otro color. En este caso se a considerado 6 lineas de diferentes procesos desde pendientes largas hacia las cortas, observándose que cuando coincidan las pendientes se produce un máximo o mínimo, lo que a simple vista nos permitirá hacer una COMPRA O VENTA.
WanaScalper
Isaac Wanasolo
1 (1)
A scalping indicator based on mathematical patterns, which on average gives signals with relatively small SL, and also occasionally helps to catch big moves in the markets (more information in the video) This indicator has three main types of notifications: The first type warns of a possible/upcoming signal on the next bar The second type indicates the presence of a ready signal to enter the market/open a position The third type is for SL and TP levels - you will be notified every time price re
Индикатор Coefficient Of Determination (COD) представляет собой значение коэффициента детерминации или квадрат коэффициента корреляции между зависимой переменной — ценой и объясняющей переменной — тиковым объемом. Что это дает нам на практике? COD отлично распознает кульминацию трендовых движений, что позволяет подбирать оптимальные точки и ловить развороты рынка. Как использовать индикатор: Наиболее популярная торговая стратегия строится совместно с трендовым индикатором Moving Average (MA), пе
More from author
Canal H Pro
N'da Lemissa Kouame
English – Canal H Pro Name: Canal H Pro – Support, Resistance & Breakout Short Description: Premium indicator with three dynamic lines (high, low, median) . Perfect for Breakout, Range, and trend following. Full Description: Red (High) → dynamic resistance Blue (Low) → dynamic support Yellow (Median) → balance and trend filter Automatic BUY/SELL signals on chart Adjustable period and colors Works on all strategies and timeframes Canal H Pro – spot key zones and take positions fast.
NuageTrend Pro
N'da Lemissa Kouame
Nuage Trend Pro – Trend Tracking & Kijun Signals Nuage Trend Pro is an advanced indicator for MetaTrader 5 , designed to quickly identify strong market trends and pinpoint optimal entry points through Kijun crossovers. Transform your charts into clear visual maps to trade with accuracy and confidence . Key Features Automatic Kijun Cross Detection : Instantly highlights key moments when price crosses the base line. Dynamic Trend Cloud : Your chart comes alive with intuitive colors – green f
Pin Bar Pro v1
N'da Lemissa Kouame
Pin Bar Pro v1.0 – MQL5 Indicator Description: Pin Bar Pro is a professional MetaTrader 5 indicator that automatically detects Pin Bars , a key candlestick pattern for anticipating market reversals. Signals are displayed as custom arrows directly on the chart: Blue arrow → Buy signal (bullish Pin Bar) Red arrow → Sell signal (bearish Pin Bar) Features: Automatic detection of Pin Bars Customizable visual arrows ( Arrow_Up_Code , Arrow_Down_Code ) Adjustable vertical offset ( Arrow_Offset_Pts ) W
Monthly Levels Pro
N'da Lemissa Kouame
ENGLISH – Monthly Levels Pro v1.0 The Ultimate Monthly Market Levels Indicator Master key market zones at a glance. Monthly Levels Pro helps you analyze long-term trends and spot essential support and resistance levels by automatically displaying the High, Low, Open, and Close of a monthly candle. Why Choose Monthly Levels Pro? Instant Analysis – See monthly levels immediately without checking candles manually. Smarter Trading – Spot reversal or breakout zones at a glance. Clear Visuals –
Indicator Monthly Levels + Pin Bar Pro Description The Monthly Levels + Pin Bar Pro indicator combines the power of monthly key levels (High, Low, Open, Close) with automatic detection of Price Action reversal patterns (Pin Bars) . Designed for technical and institutional traders, it helps anticipate market reaction zones and generates clear visual signals directly on the chart. Main Features Automatic monthly levels : High, Low, Open, Close. Pin Bar detection (bullish & bearish) in r
Yearly Levels Pro
N'da Lemissa Kouame
1️⃣ English – Yearly Levels Pro v1.0 Version: 1.0 Developer: KOUAME N'DA LEMISSA Platform: MetaTrader 5 (MT5) Type: Technical Indicator / Annual Price Levels Description: Yearly Levels Pro v1.0, developed by KOUAME N'DA LEMISSA, is a powerful indicator to quickly identify annual key price levels. It automatically calculates the Open, High, Low, and Close prices of a specific year and displays them on the chart with colored horizontal lines. Key Features: High (Red), Low (Blue), Open (Green), Cl
English Version Quarterly Levels Pro v1.0 – Commercial Notice Product Name: Quarterly Levels Pro v1.0 Developer: KOUAME N'DA LEMISSA Version: 1.0 Description: Quarterly Levels Pro , developed by KOUAME N'DA LEMISSA , is a professional indicator for MetaTrader 5 that automatically displays High, Low, Open, and Close levels of a quarterly period. It allows traders to clearly visualize key support and resistance zones on the chart, facilitating medium-term trading decisions. Main Features: Aut
English (Anglais) Description Multi-Timeframe Levels Pro v1.0 automatically plots key Daily, Monthly, Quarterly, and Yearly levels (High, Low, Open, Close) directly on your chart. These levels are essential for identifying strong supports, resistances, and breakout zones. Key Features Automatic display of Daily / Monthly / Quarterly / Yearly levels Clear and color-coded High, Low, Open, Close Customizable Shift to analyze past periods Works on all markets: Forex, Indices, Commodities, Stocks, Cr
Marubozu Pro MT5
N'da Lemissa Kouame
Commercial Description – Marubozu Pro (MT5) Description Marubozu Pro is a professional indicator for MetaTrader 5 that automatically detects Marubozu candles (bullish and bearish) directly on your chart. It helps traders identify strong market momentum where buyers or sellers take full control, by displaying clear visual arrows for buy and sell signals. This tool is designed to be simple, effective, and fast , perfect for manual trading or as a filter in automated strategies. Key Features
ETE Detector – Head & Shoulders Indicator Turn your charts into clear and actionable trading opportunities! About the Indicator The ETE Detector automatically identifies Head & Shoulders (H&S) and Inverse Head & Shoulders (IH&S) patterns — classic trend reversal formations. No more spending hours searching manually: your analysis becomes fast, accurate, and visual . What You Get Automatic detection of trend reversal patterns Colored arrows : green for buys (Inverse H&S), red for sell
Fusion Monthly Levels + PinBar + Marubozu Description This unique indicator merges three powerful technical analysis tools into one: Monthly Levels (High, Low, Open, Close) – to identify key support and resistance zones. PinBar Detection – a reliable reversal candlestick pattern signaling price rejections. Marubozu Detection – strong trending candles that indicate directional momentum. Thanks to this fusion, you get a visual, comprehensive, and responsive tool to anticipate market moves.
ABCD Lemissa + Monthly Levels + PinBar + Marubozu Indicator Description This indicator combines multiple powerful tools to provide a complete market overview: ABCD Lemissa – Automatically detects ABCD structures with points A, B, C, and D , support/resistance zones, and buy/sell arrows. Monthly Levels – Displays High, Low, Open, Close levels of monthly candles for identifying key zones. PinBar & Marubozu – Detects PinBar candles (reversal signals) and Marubozu candles (strong trend candles) w
Order Block Pro MT5
N'da Lemissa Kouame
Order Block Pro (MQL5) – Version 1.0 Author: KOUAME N'DA LEMISSA Platform: MetaTrader 5 Description: Order Block Pro is an advanced indicator designed to automatically detect bullish and bearish Order Blocks on your chart. By analyzing consolidation candles followed by strong impulsive candles, this tool highlights key areas where price movements are likely to accelerate. This indicator is perfect for traders who want to: Identify precise entry and exit points. Detect dynamic support and resist
ETE Detector v4.0 (Head & Shoulders) Author: KOUAME N’DA LEMISSA Version: 4.0 Platform: MetaTrader 5 Indicator Type: Chart / Visual Trading Signals Overview The ETE Detector v4.0 is a technical indicator designed to automatically detect classic and inverse Head & Shoulders patterns (H&S) on MT5 charts. These patterns are widely used to anticipate trend reversals. With this tool, traders can: Detect sell signals (classic H&S) and buy signals (inverse H&S) with accuracy. Easily visualize patterns
Avis commercial – ETE DETECTOR POWER v5.0 (Head & Shoulders Pro) Détection automatique des motifs tête et épaules ETE DETECTOR POWER v5.0 est un outil professionnel conçu pour les traders qui souhaitent anticiper les retournements majeurs du marché en utilisant l'un des modèles graphiques les plus puissants : le Head & Shoulders (H&S) et sa variation inverse. Grâce à son système de gestion d'objets optimisé (MaxObjects) , l'indicateur reste fluide et lisible, même sur des graphiques chargés
Dynamique mensuelle des plages hautes et basses v1.0 Auteur : KOUAME N'DA LEMISSA Description : L' indicateur dynamique mensuel de fourchette haute et basse affiche les niveaux mensuels clés sur votre graphique grâce à des fonctionnalités avancées de suivi dynamique. Il permet aux traders de visualiser facilement les zones de support et de résistance mensuelles, ainsi que les zones où le prix tend à dépasser ou à tester ces niveaux, offrant ainsi des opportunités de trading précises. P
Monthly High & Low Dynamic Range + Liquidity Zones v1.2 Author: KOUAME N'DA LEMISSA Description: Transform your market analysis with this powerful indicator that combines: Key Monthly Levels: High, Low, Open, and Close to identify the most important support and resistance zones. Dynamic High/Low Range: Automatically tracks extreme price movements to detect significant market shifts. Liquidity Zones: Visual rectangles showing areas where liquidity is concentrated (Buy/Sell). The thickness and c
Nom du produit :   Booster Trading Pro Auteur :   KOUAME N'DA LEMISSA Plateforme :   MetaTrader 5 Type :   Indicateur technique multifonction Description Transformez votre analyse de marché avec   Booster Trading Pro   , l'indicateur tout-en-un qui combine : Niveaux mensuels clés :   haut, bas, ouverture et clôture pour identifier rapidement les zones de support et de résistance. Plage dynamique haute et basse :   suivez les mouvements de prix extrêmes au-dessus ou en dessous des niveaux me
StructureBlocksAuto + MensuelOU La puissance de la structure rencontre la précision mensuelle Description Fusion StructureBlocksAuto + MonthlyOR est un indicateur tout-en-un avancé combinant la détection de la structure du marché (swings automatiques, plus hauts/plus bas et blocs de structure) avec le système Monthly Open Range (MOR) . Il offre une combinaison professionnelle d'analyse de la structure institutionnelle et de niveaux clés mensuels pour vous aider à détecter les zones de tradi
Channel Ultima
N'da Lemissa Kouame
Channel Ultima – Indicateur Multi-Canal Dynamique Description courte Channel Ultima est un indicateur avancé qui trace automatiquement trois canaux dynamiques du marché. Il offre une lecture claire des zones de support, de résistance et d'équilibre , idéale pour les traders techniques et structurels. Présentation détaillée Channel Ultima détecte et affiche trois canaux indépendants associés sur les pivots majeurs et mineurs du marché. Chaque canal représente une zone de pression sur le p
Carte de liquidité institutionnelle Pro Voyez ce que voient les institutions — avant tout le monde Aperçu Institutional Liquidity Map Pro est un indicateur professionnel conçu pour cartographier les zones de liquidité institutionnelle à l'aide des niveaux mensuels les plus hauts et les plus bas . Il détecte automatiquement les zones de stop-hunt , les zones de retournement potentiel et les zones d'accumulation/distribution institutionnelles . L'indicateur suit dynamiquement jusqu'à trois ni
Filter:
No reviews
Reply to review