Dynamic Volume Range Profile with Fair Value Zone
- Indicators
- Quang Huy Quach
- Version: 1.4
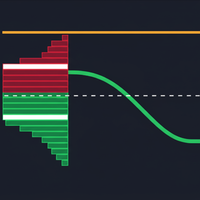
The "Volume Range Profile with Fair Value" (VRPFV) indicator is a powerful volume analysis tool designed to help traders better understand market structure and identify key price areas where significant institutional activity occurs. Instead of just looking at volume on individual candlesticks, VRPFV analyzes the distribution of volume by price level within a specific time range, providing deep insights into the "footprint" of smart money.
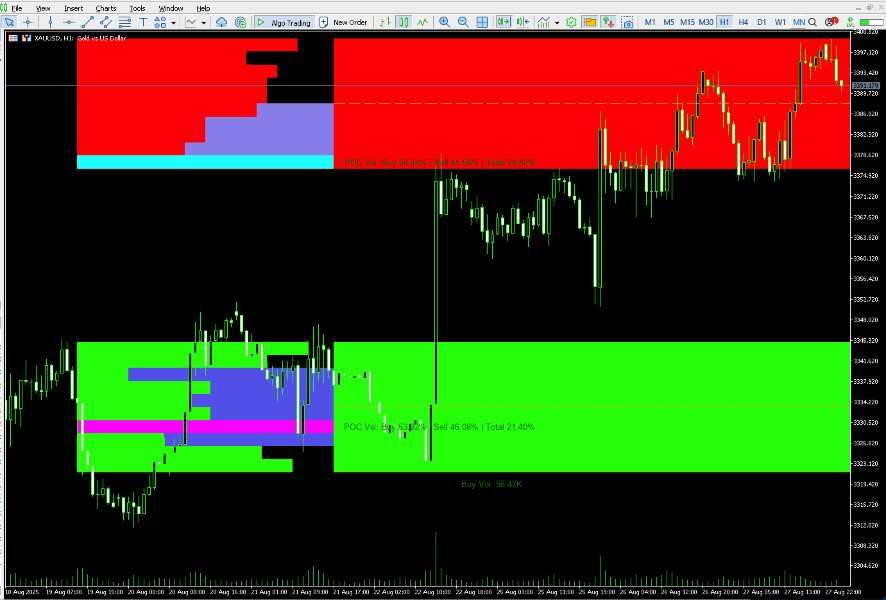
VRPFV consists of the following core components:
- Upper & Lower Volume Zones: The indicator focuses on analyzing volume within two specific price zones: an upper zone (often associated with selling pressure) and a lower zone (often associated with buying pressure) of the highest-low price range over a defined period.
- Point of Control (POC): Within each zone (upper and lower), the POC is the price level with the highest traded volume. This is the price level that the market has accepted the most within that zone, indicating high consensus between buyers and sellers.
- Fair Value Line: This is a moving average of the POC price of the upper zone. This line helps track the shift in the market's "fair value" over time. The line's color changes (green/red) to reflect the upward/downward trend of this value.
- Buy/Sell Volume Labels: These labels display the total accumulated buy or sell volume within each zone, helping you assess the overall buying or selling pressure in key areas.
- Value Area (VA): This is a newly added feature. The VA is the price range within which a significant percentage (default 70%) of the total traded volume in a zone has occurred. The VA is bounded by two levels:
- Value Area High (VAH): The highest price level of the Value Area.
- Value Area Low (VAL): The lowest price level of the Value Area. This area is colored differently for easy identification.
Input Parameters (Settings)
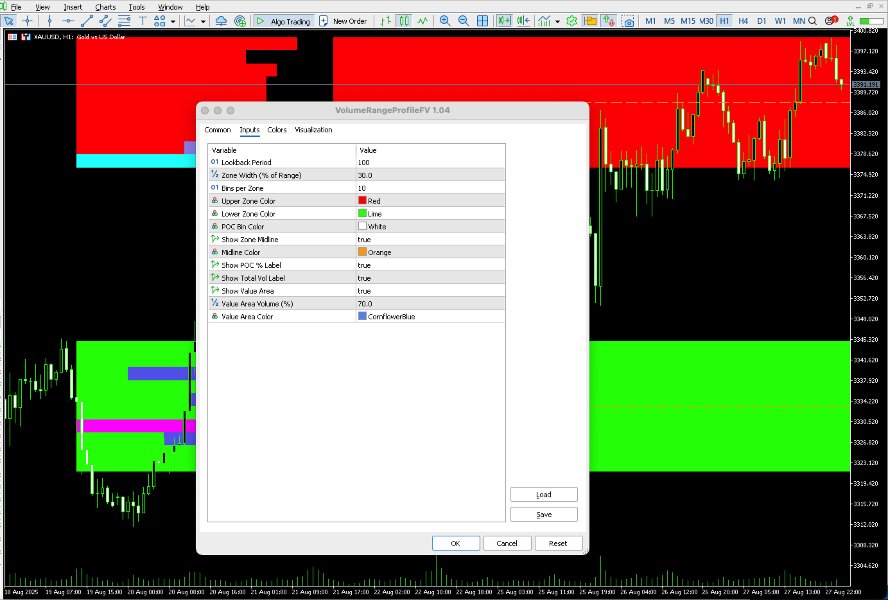
You can customize the VRPFV indicator through the following parameters:
- LookbackPeriod : The number of historical candlesticks used to determine the highest and lowest price range for the volume zones. A larger value creates broader zones and more stable volume profiles.
- ZoneWidthPct (Zone Width (% of Range)): The percentage of the total price range allocated to each volume zone. A smaller value makes zones narrower, focusing on extremes; a larger value expands the zones to cover more volume.
- BinsPerZone : The number of horizontal bins (bars) in each volume zone. More bins provide finer granularity for the volume histogram.
- UpperZoneColor : The background color for the upper volume zone.
- LowerZoneColor : The background color for the lower volume zone.
- PocBinColor : The color of the bin with the largest volume (POC).
- ShowMidline : Toggles the display of a dashed midline within each volume zone.
- MidlineColor : The color of the midline.
- ShowPocLabel : Toggles the display of the POC volume percentage label.
- ShowTotalLabel : Toggles the display of total buy/sell volume labels in each zone.
- ShowValueArea : Toggles the display of the Value Area (VA).
- ValueAreaPct : The percentage of volume required to define the Value Area (default 70%).
- ValueAreaColor : The background color for the Value Area.
How to Apply in Trading (Practical Application)
VRPFV provides deep insights into market behavior and can be applied in various trading strategies:
-
Identifying Market State: Trend or Range?
- Ranging Market (Balance): When the Value Areas (VA) of consecutive sessions overlap or are similar, it indicates that the market is in an accumulation or distribution phase. Traders often look for reversal trading opportunities at the edges of the VA (VAH and VAL).
- Trending Market (Trend): When the current session's VA significantly shifts away from the previous session's VA (e.g., today's VA is much higher than yesterday's VA in an uptrend), it signals a strong trend is underway. Traders will look for trend-following entry points, often when the price pulls back to previous VAH or VAL levels (now acting as support/resistance).
-
Identifying Dynamic Support and Resistance
- The VAH, VAL, and POC levels are very strong dynamic support and resistance levels. Price often tends to react when approaching these levels.
- POC: As the price level with the highest volume, it often acts as a magnet for price. Price tends to return to the POC.
- VAH/VAL: As the boundaries of the value area, they represent levels where the market begins to "reject" or "accept" new value.
-
Trading Strategies
- Range Trading: In a ranging market, you can sell when the price approaches VAH and buy when it approaches VAL, with the POC as a target.
- Breakout Trading: When the price breaks out of the Value Area and sustains itself outside, it signals a new trend. You can wait for a pullback to the broken VA edge to enter a trade in the direction of the breakout.
- 80% Rule: If the price opens outside the previous session's Value Area, then moves inside and stays within the VA, there is approximately an 80% chance that the price will move through the entire VA to test the opposite edge. This strategy provides clear entry, target, and stop-loss points.
-
Assessing Volume Pressure
- Buy/Sell Volume Labels: Help you quantify buying and selling pressure within each zone. Large buying volume in the lower zone and large selling volume in the upper zone reinforce the respective support/resistance zones.
- POC Vol %: Indicates the concentration of volume at the POC. A higher percentage suggests stronger consensus at that price level.
-
Fair Value Line
- Trend Identification: The slope of the Fair Value line indicates the trend of the market's "fair value." An upward slope (green) suggests increasing value, while a downward slope (red) suggests decreasing value.
- Dynamic Support/Resistance: The Fair Value line can also act as a dynamic support or resistance, especially in trending markets.





















User didn't leave any comment to the rating