ORB Seeker

4

特价促销,限量供应,保持产品稀缺性!

仅售 599 美元!

购买后请联系我以获取奖励的 ORB Seeker EA 和个人优化设置文件。


自信地捕捉干净利落的比赛片段!

ORB Seeker 是一款专业的开盘区间突破 (ORB) 指标,专为追求准确性、简洁性、灵活性和清晰图表结构的交易者而设计。

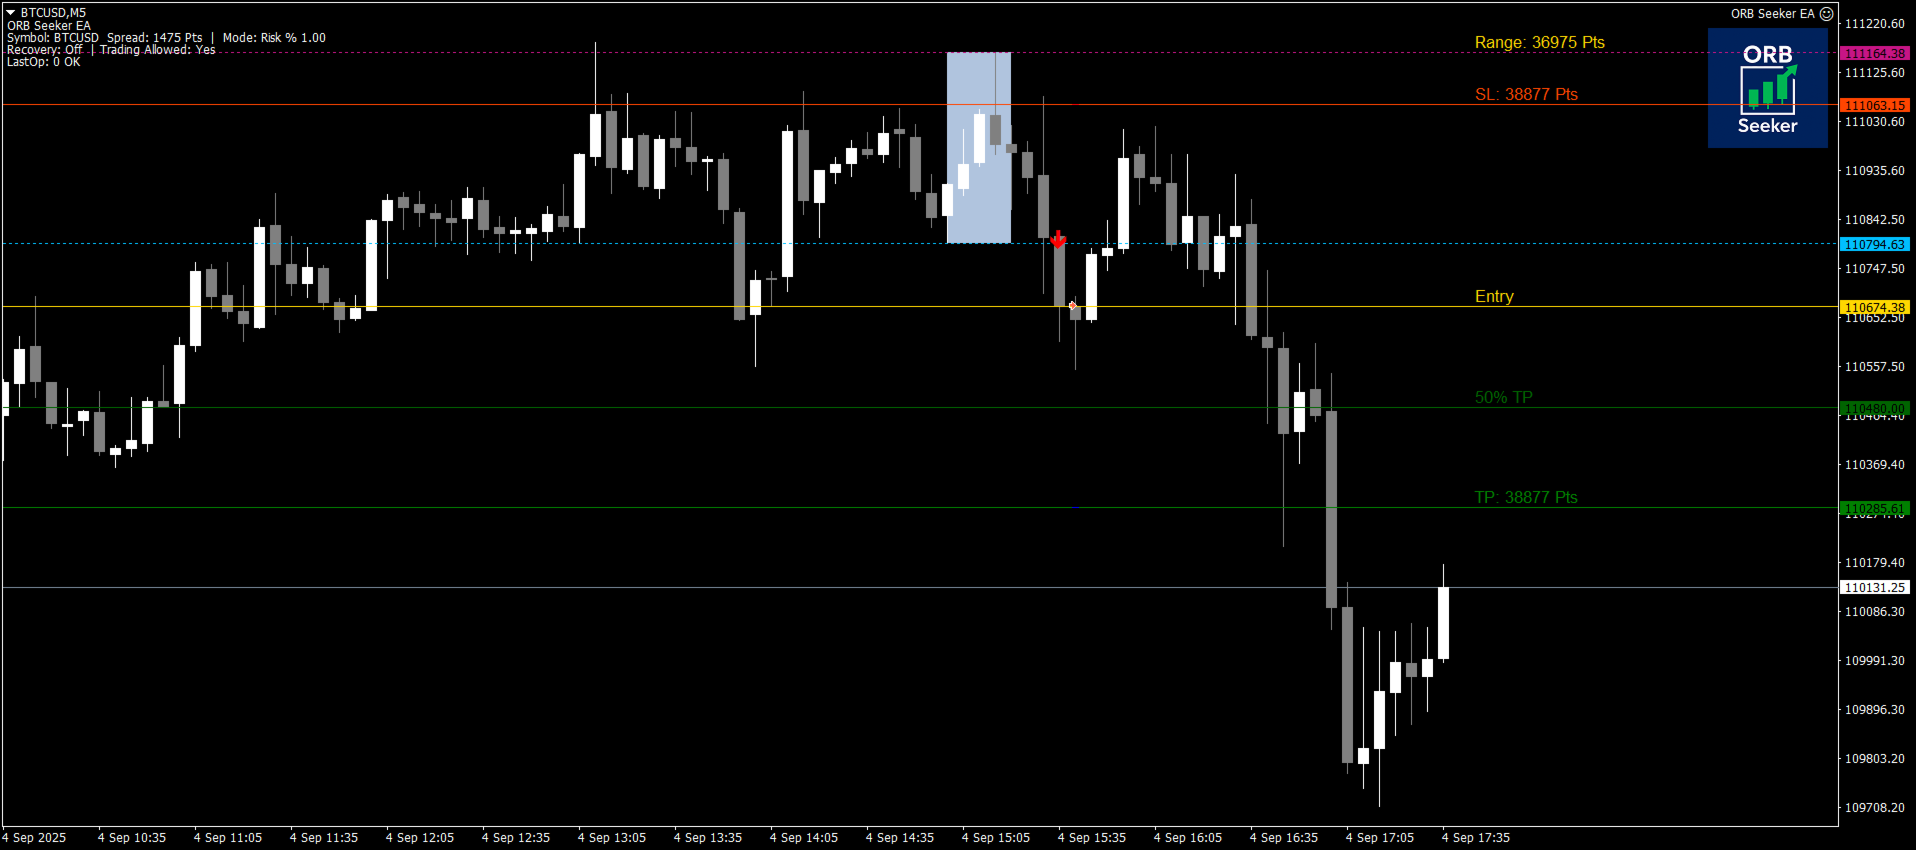
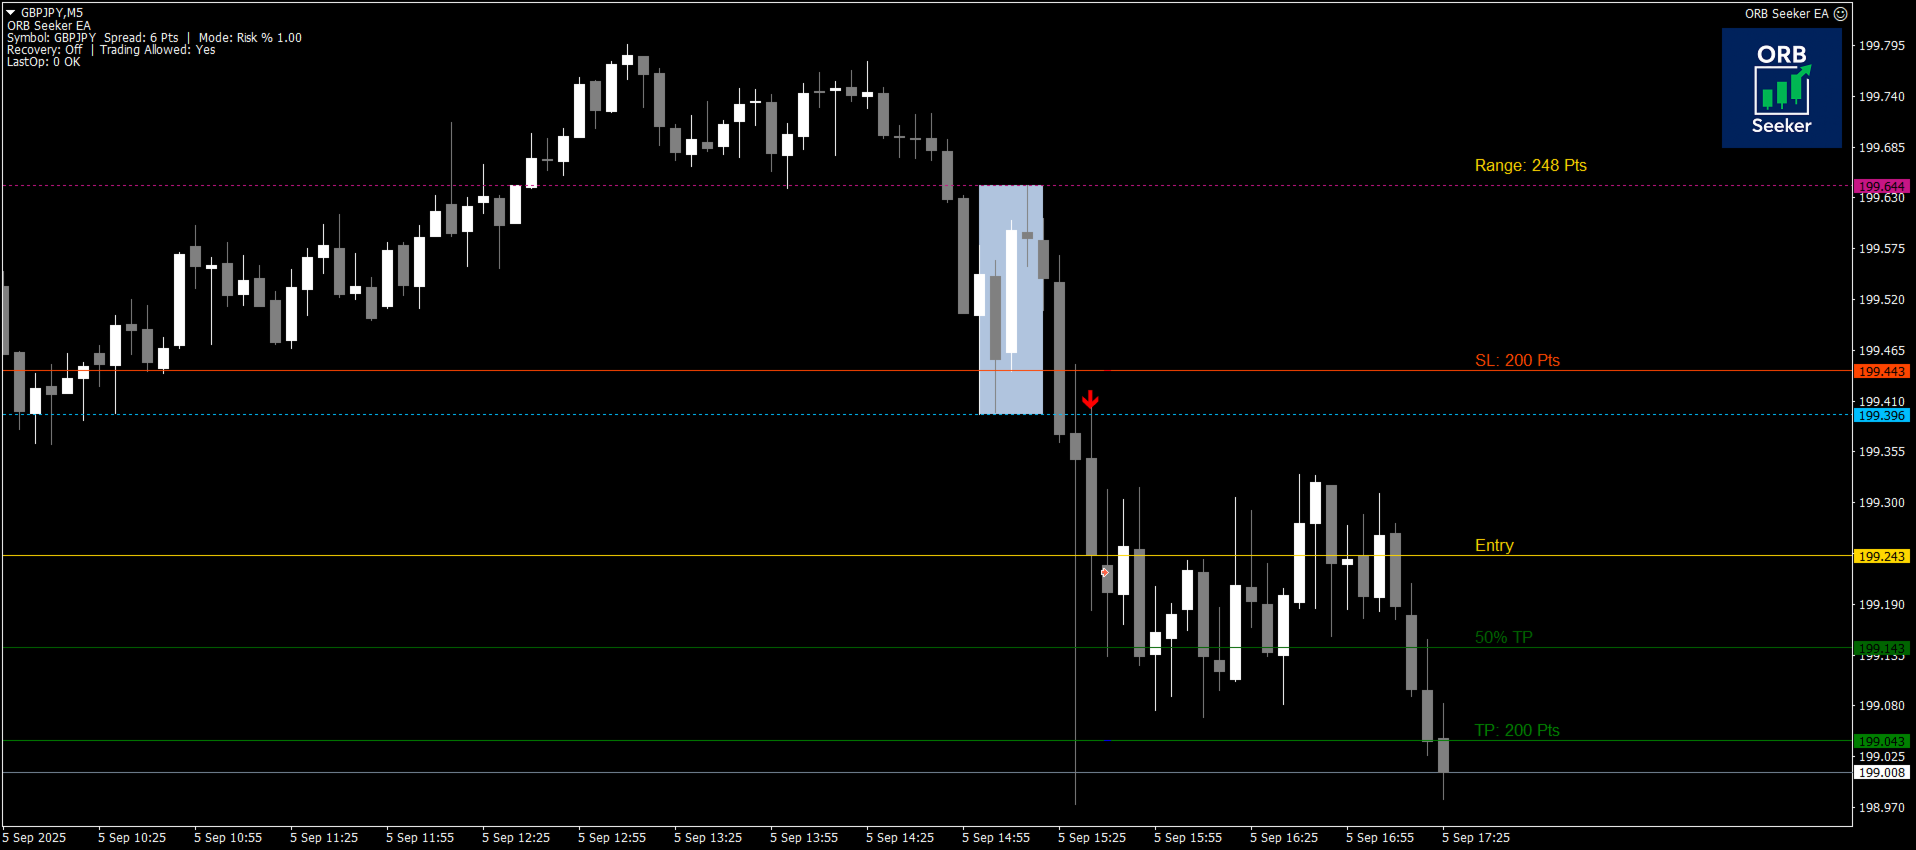
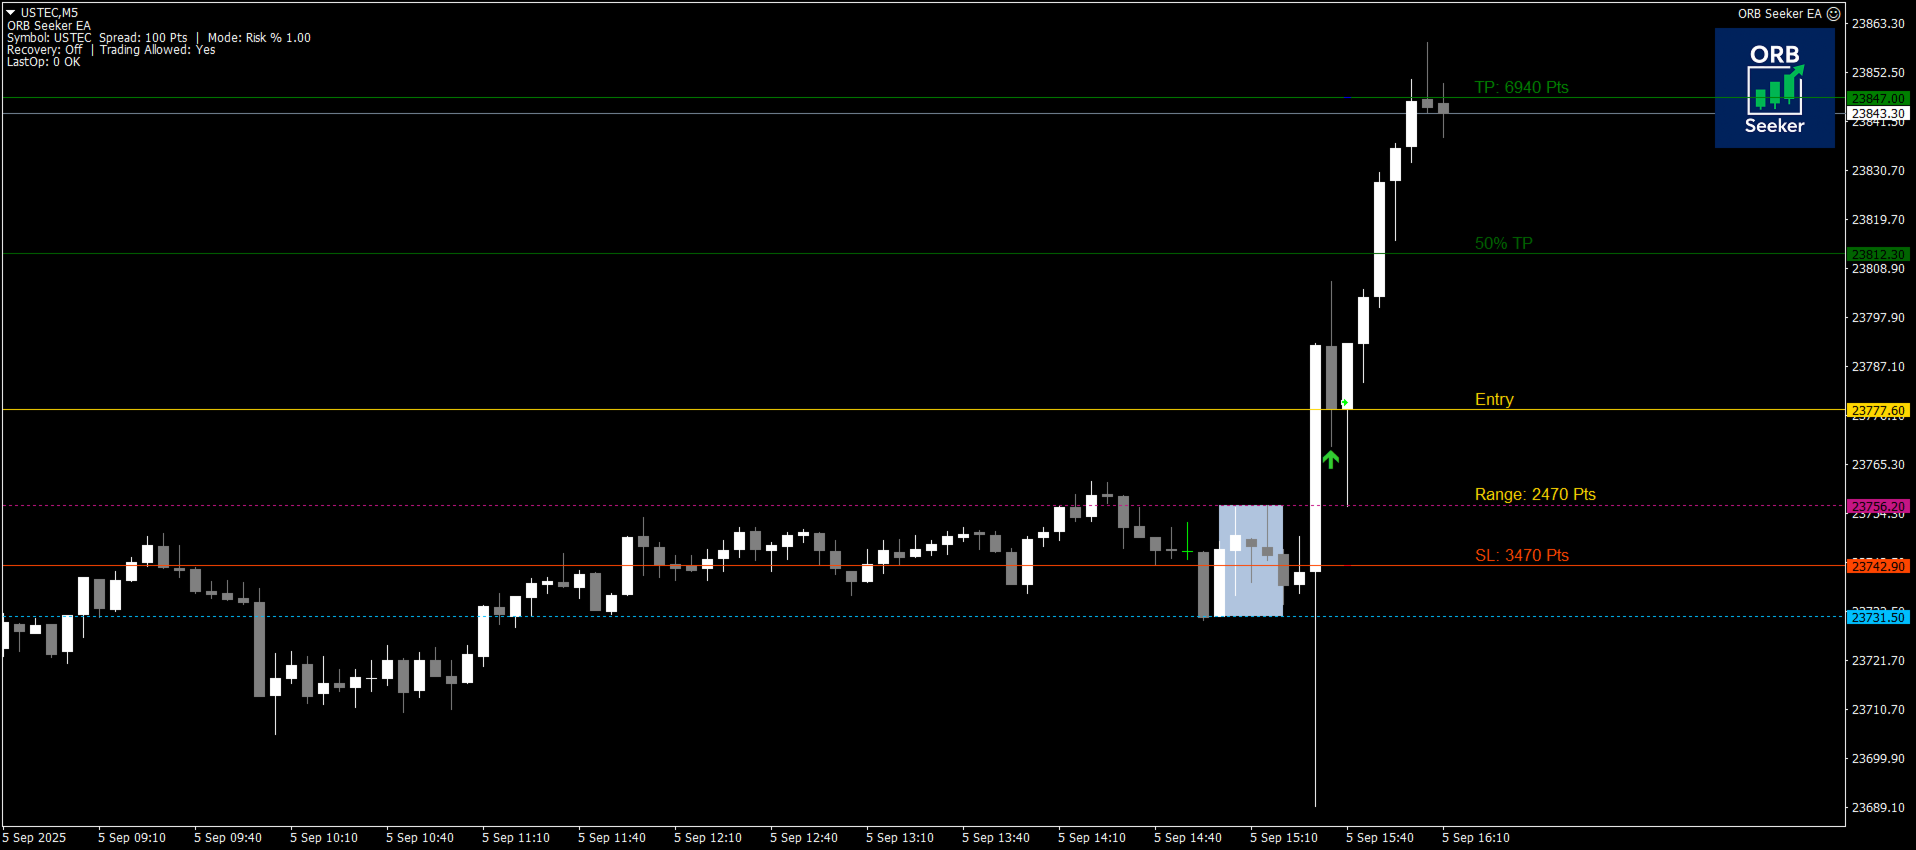
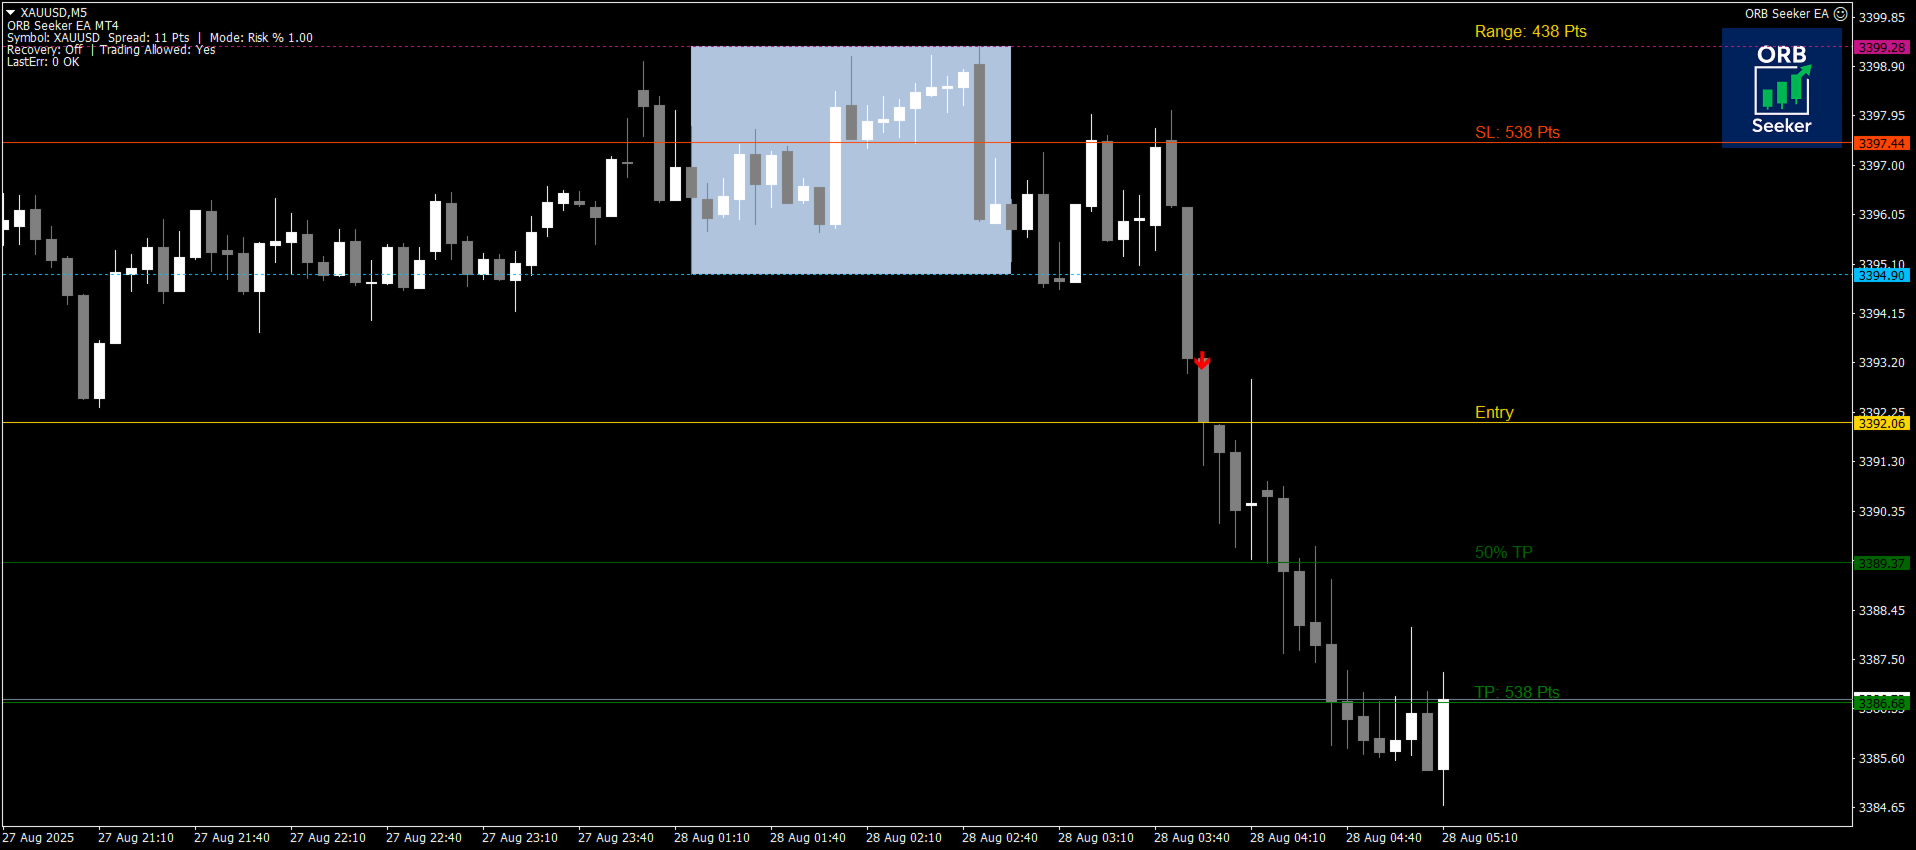
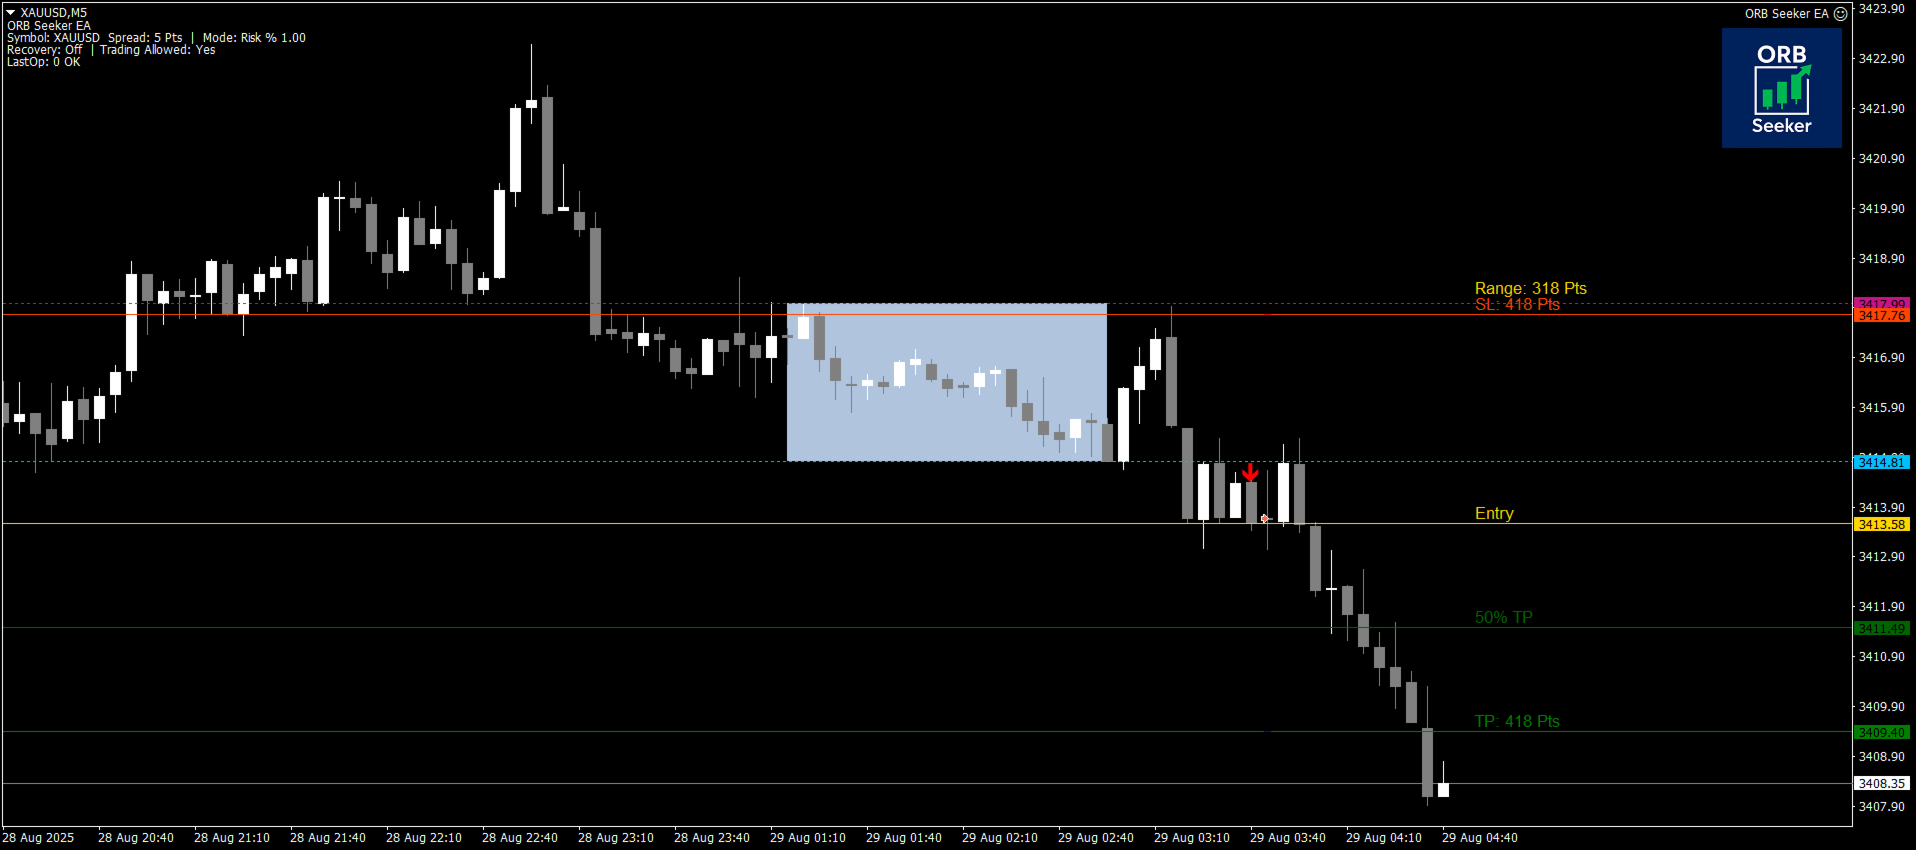
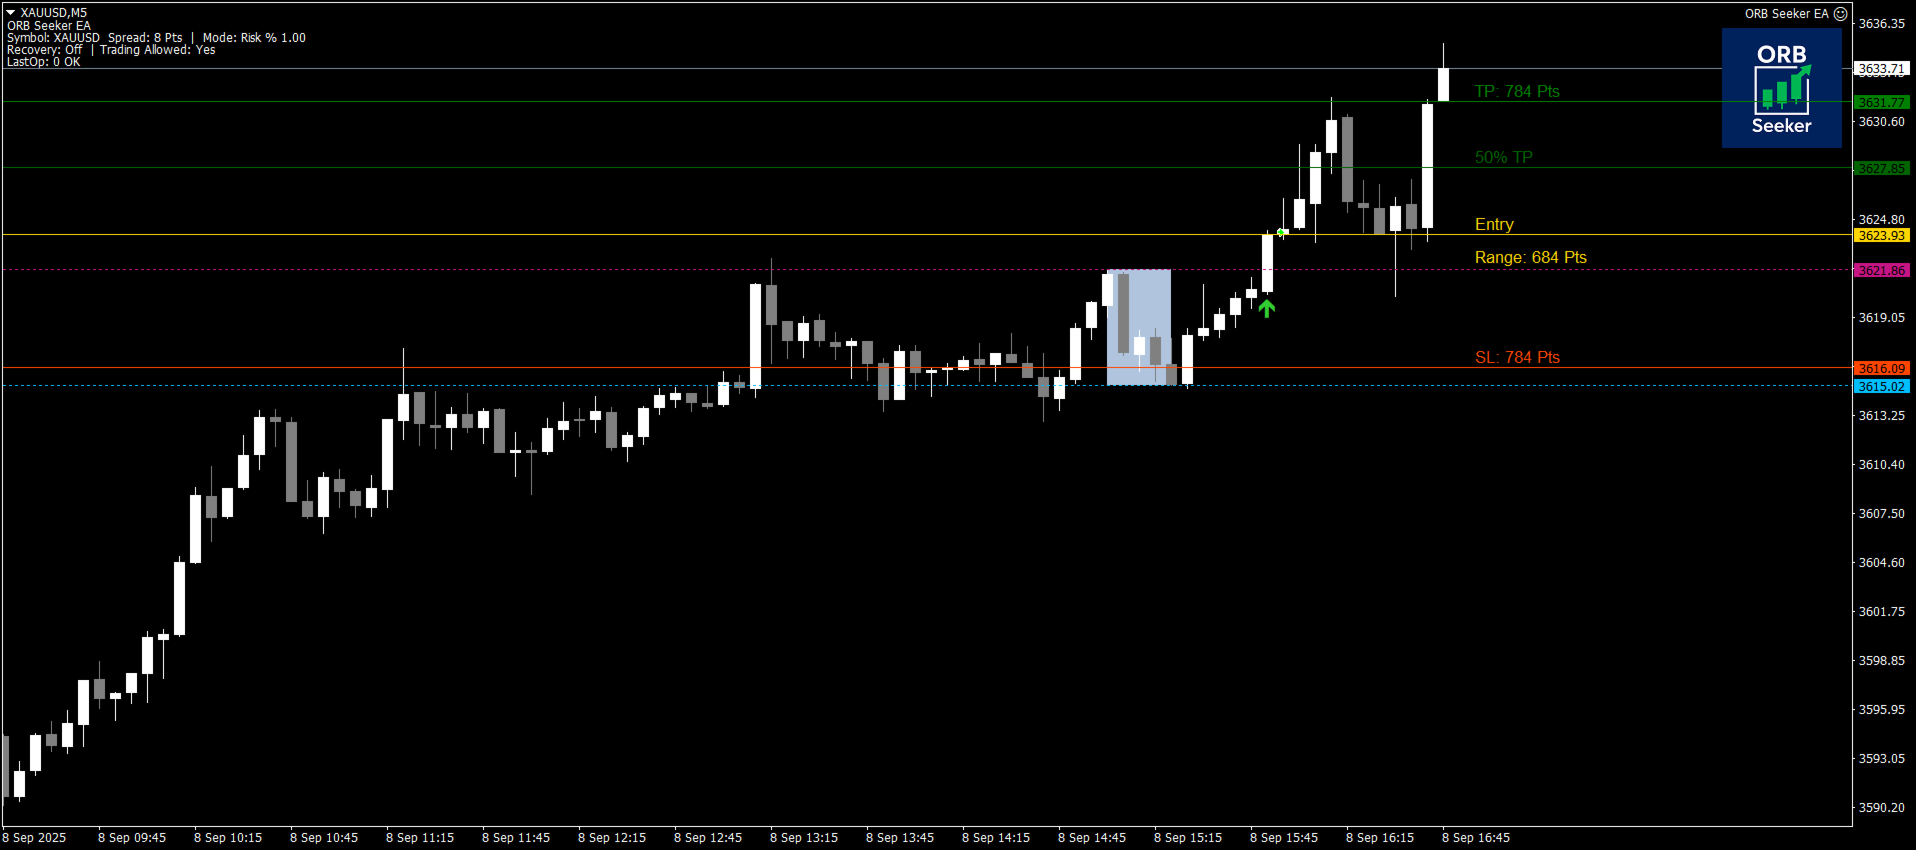
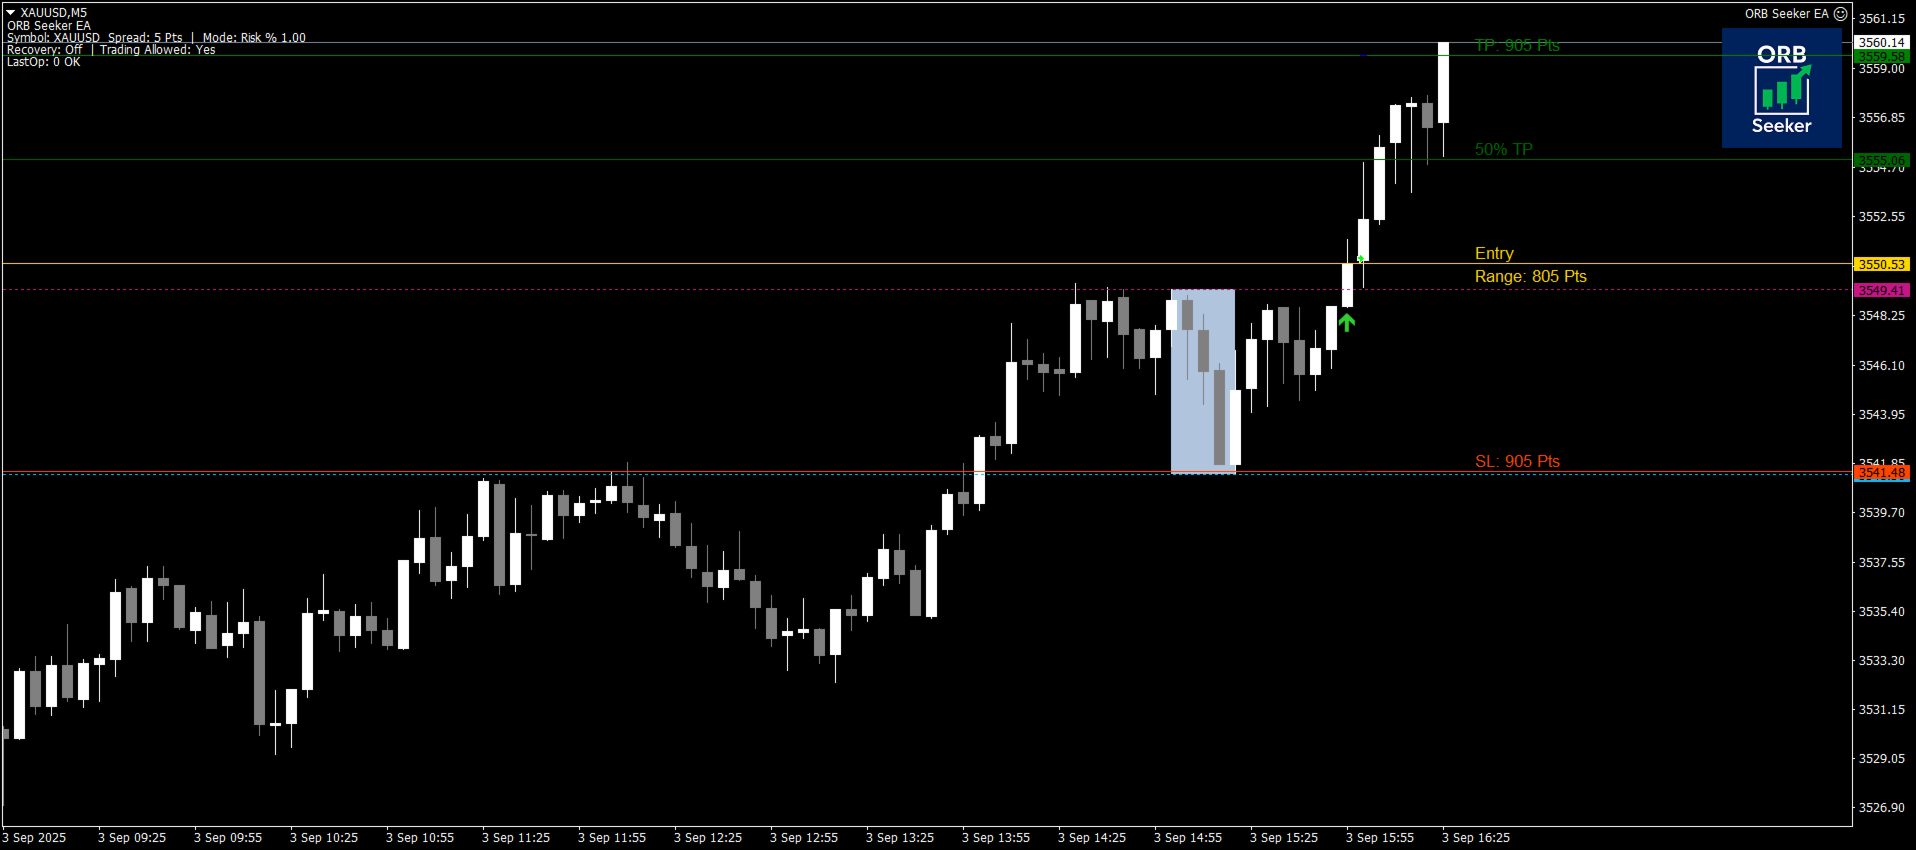
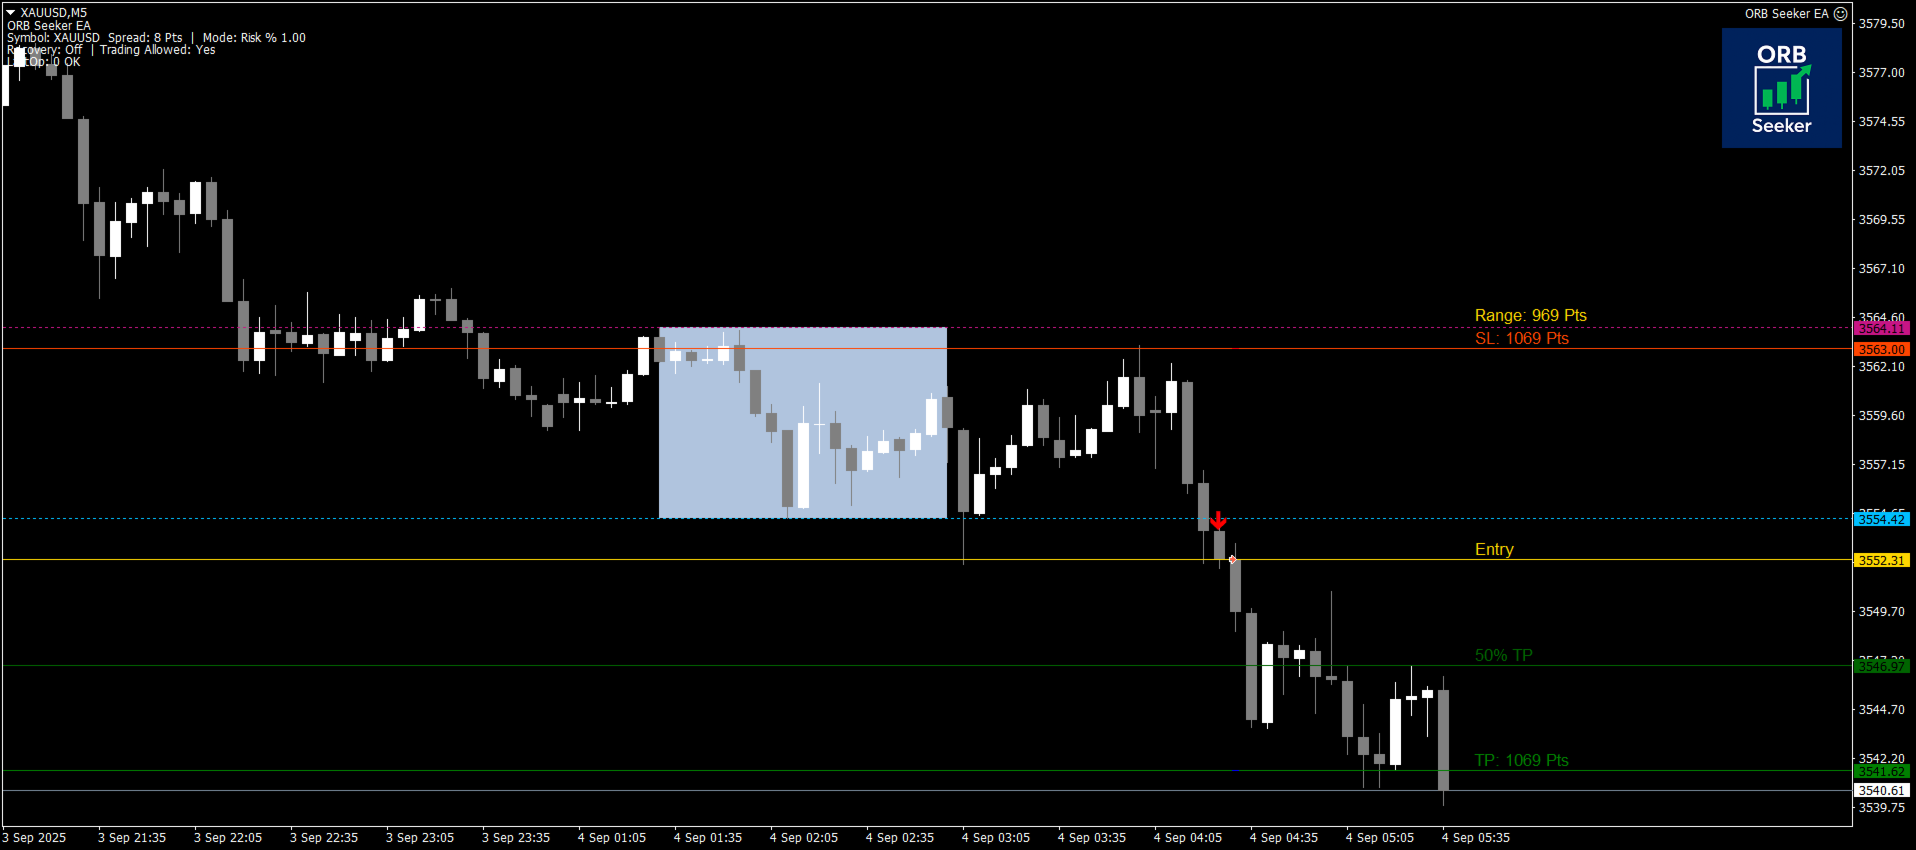
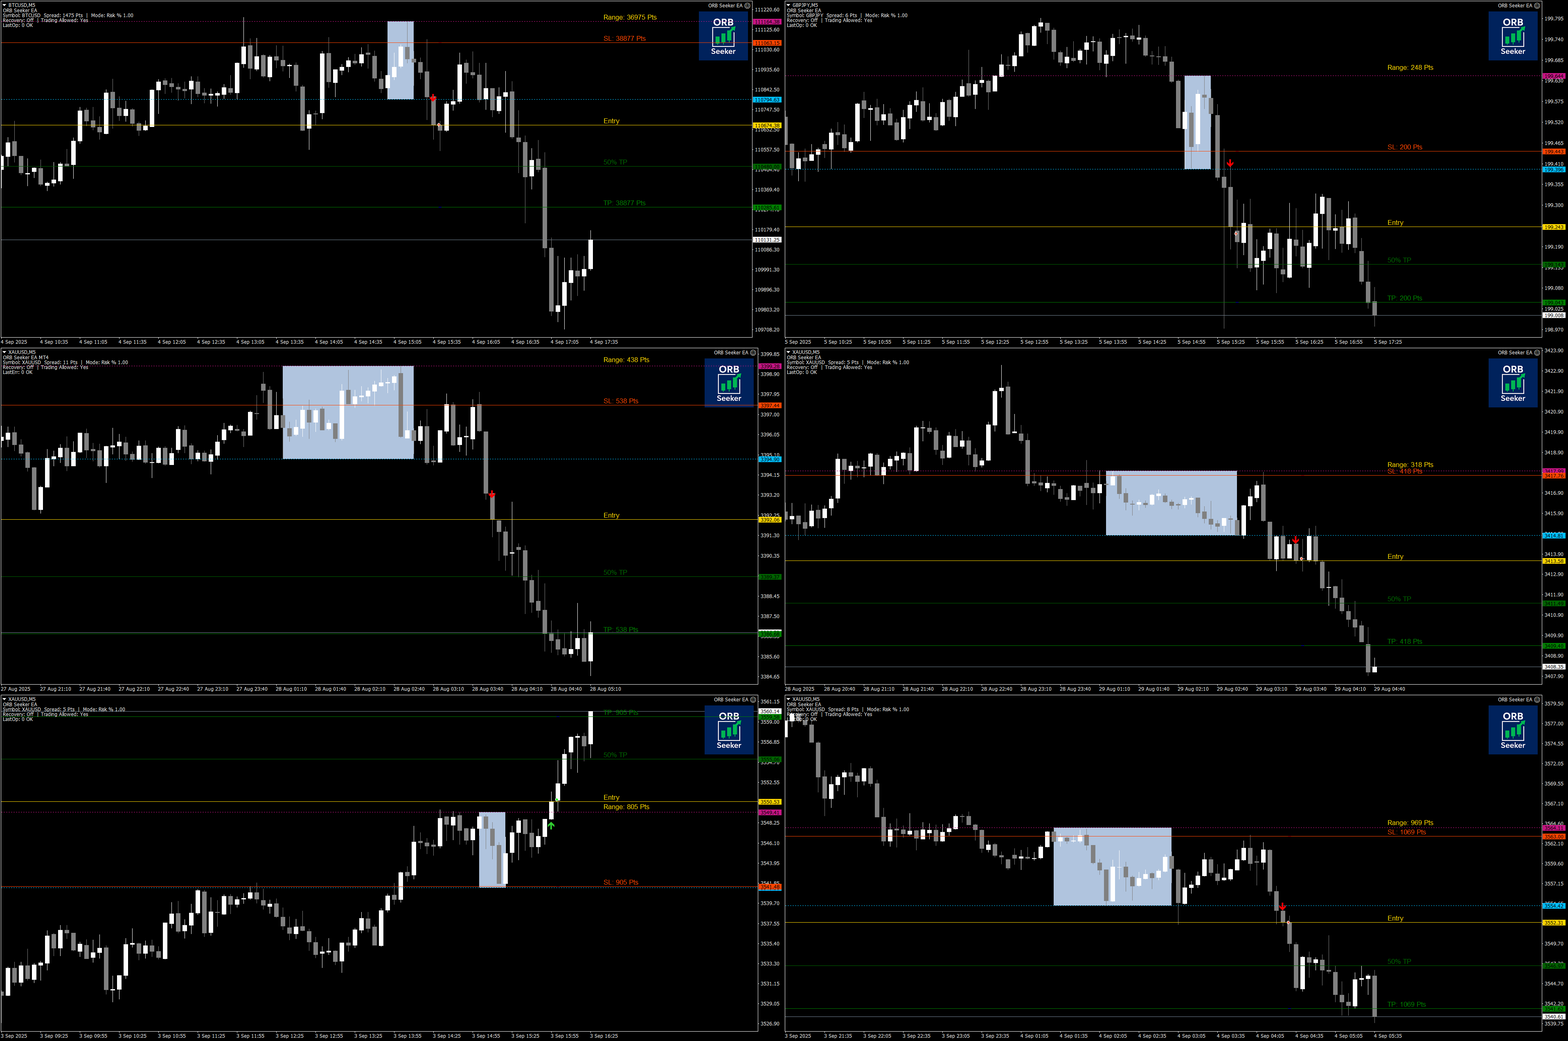
它能自动绘制任何交易品种的盘前或自定义交易时段区间,然后给出清晰的突破信号,包括入场点、止损点、止盈点以及可选的50%部分止盈位。所有数据均实时计算并直接显示在图表上。

您可以选择交易伦敦开盘、纽约交易时段、亚洲交易时段,或者您自定义的交易时段。ORB Seeker 会根据您选择的交易时段自动调整,让您精准掌握市场波动范围、突破位和交易位的位置。

每次购买均免费赠送 ORB Seeker EA 智能交易系统。该 EA 系统读取指标的突破信号并可自动下单,您可以选择手动交易,也可以让 EA 系统根据指标的信号逻辑自动处理入场。


为什么选择 ORB Seeker

  • 支持多个交易时段 -您可以自行设置伦敦、纽约、亚洲或自定义交易时段的盘前交易时间和交易时段。
  • 完整的突破视觉效果 -交易最高点和最低点线、范围框、突破箭头、入场线、SL/TP 标签,以及可选的 50% TP 标记。
  • 两种突破模式 -使用收盘突破进行K线确认,或使用触及突破进行更快的突破检测。
  • 回测/回调模式 -可选的回测逻辑通过等待价格回落到区间内,然后才接受新的突破,从而帮助过滤重新入场信号。
  • 灵活的止损/止盈选项 -选择固定止损/止盈、基于 ATR 的水平,或经典的 1:0.5、1:1、1:2 和 1:3 风险/回报目标。
  • 突破缓冲控制 -在会话最高点或最低点之外添加自定义缓冲,以减少过早的突破信号。
  • 内置过滤器 -使用 MA 趋势过滤器、RSI 动量过滤器和 VWAP 过滤器进行额外的交易确认。
  • 不重绘 -一旦触发有效的突破信号,该信号将固定在图表上。
  • 智能图表处理 -自动会话重置、清晰的对象管理,以及支持每个会话多个突破信号。
  • 完整提醒套件 -弹出式提醒、推送通知和包含交易详情的电子邮件提醒。
  • 附赠EA -使用附赠的ORB Seeker EA自动交易指标的突破信号。
  • 自营公司安全 -可安全用于自营公司评估和资金支持的交易账户。


推荐用途:

市场:外汇、商品、指数、加密货币和股票。

时间周期: M1、M5、M15、M30 和 H1。


ORB Seeker 专为希望以简洁实用的方式交易开盘区间突破形态的交易者而设计。您可以使用它进行手动交易计划、基于警报的交易,或使用附赠的免费 EA 进行自动执行。

如果您喜欢交易时段开盘和突破设置,ORB Seeker 可以在一个图表工具中为您提供完整的 ORB 结构:范围、突破信号、入场点、止损点、止盈点、警报和可选的自动化功能。

ORB Seeker 也非常适合自营公司评估和资金支持的交易账户使用。


重要提示

ORB Seeker是一款技术分析工具。它不保证盈利,所有交易决策均由您自行负责。市场状况、点差、波动性、滑点以及经纪商执行情况均可能影响交易结果。


ORB Seeker 仅通过官方 MQL5 市场销售。如果您在其他任何地方看到它,那都不是授权版本。


感谢您的支持。如果您有任何问题、想法或对未来更新的建议,请随时与我联系。我始终乐于接受使用该工具的交易者的宝贵反馈。
评分 1
Gabriele Bozzolan
348
Gabriele Bozzolan 2026.08.22 10:13 

I purchased the indicator in question on August 12, 2026, and installed it on my MT4, as is standard practice. I used the set file given to me by the indicator's owner, along with the free EA—and that's not something everyone gets for free. I want to clarify one thing: I only used the files given to me, never changed anything, and used the default settings. The following day, everything went well. On Friday, two stops in a row—that's understandable. I should point out that the stop losses are double the winnings. On Monday, nothing happened, for some reason. On Tuesday, two stops in a row, and I didn't like it. On Wednesday morning, I found myself with another two stops in a row. At this point, I decided to unplug everything, as I was dissatisfied with the results. Too many stops in a row, in three days. I repeat: I only used the settings given to me. I'm reporting this to the indicator's owner. A series of messages begins with these, in which I reiterate that I used the settings he sent me and that I haven't made any changes. Finally, I say I'll leave a negative review for the indicator. The owner responds: I'm not cooperating, the indicator is profitable, as I told you, I'm using it myself and I'm not losing money, so there's something wrong on your end. What do I have to do with this? As I've said several times, I only used the settings provided to me, as they were. The owner adds: Users never like to admit they're wrong, they always blame the product. It's a shame. I repeat for the umpteenth time: what do I have to do with this? I only used the recommended settings. I reply to the messages the owner of the indicator sent me, confirming that I will leave a negative review and that I will no longer respond to his messages. He responds: You're responding like someone who doesn't want to admit they're at fault, that's fine, it's common human behavior. I know I'm right because the indicator is profitable; even last night I won and had more wins than losses. So why are you losing, while I and my other users are winning? Logic suggests that something is wrong on your end, whether you like it or not. Furthermore, you've only been using the indicator for a week. A week is not enough time to properly evaluate a product, especially if you haven't tested it first on a demo account to familiarize yourself with all its features. To understand if a product really works, you need to give it more time; every professional trader knows this. You're not cooperating, and if you continue to leave a negative review, as you're threatening, I'll simply respond with the truth and publish all the screenshots of this conversation so everyone can see the entire history and understand that your negative statement is false and that I'm not hiding anything. I wish you'd let me help you so you can try the indicator like me and other users, but you don't want to. It doesn't have to be this way; I want all my users to be happy. I'm sorry I tried. I'm replying to this last message I received, published in its entirety. I never threatened anyone; the threats are different. I simply stated what happened to me with the indicator, and nothing more. Feel free to publish all the conversations I had with him; I have nothing to fear. Everyone who reads this review should make their own assessment.

推荐产品
DFX InteliTrade Shark PRO
Ibrahim Dabai Molloud Hassane
DFX InteliTrade  Shark PRO v6 Special Edition User Manual &  Comprehensive Guide 1. Indicator Overview Product Name: DFX InteliTrade Shark PRO v6 Developer: Dr. Hassane Dabai (Finance Engineer) ,dr.dabai@gmail.com |+(966)59-730-4266 Latest Version: v6 (September 2025) Platform: MetaTrader 4 (MT4) 2. Brief History & Philosophy The DFX InteliTrade Shark PRO is the culmination of 16 years of research and development (since 2009). It evolved from a basic trend-following system into a sophistica
TradeLogic Pro – The Advanced MT4 EA for Long Term Investing TradeLogic Pro   is an advanced   MetaTrader 4 Expert Advisor (EA)   designed to harness the power of price imbalances in the forex trading markets. Whether you’re a beginner or a professional trader,   TradeLogic Pro   uses sophisticated market analysis to identify high-potential entry points, allowing you to trade smarter and more efficiently. How Does TradeLogic Pro Work? At the core of   TradeLogic Pro   is its ability to   detect
标题:MARSI Pro - 自适应RSI/MA马丁格尔交易系统 系统描述: MARSI Pro   是一款专为MetaTrader 4设计的先进自动化交易系统,结合趋势跟踪与均值回归策略,并配备严格的风险管理模块。适用于外汇市场,核心功能包括: 核心组成: 混合信号生成 移动平均线(MA)突破 :通过价格与自定义MA的交叉识别趋势反转。 RSI确认 :利用RSI超买/超卖水平过滤虚假信号。 马丁格尔逻辑 :亏损交易后动态调整仓位,盈利后自动重置初始手数。 风控引擎 保证金安全检测 :开仓前自动验证可用保证金。 亏损限制 :单笔交易潜在亏损限制为账户余额的设定百分比(默认5%)。 手数标准化 :根据经纪商规则自动调整交易量。 自适应交易逻辑 防重叠保护 :避免同一方向连续开仓。 智能重置机制 :盈利或风险过高时自动重置马丁格尔序列。 关键特性: 策略类型 :趋势跟踪 + 反向确认 指标 : 移动平均线(SMA/EMA) 相对强弱指数(RSI) 风控功能 : 可调最大风险(%) 固定止盈/止损(点基) 马丁格尔倍率(默认2倍) 兼容性 :优化适用于欧元/美元(EURUSD)、英镑/美元(
The Trend Professor is a moving average based indicator designed for the purpose of helping the community of traders to analyse the price trend. The indicator will be displayed in the main chart as it is indicated on the screenshot section. How it works The indicator has lines of moving averages and colored histograms to depict the direction of the trend. There will be a fast signal line colored blue/yellow/red at some points. The red/yellow colored lines stands for bearish trend/signal while th
Stufic
Tomas Hruby
5 (1)
Stufic is a result of the long way of development. It was created for use in the management of capital of trading groups. The main idea is to preserve capital through unexpected fluctuations of the markets. It is one of the system that can perform on 90% of currency pairs. It's a participant on World Cup Trading Championship 2016 with real 10K USD. Stufic was also between top five traders in real money contest organized by Fidelis Capital (November 2015, Gain +48%). Why should you have to choos
Hermes Gold PRO
Igor Pereira Calil
HERMES 專家是 Meta Trader 的機器人,其目標是根據機器人自身的趨勢和策略進行工作。 免費安裝 HERMES GOLD PRO 並在您的帳戶上運行,請私訊詢問我。 時間範圍使用建議:H1 HERMES 是為處理美國金屬 XAUUSD(黃金)而開發的。 HERMES 是一位長期的果斷倒賣專家,因此,他可以停留 1、2、3 天而不進行交易,具體取決於他的「風險(配置)」的價值,但是,不用擔心,請閱讀以下內容! 由於其入場和倒賣(空頭)平倉的自信,它具有低/或零回撤(在標準設置下)的強大能力。 您可以將 HERMES 留在您的帳戶中,甚至可以呼叫其他專家(機器人)來使用它,不會有任何問題。 記得不要使用高風險配置(低配置值),我會解釋一下: 我們在機器人設定中: RISK:此預設值為0.05,即會開2.5手的訂單。 如何計算風險:您的資本(例如 50,000)(x)風險(0.5)(/除)除以 100,結果 250 = 2.5 手。 $1,000 資本範例 (x) 0.5 = 500 (/) 100 = 5(在這種情況下,機器人將使用 0.05 手) PIPS
Night Hunter Pro
Valeriia Mishchenko
4.38 (53)
EA has a  live track record  with many months of stable trading with  low drawdown : All Pairs 9 Pairs Night Hunter Pro is the advanced scalping system which utilizes smart entry/exit algorithms with sophisticated filtering methods to identify only the safest entry points during calm periods of the market. This system is focused on a long-term stable growth . It is a professional tool developed by me years ago that is constantly updated, incorporating all the latest innovations in the trading a
Adx open calculed
Teresinha Moraes Correia
Custom ADX Indicator Based on Open Price Only The standard ADX indicator is usually calculated using the High, Low, and Close prices. This produces a smooth and visually appealing line that represents price action. However, ️ it lacks precision — as the candle moves, the ADX, +DI, and -DI values also change suddenly, potentially triggering false signals based on the candle’s initial plotting. A curious observation: even when the input is modified to use the Open price in the indicator se
Ksm: Smart Solution for Automated Forex Trading Ksm is a tool designed for automating Forex trading, using modern methods of time-series data analysis to work with multiple currency pairs across different timeframes. Key Features and Benefits Multi-currency support : Ksm enables trading across multiple currency pairs, helping traders adapt their strategies to various market conditions. New currency pairs can be easily added. Time-series data analysis : Utilizing advanced algorithms, Ksm analyzes
Gold Crazy EA MT4
Nguyen Nghiem Duy
Gold Crazy EA   is an Expert Advisor designed specifically for trading Gold H1/ EU M15. It use some indicators to find the good Entry. And you can set SL or you can DCA if you want. It can be an Scalping or an Grid/ Martingale depend yours setting. This EA can Auto lot by Balance, set risk per trade. You also can set TP/ SL for earch trade or for basket of trade. - RSI_PERIOD - if = -1, then the default strategy works, if >0, then the RSI strategy works - MAX_ORDERS - to trade with only 1 order,
Weddell Pro
Dmitriy Kashevich
Weddell Pro is a good trading tool that is suitable for both a beginner and an experienced trader. It can be used both separately and combined with other strategies and indicators Configured for currency pairs was tested several times on cryptocurrency but did not show a high result Currency pairs USD/EUR AUD/CAD GBP/USD Showed itself very well here The percentage of correct transactions is above 68%, which does not make it perfect and bad Doesn't draw or disappear The red arrow shows a t
Market Structure Zig Zag
Lesedi Oliver Seilane
4.66 (29)
Free Market structure zig zag to assist in price action trading the screenshots describe how to use and how to spot patterns new version comes with alerts, email alert and  push notification alert can be used on all pairs  can be used on all timeframes  you can add additional confirmation indicators the indicator shows you your higher high and low highs as well as your lower lows and lower highs  the indication makes price action analysis easier to spot.
FREE
Impulse fractals indicator - is counter-trend oriented complex market fractal pattern.  Market creates bull/bear impulse, trend starts, fractals on impulsed wave are an agressive pullback signals. Buy arrow is plotted when market is bearish and it's impulse showed up-side fractal, and sell arrow is plotted when market is bullish and it's impulse showed dn-side fractal. Main indicator's adjustable inputs : impulsePeriod - main period of impulse histogram  filterPeriod  - smoothes impulse accordi
TPO Profile MT4
Kyra Nickaline Watson-gordon
5 (1)
Definition : TPO is a Time Price Opportunity. Instead of using bars or candles with an Open, High, Low, and Close price, each "bar" in a Market Profile is represented by horizontal bars against the price It is called Market Profile terminology. In other words time-price-opportunity (TPO) profiles are histograms of how much time was spent at each price within the span of the profile. By using a TPO chart, you are able to analyze the amount of trading activity, based on time, for each price level
Buzzer Gold EA
Sukhpreet Singh Bedi
Buzzer Gold EA for MT4 Automated Expert Advisor for XAUUSD (Gold) Buzzer Gold EA is an automated Expert Advisor (EA) developed for MetaTrader 4 (MT4). It is designed primarily for trading XAUUSD (Gold) on the M5 timeframe using a rule-based trading methodology combined with configurable money management and risk control features. The EA continuously monitors market conditions and executes trades automatically when its predefined trading criteria are satisfied. It is intended for traders who pre
ForexEagle
Hadj Ahmed Slimani
ForexEagle - Elevate Your Trading Experience to New Heights Ready to revolutionize your trading game? Introducing ForexEagle, the ultimate Expert Advisor meticulously crafted to dominate the GBPUSD, AUDCAD, USDCAD markets on the M5 timeframe. With a winning combination of advanced Price Action strategy and trend detection algorithm, ForexEagle is your go-to tool for unlocking the full potential of GBPUSD, AUDCAD, USDCAD trading. The EA operates during specific hours, from 12:01 AM to 11:59 PM. G
Stellar Trend Pro
Ignacio Agustin Mene Franco
StellarTrend Pro is a professional Expert Advisor specializing in trading XAUUSD (Gold) on the M5 timeframe. Developed with a clear and robust trend-following and momentum strategy, it combines classic technical analysis with proven breakout systems, all within a beautiful, space-inspired visual theme. Key Features Hybrid Trend and Momentum System: Trend + RSI Momentum: Trend EMA (50) combined with RSI (14) to confirm momentum. It only trades when the trend and momentum are aligned, avoiding
KT Advanced Ichimoku MT4
KEENBASE SOFTWARE SOLUTIONS
KT Advance Ichimoku plot the arrows and provide alerts for the four trading strategies based on Ichimoku Kinko Hyo indicator. The generated signals can be filtered by other Ichimoku elements.  Four Strategies based on the Ichimoku Kinko Hyo 1.Tenkan-Kijun Cross Buy Arrow: When Tenkan-Sen cross above the Kijun-Sen. Sell Arrow: When Tenkan-Sen cross below the Kijun-Sen. 2.Kumo Cloud Breakout Buy Arrow: When price close above the Kumo cloud.  Sell Arrow: When price close below the Kumo cloud. 3.C
Dear Trader It is my pleasure to introduce to you my tool called the " Forex Sniper Indicator" . The major aim of this tool is to help serious traders and investors in all type of Financial Markets to catch price next movement right at the moment the price direction is about to change. This tool can be used to snipe the price direction in both down trend, uptrend and ranging markets. This tool can be used as the stand alone tool though it may be combined with other tools as well. My goal is to h
BRAHMASTRA - 基于古印度数学的MetaTrader 4智能交易系统 BRAHMASTRA是一款全自动MetaTrader 4智能交易系统,基于五大古印度数学体系,构建为统一的信号汇聚引擎。只有当五大系统中至少三个同时指向同一方向时,才会开仓。 五大神圣系统 宾伽罗斐波那契(公元前2世纪) — 基于34根K线计算斐波那契回调区间(0.236–0.786)。价格接近0.618/0.786时产生买入信号,接近0.236/0.382时产生卖出信号。 查克拉瓦拉周期探测(公元7世纪) — 基于CCI的周期振荡器,识别动量反转。 婆罗摩笈多插值法(公元628年) — 基于三个历史枢轴点的二阶价格插值,衡量方向动量。 阿耶波多信号引擎(公元499年) — RSI结合双EMA交叉,价格确认后产生信号。 潘查布塔多周期偏向 — 过滤逆宏观趋势的交易(H4和H1)。 纳瓦-苏特拉恢复系统 亏损后自动激活,使用黄金比例乘数(1.618)计算恢复手数。最多9步恢复,盈利后立即重置为基础手数。 交易管理 动态止损/止盈 — 基于ATR自适应波动率 黄金追踪止损 — 步长61.8点 保本管理 — 盈利
Pocioli
Mike Amega
Pocioli X  The Smart AI That Trades for You Trade Smarter. Profit Faster. Relax More. Say hello to Pocioli X, the next-generation AI trading robot designed to think, learn, and adapt just like a professional trader. Unlike traditional robots that follow fixed rules, Pocioli X evolves with the market. It studies patterns, learns from every move, and adjusts its strategy automatically to keep you ahead  whether you trade Forex, Crypto, Indices, or Commodities. Why Traders Love Pocioli
Extreme Reversal EA EA is designed to trade CS ATR Fibo Channels Indicator :  https://www.mql5.com/en/market/product/60415 Extreme Reversal EA opens trades according to the following calculations: - ATR - TMA  - Cycles - Murrey Math Calculations - Moving Averages Extreme Reversal EA works on every timeframe and instrument. Full alert and push notification functions. INPUTS: GLOBAL VARIABLES: MAGIC NUMBER: CHANGE THE VALUE TO TRADE ON THE SAME INSTRUMENT / TIMEFRAME ORDER LOTS: MANUAL / USER DEF
IQ Signals
Eadvisors Software Inc.
The best indicator for Binary Options is now available at the MQLMarket, this version is already configured and optimized to operate with Binary Options, Forex and Cryptocurrencies. It is composed of a momentum algorithm that looks for better opportunities in the market, bringing you the best points to open your positions with low risk and high proportion of gain. The MQL version can also be incorporated into the MT2 signal automator.     Product features Common signals (Oscillator) Super
ToTheMoon MT4
Daniel Moraes Da Silva
5 (1)
ONE OF THE FEW ROBOTS WITH A SIGNAL HISTORY OF MORE THAN 3 YEARS AND AMONG THE TOP 10.   LINK TO MY ROBOTS AND SIGNAL PRESETS: In my profile there is a link to download the PRESETS that I use in my SIGNALS, you can download and Backtest for free, there are explanations in the my WebSite. https://www.mql5.com/en/users/tec_daniel   LINK TO OTHER ROBOT VERSIONS: MT4:  https://www.mql5.com/en/market/product/97963 MT5:  https://www.mql5.com/en/market/product/97962   SOME EXAMPLES OF SIGNALS ON “mql5.
Breakout Monster Mini
Abdulfattah Yahya Mohammed Alhazmi
5 (3)
It is a very profitable EA, to trade trends breakout, and manage trades, takeprofit, stoploss, move to breakeven, and trailing stop. I work with this EA, and the reversal/pullback version since 2014.  This is a demo   version of the full   Breakout Monster EA . It works on Real and Demo accounts. Demo version restrictions: Money Management is disabled. Lot size is restricted to 0.01 lots only (Or the minimum allowed by broker). Numerical, SL and TP set to 100 pips. They cannot be modified in
FREE
Breakout Monster Expert Advisor
Abdulfattah Yahya Mohammed Alhazmi
For The English Manual you can contact me. The Most advanced and comprehensive EA to trade Trend Breakout The “Breakout Monster EA” trades breakouts when the current price of the currency pair breaks a predefined horizontal level or trendline on the currency pair's chart. The opening of the position can be immediate after breaking the drawn trendline OR after closing the candle above/below this trend, provided that all technical and non-technical filters, defined by the trader through the exp
Al in one level
Kundan Kumar Srivastava
5 (1)
This indicator is collection of important dynamic support and resistance giving a trader crystal clear idea , where to sell and where to buy. it completely complements trend lines, support, resistance, and sideways market and allow a trader to make sustainable profits. The thickness of lines suggests its strengths, the thicker the dynamic line, the stronger is rejection or pullback allowing a trader to make multi-fold profit, as they can clearly see them. Introducing Your Ultimate Trading Edge:
Binary Option Signal
Yaroslav Varankin
Indicator for binary options arrow is easy to use and does not require configuration works on all currency pairs, cryptocurrencies buy signal blue up arrow sell signal red down arrow tips do not trade during news and 15-30 minutes before their release, as the market is too volatile and there is a lot of noise it is worth entering trades one or two candles from the current period (recommended for 1 candle) timeframe up to m 15 recommended money management fixed lot or fixed percentage of the depo
Atena Gold EA
Igor Pereira Calil
Atena 專家是 Meta Trader 的機器人,目標是根據機器人本身的趨勢和策略進行工作。 免費安裝 Atena Gold EA 並在您的帳戶上運行,請私訊詢問我。 Atena 的開發旨在提高美國金屬(黃金、XAUUSD)交易的安全性。 Atena GOLD 是一個長期機器人,每周和每月利潤,如果有時需要一些時間才能關閉,請不要太驚慌。 請記住,Athena 在市場趨勢、買入和賣出中運作,無論您是否有任何舊的(恢復)訂單未結,您的資金將始終在上漲:)! 下面附上1年的回測,如果有疑問或想測試,可以租用Atena 1個月,或是下載DEMO版本。 Athena 在市場的兩個方向上操作,買入和賣出,對沖,保護多頭訂單並賺取利潤,在逆勢中,她執行訂單恢復程序(與 Martingale 類似,但不完全一樣)。 所開發的回收系統是根據市場走勢而開發的,所以不會有太多的未平倉訂單,在買賣獲利的同時,會平倉以增加帳戶資金,這就是持倉的秘訣之一。大量虧損。 Atena 根據市場趨勢關閉利潤,但您可以在設定中或透過啟動 BreakEven 或 TrailStop 選項(預設為停用)來更改這
Buy Sell Signal Pro Looking for a precise and efficient swing detection tool that clearly identifies market structure turning points? Need consistent and easy-to-read buy and sell signals across different timeframes and instruments? Buy Sell Signal Pro  is designed to deliver accurate swing identification with a clean and practical approach, helping traders interpret price structure with confidence. Overview This indicator detects key market structure points, including: Higher Highs (HH) Higher
该产品的买家也购买
Miraculous Indicator Binary & Forex v3 StrategySafe Miraculous Indicator Binary & Forex v3 StrategySafe 是一款专业交易指标,适合希望获得清晰信号、强大确认工具以及结构化交易方式的 Binary 和 Forex 交易者。 v3 版本加入了 MIR Dashboard、Miraculous Confirmation Dashboard、GANN Law、Square of 9 水平线、GANN 角度以及更强的 Forex 分析模式。 核心功能 同时支持 Binary 和 Forex 交易模式。 MIR Dashboard 可快速读取市场状态。 Miraculous Confirmation Dashboard 用于确认交易机会。 GANN Law drawing lines 用于 Forex 市场结构分析。 Square of 9 线条、方向和关键价格水平。 1x1 GANN Angle 用于判断趋势压力。 Entry Information TP 帮助寻找合理止盈区域。 Strateg
FFx Engulfing Setup Alerter gives trade suggestions with Entry, Target 1, Target 2 and StopLoss. Below are the different options available: Entry suggestion - pips to be added over the break for the entry 3 different options to calculate the SL - by pips, by ATR multiplier or at the pattern High/Low 3 different options to calculate the 2 TPs - by pips, by ATR multiplier or at Risk/Reward Offset the dashboard - any place on the chart Remove the suggestion once the price reached the SL line Lines
FFx InsideBar Setup Alerter gives trade suggestions with Entry, Target 1, Target 2 and StopLoss. Below are the different options available: Entry suggestion - pips to be added over the break for the entry Minimum candle size - to avoid too close buy/sell entry suggestions 3 different options to calculate the SL - by pips, by ATR multiplier or at the pattern High/Low 3 different options to calculate the 2 TPs - by pips, by ATR multiplier or at Risk/Reward Offset the dashboard - any place on the c
FFx OutsideBar Setup Alerter gives trade suggestions with Entry, Target 1, Target 2 and StopLoss. Below are the different options available: Entry suggestion - pips to be added over the break for the entry. 3 different options to calculate the SL - by pips, by ATR multiplier or at the pattern High/Low. 3 different options to calculate the 2 TPs - by pips, by ATR multiplier or at Risk/Reward. Offset the dashboard - any place on the chart. Remove the suggestion once the price reached the SL line.
FFx PinBar Setup Alerter gives trade suggestions with Entry, Target 1, Target 2 and StopLoss. Below are the different options available: Entry suggestion - pips to be added over the break for the entry Minimum candle size - to avoid too small candles 3 different options to calculate the SL - by pips, by ATR multiplier or at the pattern High/Low 3 different options to calculate the 2 TPs - by pips, by ATR multiplier or at Risk/Reward Offset the dashboard - any place on the chart Remove the sugges
Lineverse Trendlines
Arkady Segal
5 (1)
Automatic, live & interactive picture of all trendlines. Assign push, email and sound alerts to the lines of your choice and be informed about price rollback, breakout, rollback after breakout, number of rollbacks, line expiration by double breakout. Correct, drag or delete the lines and interactively tune the line system. https://youtu.be/EJUo9pYiHFA . Chart examples https: //www.mql5.com/en/users/efficientforex Price Interaction Events All events are effective immediately and only after one
FFx MACD Divergences
Eric Venturi-Bloxs
The purpose of this new version of the MT4 standard indicator provided in your platform is to display in a sub-window multiple timeframes of the same indicator with its divergences. See the example shown in the picture below. But the display isn't like a simple MTF indicator. This is the real display of the indicator on its timeframe. Here's the options available in the FFx divergences indicator: Select the timeframes to be displayed (M1 to Monthly) Define the width (number of bars) for each tim
FFx RSI Divergences
Eric Venturi-Bloxs
The purpose of this new version of the MT4 standard indicator provided in your platform is to display in a sub-window multiple timeframes of the same indicator with its divergences. See the example shown in the picture below. But the display isn't like a simple MTF indicator. This is the real display of the indicator on its timeframe. Here's the options available in the FFx divergences indicator: Select the timeframes to be displayed (M1 to Monthly) Define the width (number of bars) for each tim
FFx CCI Divergences
Eric Venturi-Bloxs
The purpose of this new version of the MT4 standard indicator provided in your platform is to display in a sub-window multiple timeframes of the same indicator with its divergences. See the example shown in the picture below. But the display isn't like a simple MTF indicator. This is the real display of the indicator on its timeframe. Here's the options available in the FFx divergences indicator: Select the timeframes to be displayed (M1 to Monthly). Define the width (number of bars) for each ti
The FFx Dashboard MTF alerter will show you on a single chart all the timeframes (M1 to Monthly) with their own status for the indicator. 2 Alert Options: Single timeframe: each selected timeframe alert separately when a signal occurs Multi timeframes: all selected timeframes must agree for an alert to be triggered Both options have an input to select the timeframes to be used for the alert(s). How to Understand the Status: Green/Red square: histogram above/below 0 line Green square + Red bord
The FFx Dashboard MTF alerter will show you on a single chart all the timeframes (M1 to Monthly) with their own status for the indicator. 2 Alert Options: Single timeframe: each selected timeframe alert separately when a signal occurs Multi timeframes: all selected timeframes must agree for an alert to be triggered Both options have an input to select the timeframes to be used for the alert(s). How to understand the status: Green/Red square: RSI above/below 50 line Green square + Red border: R
The FFx Dashboard MTF alerter will show you on a single chart all the timeframes (M1 to Monthly) with their own status for the indicator. 2 Alert Options: Single timeframe: each selected timeframe alert separately when a signal occurs Multi timeframes: all selected timeframes must agree for an alert to be triggered Both options have an input to select the timeframes to be used for the alert(s). How to understand the status: Green/Red square: Stoch above/below 50 line Green square + Red border:
The FFx Dashboard MTF alerter will show you on a single chart all the timeframes (M1 to Monthly) with their own status for the indicator. 2 Alert Options: Single timeframe: each selected timeframe alert separately when a signal occurs Multi timeframes: all selected timeframes must agree for an alert to be triggered Both options have an input to select the timeframes to be used for the alert(s). How to understand the status: Green/Red square: Price above/below Cloud (Kumo) Green square + Red bo
The FFx Dashboard MTF alerter will show you on a single chart all the timeframes (M1 to Monthly) with their own status for the indicator. 2 Alert Options: Single timeframe: each selected timeframe alert separately when a signal occurs Multi timeframes: all selected timeframes must agree for an alert to be triggered Both options have an input to select the timeframes to be used for the alert(s). How to understand the status: Green/Red square: MA pointing Up/Down Green square + Red border: MA po
The FFx Dashboard MTF alerter will show you on a single chart all the timeframes (M1 to Monthly) with their own status for the indicator. 2 Alert Options: Single timeframe: each selected timeframe alert separately when a signal occurs. Multi timeframes: all selected timeframes must agree for an alert to be triggered. Both options have an input to select the timeframes to be used for the alert(s). How to understand the status: Green square: Price above PSAR Red square: Price below PSAR Options
The FFx Dashboard MTF alerter will show you on a single chart all the timeframes (M1 to Monthly) with their own status for the indicator. 2 Alert Options: Single timeframe: each selected timeframe alert separately when a signal occurs Multi timeframes: all selected timeframes must agree for an alert to be triggered Both options have an input to select the timeframes to be used for the alert(s). How to understand the status: Green/Red square: CCI above/below levels (ie. 100/-100) Grey square: C
The FFx Dashboard MTF alerter will show you on a single chart all the timeframes (M1 to Monthly) with their own status for the indicator. 2 Alert Options: Single timeframe: each selected timeframe alert separately when a signal occurs Multi timeframes: all selected timeframes must agree for an alert to be triggered Both options have an input to select the timeframes to be used for the alert(s). How to understand the status: Green/Red square: ADX above level Grey square: ADX below level Red bor
The FFx Dashboard MTF alerter will show you on a single chart all the timeframes (M1 to Monthly) with their own status. 2 Alert Options: Single timeframe: each selected timeframe alert separately when a signal occurs Multi timeframes: all selected timeframes must agree for an alert to be triggered Both options have an input to select the timeframes to be used for the alert(s). How to understand the status: Green/Red square: bullish/bearish candle Options available in the FFx Dashboard Alerter
The indicator of a Professional Trader is an arrow indicator for predicting the direction of price movement. I have been working on this indicator since 2014. You can use this indicator as your main indicator, use its entry signals, and use it as your only indicator to find entry points. About the product: Recommended TF [H4-D1-W1]   . The indicator predicts the direction of the next candle. Fits a variety of tools; Flexibility in settings for different instruments and intervals through the MO
THE GRAFF III
Charles Harper
The [GRAFF] III manual trading system is based on multiple MetaTrader (MT4) indicators. Together, the entire PACK of GRAFF III indicators makes an advanced trading tool. The system consists of over 20 different custom-built indicators which have been carefully selected and tested in the long term to produce strong and efficient trading signals. The particular indicators are based on different mathematical formulas, so the entire system is calibrated to remove false signals from its own indicator
FFx Universal Strength Meter PRO is more than a basic strength meter. Instead of limiting the calculation to price, it can be based on any of the 19 integrated strength modes + 9 timeframes. With the FFx USM, you are able to define any period for any combination of timeframes. For example, you can set the dashboard for the last 10 candles for M15-H1-H4… Full flexibility! Very easy to interpret... It gives a great idea about which currency is weak and which is strong, so you can find the best pai
A simplistic indicator informing a user on RSI divergence by sending messages to mobile device and email. The indicator draws 2 vertical lines, marking two RSI extrema that formed the divergence. You get the alert, open the charts and make a decision. The indicator does not show past divergences, thus when you attach it to a chart for the first time you see nothing. Graphics and alerts will appear as soon as divergences do. Drop it in Tester to see how it works. Parameters: RSIPeriod - number of
Pan PrizMA CD Phase is an analogue of the МetaТrader 5 indicator , and is an option based on the Pan PrizMA indicator. Details . Averaging by a quadric-quartic polynomial increases the smoothness of lines, adds momentum and rhythm. Extrapolation by the sinusoid function near a constant allows adjusting the delay or lead of signals. The value of the phase - wave status parameter (which is close in meaning to the trigonometric phase or the angle of the radius-vector rotation in the trigonometric p
Green Wall Arrows
Daniel Luchinger
1 (1)
The Name Green Wall : Arrows hits a lot of TP, by changing the idea of non using SL as something bad, but instead use Small TP and a lot of free Margin and Patience. Use micro TP and a lot of Free Margin with this indicator on Forex. It also can be used with Binary Options. This strategy is intended to be traded Manually. This Indicator runs on Open Bar, arrows will delete when price are against it. The only Indicator Parameter is Alerts true/false, all the rest is included inside the code. Arro
Golden Monowave
Ahmed Mohamed Ali
Golden Monowave is monowave indicator, the monowave theory is one of Elliott wave approach and one of most complicate and accurate method. Golden Monowave can shortcut many major steps to identify and describe the monowave. It works on any timeframe and with any trading instrument, including currencies, indices, futures, etc. Input Parameters initial_Bars - set the initial number of bars to calculate. wave_color - select the color of the wave. label_color - select the color of labels. temp_labe
Ticks Size
Viktor Kolmakov
This indicator displays in a separate window the difference between the number of points which increased the price, and the number of points that decreased the price during the time interval specified in the settings. The time interval for calculation is expressed as the number of bars of the chart the indicator is attached to. This approach allows you to evaluate the movement direction (growth or fall) of the instrument's price, the strength of the movement and the size of the movement in point
FFx Basket Scanner
Eric Venturi-Bloxs
MetaTrader 5 version available here : https://www.mql5.com/en/market/product/24882 FFx Basket Scanner is a global tool scanning all pairs and all timeframes over up to five indicators among the 16 available. You will clearly see which currencies to avoid trading and which ones to focus on. Once a currency goes into an extreme zone (e.g. 20/80%), you can trade the whole basket with great confidence. Another way to use it is to look at two currencies (weak vs strong) to find the best single pairs
NostradamusMT4
Andrey Spiridonov
1 (1)
NostradamusMT4 is a powerful indicator from the set of professional trader. The indicator is based on Andrei Spiridonov's original price calculation method (ESTIMATED PRICE) for the current candle price. Advantages The indicator does not redraw. It works on any timeframes. Works with any trading instruments. Perfectly suitable for scalping and trading binary options. Parameters Color - color of the ESTIMATED PRICE FUTURE line. How to work with the indicator The indicator forms the ESTIMATED P
作者的更多信息
ORB Seeker MT5
Marcela Goncalves De Oliveira
特价促销,限量供应,保持产品稀缺性! 仅售 599 美元! 购买后请联系我以获取奖励的 ORB Seeker EA 和个人优化设置文件。 自信地捕捉干净利落的比赛片段! ORB Seeker MT5 是一款专业的开盘区间突破 (ORB) 指标,专为追求准确性、简洁性、灵活性和清晰图表结构的交易者而设计。 它能自动绘制任何交易品种的盘前或自定义交易时段区间,然后给出清晰的突破信号,包括入场点、止损点、止盈点以及可选的50%部分止盈位。所有数据均实时计算并直接显示在图表上。 您可以选择交易伦敦开盘、纽约交易时段、亚洲交易时段,或者自定义交易时段。ORB Seeker MT5 会自动适应您选择的交易时段,让您精准掌握市场波动范围、突破位和交易位。 每次购买均免费赠送 ORB Seeker EA 智能交易系统。该 EA 系统读取指标的突破信号并可自动下单,您可以选择手动交易,也可以让 EA 系统根据指标的信号逻辑自动处理入场。   为什么选择 ORB Seeker MT5 支持多个交易时段 - 您可以自行设置伦敦、纽约、亚洲或自定义交易时段的盘前交易时间和交易时段。 完整的突破视觉效果 -
筛选:
Gabriele Bozzolan
348
Gabriele Bozzolan 2026.08.22 10:13 

I purchased the indicator in question on August 12, 2026, and installed it on my MT4, as is standard practice. I used the set file given to me by the indicator's owner, along with the free EA—and that's not something everyone gets for free. I want to clarify one thing: I only used the files given to me, never changed anything, and used the default settings. The following day, everything went well. On Friday, two stops in a row—that's understandable. I should point out that the stop losses are double the winnings. On Monday, nothing happened, for some reason. On Tuesday, two stops in a row, and I didn't like it. On Wednesday morning, I found myself with another two stops in a row. At this point, I decided to unplug everything, as I was dissatisfied with the results. Too many stops in a row, in three days. I repeat: I only used the settings given to me. I'm reporting this to the indicator's owner. A series of messages begins with these, in which I reiterate that I used the settings he sent me and that I haven't made any changes. Finally, I say I'll leave a negative review for the indicator. The owner responds: I'm not cooperating, the indicator is profitable, as I told you, I'm using it myself and I'm not losing money, so there's something wrong on your end. What do I have to do with this? As I've said several times, I only used the settings provided to me, as they were. The owner adds: Users never like to admit they're wrong, they always blame the product. It's a shame. I repeat for the umpteenth time: what do I have to do with this? I only used the recommended settings. I reply to the messages the owner of the indicator sent me, confirming that I will leave a negative review and that I will no longer respond to his messages. He responds: You're responding like someone who doesn't want to admit they're at fault, that's fine, it's common human behavior. I know I'm right because the indicator is profitable; even last night I won and had more wins than losses. So why are you losing, while I and my other users are winning? Logic suggests that something is wrong on your end, whether you like it or not. Furthermore, you've only been using the indicator for a week. A week is not enough time to properly evaluate a product, especially if you haven't tested it first on a demo account to familiarize yourself with all its features. To understand if a product really works, you need to give it more time; every professional trader knows this. You're not cooperating, and if you continue to leave a negative review, as you're threatening, I'll simply respond with the truth and publish all the screenshots of this conversation so everyone can see the entire history and understand that your negative statement is false and that I'm not hiding anything. I wish you'd let me help you so you can try the indicator like me and other users, but you don't want to. It doesn't have to be this way; I want all my users to be happy. I'm sorry I tried. I'm replying to this last message I received, published in its entirety. I never threatened anyone; the threats are different. I simply stated what happened to me with the indicator, and nothing more. Feel free to publish all the conversations I had with him; I have nothing to fear. Everyone who reads this review should make their own assessment.

Marcela Goncalves De Oliveira
505
来自开发人员的回复 Marcela Goncalves De Oliveira 2026.08.24 18:49
I'm going to repeat a few things that I told you in our chat for you to understand, again. What I said is true; I don't understand how you could have lost when the other users and I did not. Clearly there is something wrong on your side. Furthermore, like I said, you had only been using the indicator for a week. One week is not enough time to properly evaluate a product, especially if you haven't tested it first on a demo account to familiarize yourself with all its features. To understand if a product really works, you need to give it more time. I attempted to assist you multiple times, but you were uninterested in receiving help; after a few days, you simply gave up and made your decision. You expected instant perfect results, which does not exist. I've said before that the indicator can lose sometimes; such a result is perfectly normal. Your expectations are not. I'm sorry that you have closed your mind to receiving any help so you can use the indicator successfully and make profit like the rest of us are doing. Good luck.
回复评论