Dynamic ATR Percentile
- Indicators
- Version: 1.0
- Activations: 20

Dynamic ATR Percentile
Overview
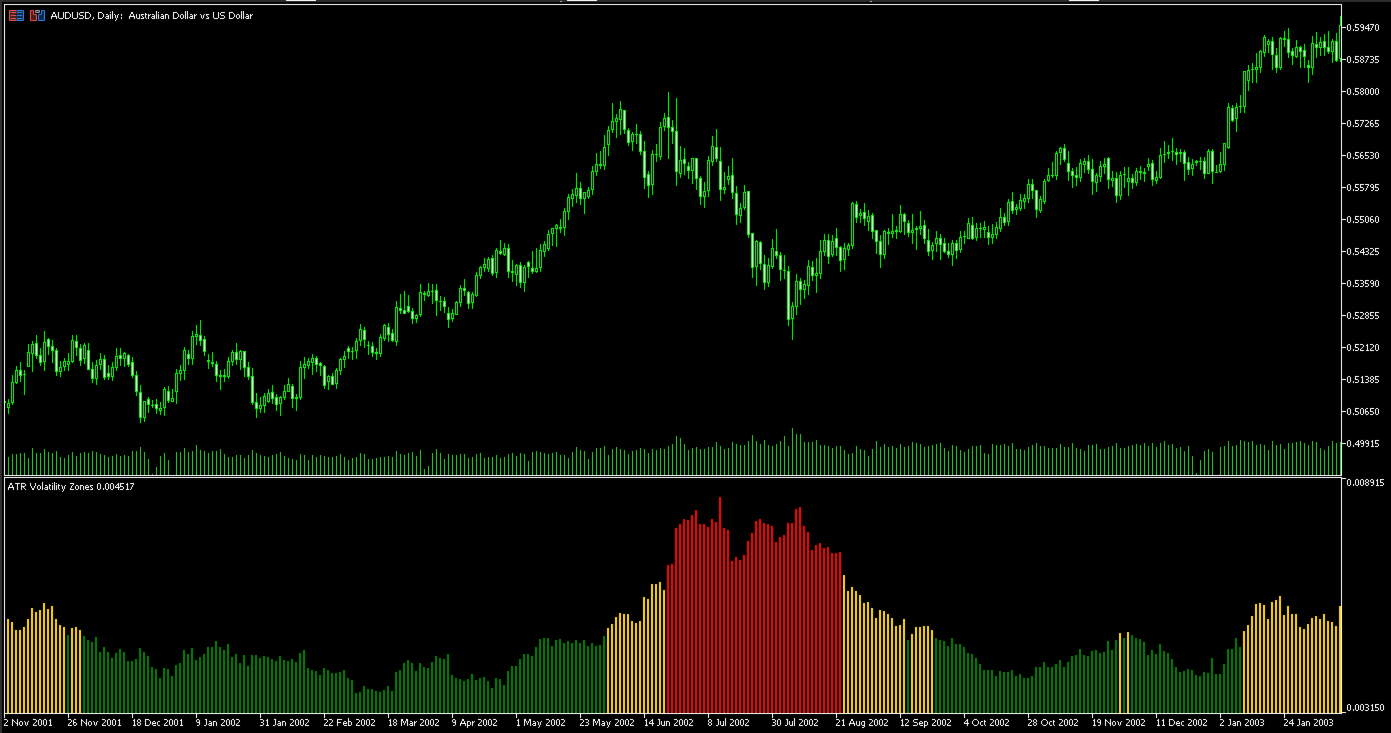
The Dynamic ATR Percentile is a volatility analysis tool designed to help traders objectively gauge current market conditions. Volatility is not static; what is considered a "high" ATR value for one instrument or timeframe can be "low" for another. This indicator solves that problem by calculating dynamic volatility zones based on historical data, providing a clear and adaptive visual guide.
Instead of relying on fixed ATR values, this indicator analyzes the recent history of the instrument you are trading and determines what is statistically low, normal, or high volatility for that specific context.
How It Works
The indicator's logic is based on the standard Average True Range (ATR) and statistical percentiles.
-
It first calculates the ATR for each bar.
-
It then looks back over a user-defined number of previous bars (the Lookback Period) to build a historical sample of ATR values.
-
Using this sample, it calculates percentile-based thresholds. For example, it determines the ATR value below which 15% of historical readings fall (low volatility) and the value above which the top 15% of readings fall (high volatility).
-
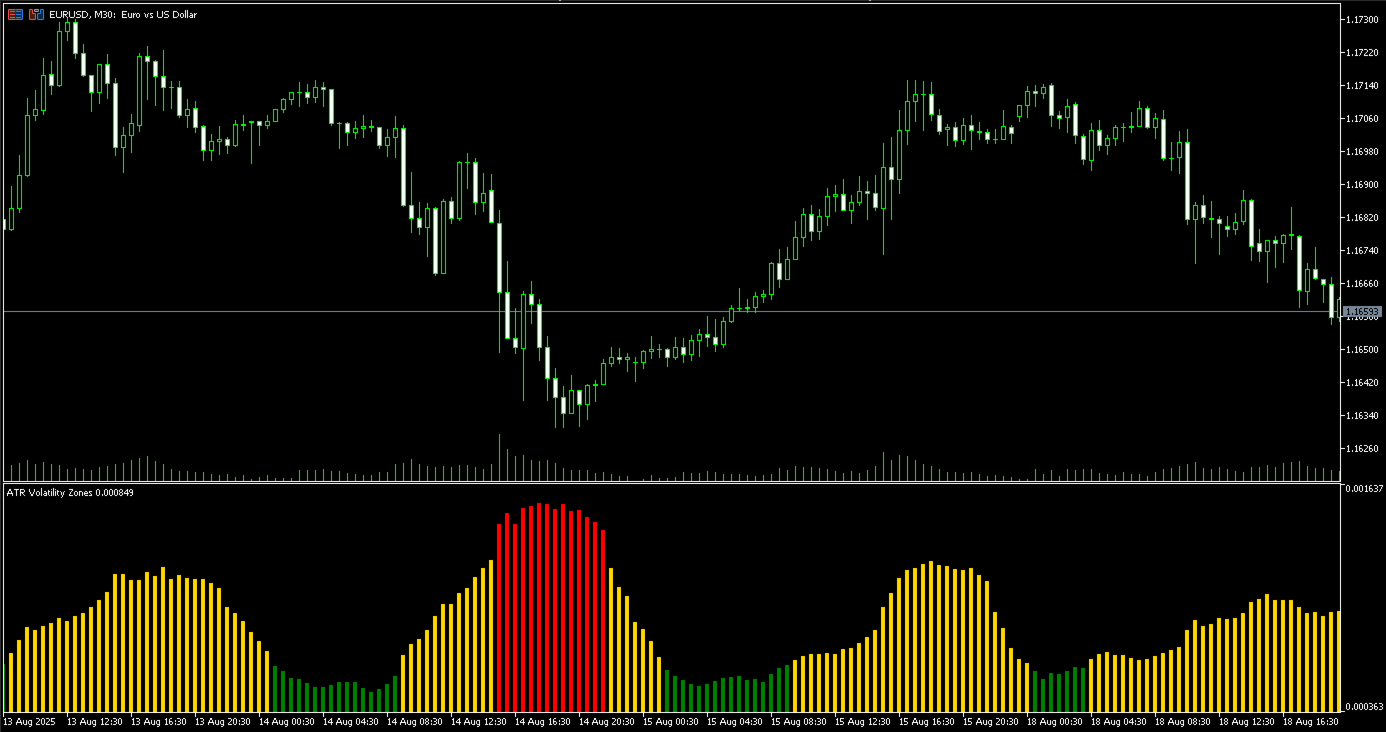
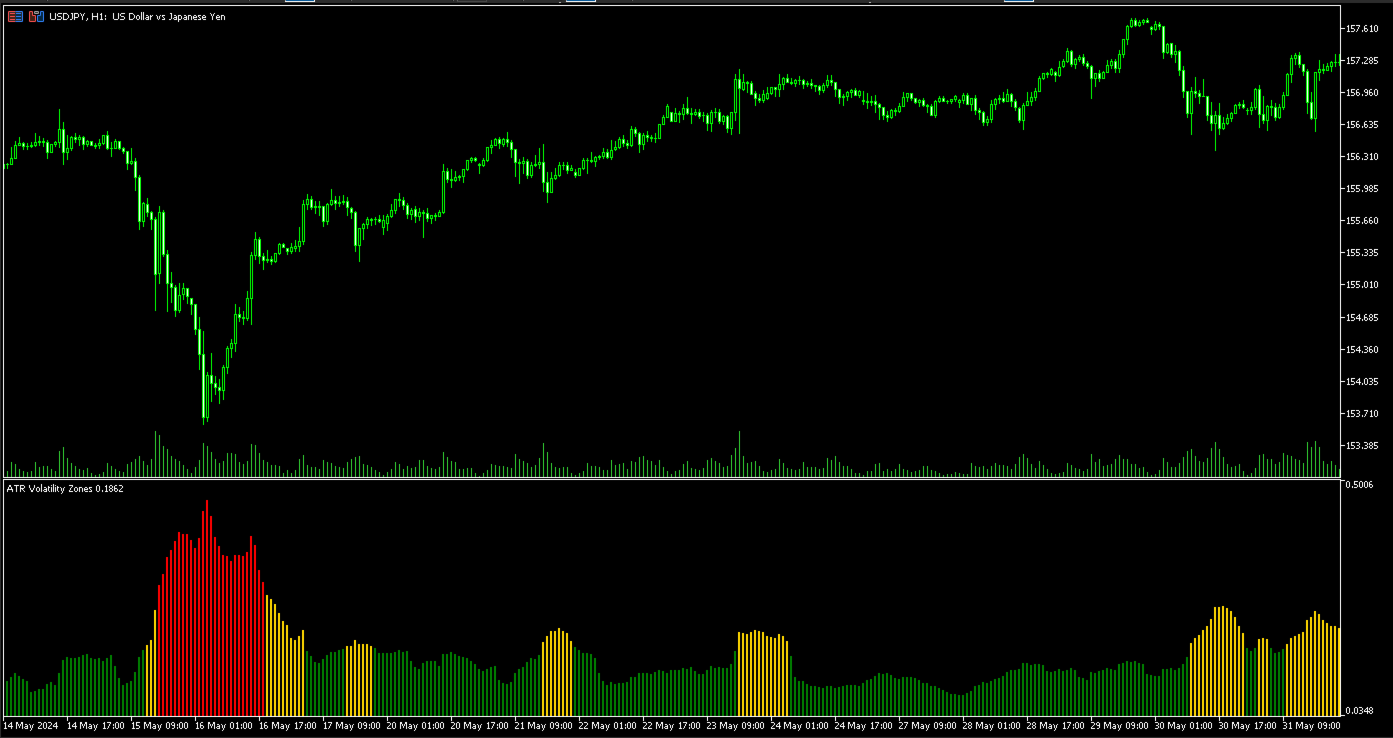
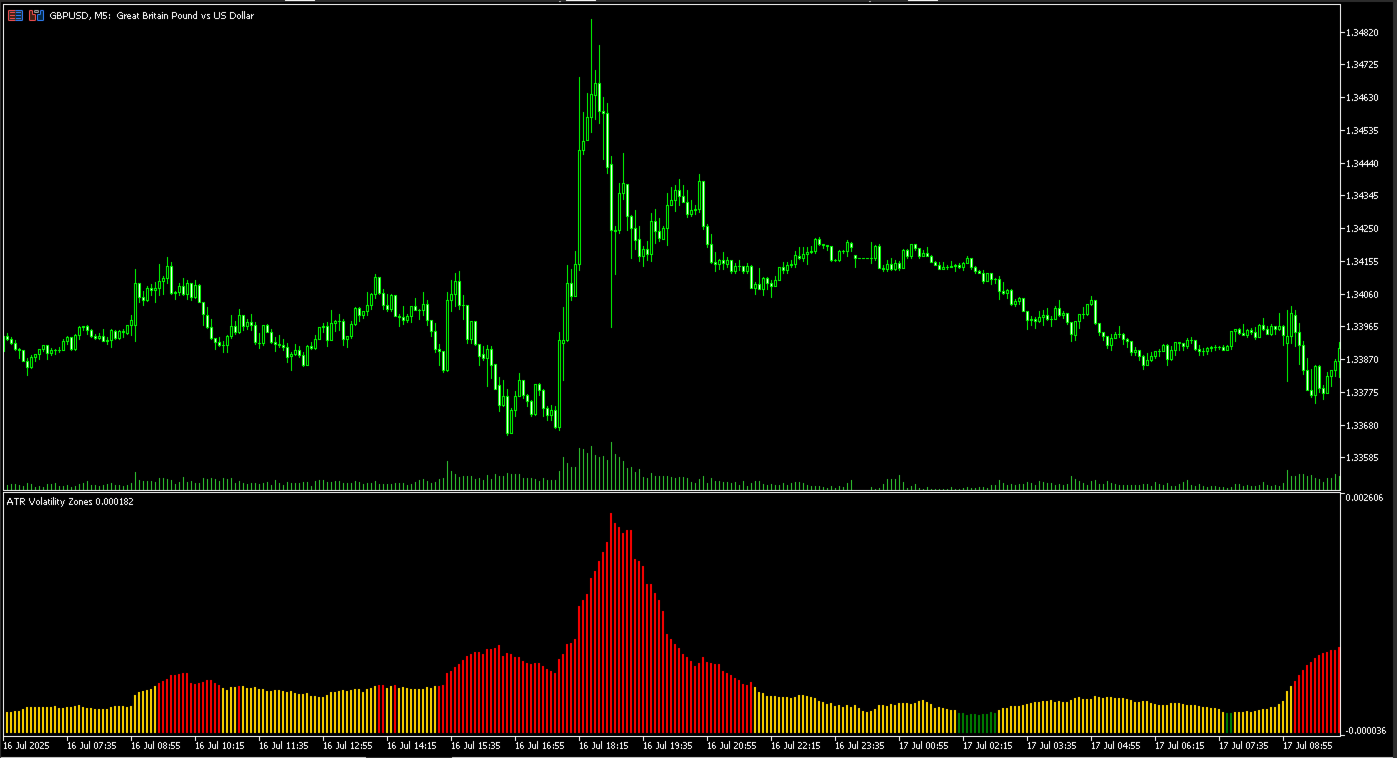
The current ATR value is then compared to these dynamic thresholds and displayed as a color-coded histogram.
This method ensures that the volatility analysis is always relevant and tailored to the specific instrument and timeframe being viewed.
Features and Benefits
-
Fully Adaptive Analysis: The percentile-based calculation automatically adjusts to any market, whether it's a slow-moving Forex pair, a volatile stock index, or a cryptocurrency. It works consistently across all timeframes.
-
Clear Visual Signals: The intuitive, color-coded histogram provides an at-a-glance understanding of the current market state, removing guesswork from volatility assessment.
-
Green Bar: Represents low volatility. The market may be in a consolidation phase or ranging.
-
Gold Bar: Represents normal or average volatility conditions.
-
Red Bar: Represents high volatility. The market may be trending strongly or experiencing a news-driven event.
-
-
Customizable Thresholds: You have full control over the parameters, allowing you to define what constitutes "low" and "high" volatility to perfectly align with your trading strategy and risk tolerance.
How to Use in Trading
The Dynamic ATR Percentile is a versatile tool that can complement various trading strategies.
-
As a Market Filter: It can help traders decide which strategy to apply. For example, a trader might focus on range-bound strategies during periods of low volatility (green bars) and switch to breakout or trend-following strategies when volatility is high (red bars).
-
For Risk Management: High volatility periods (red bars) can serve as a reminder that market movements are larger, which may influence the placement of stop-loss orders or the adjustment of position sizes.
-
Identifying Changes in Market Character: A transition from a long period of green bars to gold and then red can signal a potential breakout and the start of a new trend.
Important Note on Data Availability
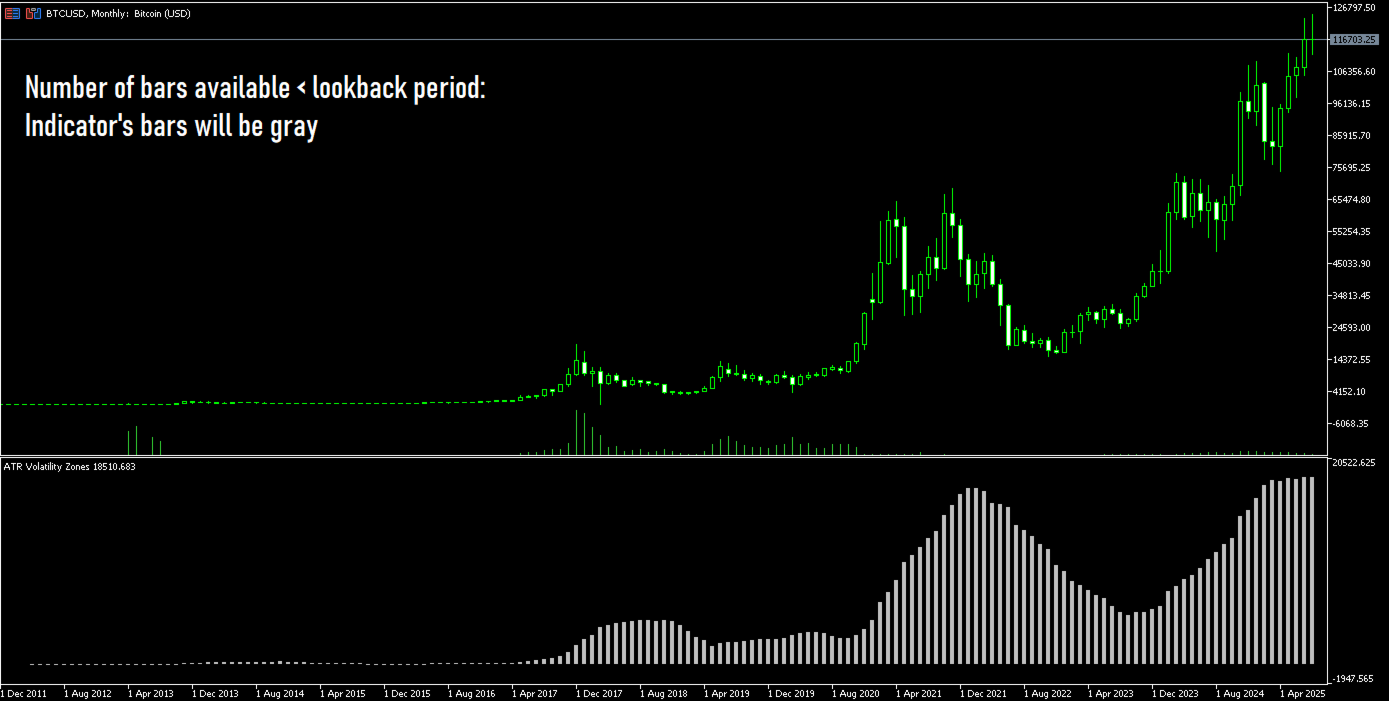
The indicator requires a sufficient amount of historical data to perform its percentile calculations. If the number of bars available on the chart is less than the Lookback_Period you have set, the dynamic zones will not be calculated. In this situation, the indicator will still plot the ATR values, but the histogram bars will be colored gray. This color indicates that the data is preliminary and not yet based on the full statistical analysis. Adjust the lookback period accordingly.
Input Parameters
-
ATR_Period (Default: 14): The period used for the standard Average True Range (ATR) calculation.
-
Lookback_Period (Default: 400): The number of past bars to analyze for calculating the volatility percentiles. A larger value provides a more stable, long-term view of volatility.
-
Percentile_Min (Default: 15.0): The lower percentile threshold. A value of 15.0 means that ATR values falling within the bottom 15% of the lookback period will be considered "low volatility" (Green).
-
Percentile_Max (Default: 85.0): The upper percentile threshold. A value of 85.0 means that ATR values falling within the top 15% (100 - 85) of the lookback period will be considered "high volatility" (Red).