MA Percentile Bands
- Indicators
- Version: 1.0
- Activations: 20

MA Percentile Bands
This indicator provides a nuanced and statistical approach to analyzing the relationship between two moving averages. Instead of focusing solely on crossovers, MA Percentile Bands measures the distance between a fast and a slow moving average and compares it against its own recent history. This allows traders to identify when the separation between the MAs is statistically significant, providing unique insights into market momentum and potential exhaustion points.
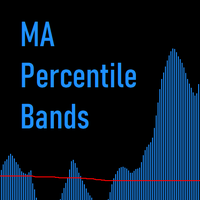
The indicator is displayed in a separate window for clarity and consists of two main components:
-
MA Distance (Histogram): This shows the absolute distance between the fast and slow moving averages for each bar. A rising histogram indicates the MAs are moving further apart, suggesting increasing momentum.
-
Percentile Threshold (Line): This is the core feature of the indicator. It calculates a dynamic threshold based on a user-defined percentile of the MA distances over a specified lookback period. For example, a 90th percentile setting means the line represents a distance level that has only been surpassed 10% of the time within the lookback period.
How It Works and Its Benefits
The primary advantage of the MA Percentile Bands is its self-adapting nature. The "normal" distance between two moving averages varies greatly depending on the asset's volatility and the chart's timeframe. A 20-pip gap might be significant on an M15 chart for EUR/USD but negligible on a Daily chart for a volatile cryptocurrency.
The Percentile Threshold solves this problem. It automatically calculates what constitutes a "large" or "unusual" separation based on the instrument's recent behavior. This means the indicator provides consistent context without needing manual adjustments when you switch between different symbols or timeframes.
How It Can Be Useful in Trading Analysis
Traders can use the information provided by MA Percentile Bands in several ways:
-
Identifying Potentially Overextended Moves: When the MA Distance histogram rises above the Percentile Threshold line, it signals that the current price move has pushed the moving averages apart to an extent that is historically uncommon. This can suggest that a trend is overextended and may be due for a consolidation or a pullback.
-
Gauging Trend Momentum: A sustained period where the MA Distance remains high (though not necessarily above the threshold) can indicate a strong, healthy trend. Conversely, a declining histogram suggests that momentum is fading, which could precede a trend change.
-
Volatility Filter: The level of the Percentile Threshold line itself can act as a gauge for volatility. A rising threshold line indicates that the typical distance between the MAs is increasing, signaling a more volatile market environment.
Input Parameters
The indicator is fully customizable to suit your trading style and analysis needs.
Moving Averages Settings
-
Fast MA Period: The period for the faster moving average.
-
Slow MA Period: The period for the slower moving average.
-
MA Method: The calculation method for the moving averages (e.g., Simple, Exponential, Smoothed, Linear Weighted).
-
Price Source: The price source to be used for the MA calculations (e.g., Close, Open, Median).
Historical Filter Settings
-
Lookback Period: The number of past bars used to calculate the historical percentile. A larger value provides a more statistically stable threshold, while a smaller value makes it more reactive to recent market changes.
-
Percentile Threshold (%): The percentile level used to calculate the threshold line. A value of 90 means the line will be set at a level that the MA distance has been below for 90% of the lookback period. This helps you define what you consider to be a statistically significant deviation.